Abstract
Cilia of olfactory sensory neurons (OSN) are the primary sensory organelles for olfaction. The detection of odorants by the main olfactory epithelium (MOE) depends on coupling of odorant receptors to the type 3 adenylyl cyclase (AC3) in olfactory cilia. We monitored the effect of airflow on electro-olfactogram (EOG) responses and found that the MOE of mice can sense mechanical forces generated by airflow. The airflow-sensitive EOG response in the MOE was attenuated when cAMP was increased by odorants or by forskolin suggesting a common mechanism for airflow and odorant detection. In addition, the sensitivity to airflow was significantly impaired in the MOE from AC3−/− mice. We conclude that AC3 in the MOE is required for detecting the mechanical force of airflow, which in turn may regulate odorant perception during sniffing.
Keywords: cilia, mechanosensation, airflow, olfaction, type 3 adenylyl cyclase
Introduction
Olfactory perception starts with an inhalation of odorants into the nasal cavity and is optimized by sniffing of odorants. Odorants then bind to olfactory receptors in olfactory cilia to stimulate AC3 (Wong et al., 2000) through the G-coupling protein, Golf (Jones and Reed, 1989). The cAMP generated by AC3 binds to and triggers the opening of cyclic nucleotide–gated (CNG) channels (Nakamura and Gold, 1987), resulting in calcium entry, depolarization and initiation of action potentials in olfactory sensory neurons which are transmitted to the olfactory bulb for signal integration (for a review see (Touhara and Vosshall, 2009).
Binding of odorants to olfactory receptors not only activates olfactory sensory neurons (OSN), but also causes subsequent desensitization and adaptation via cAMP-dependent protein kinase (Boekhoff et al., 1994). Olfactory adaptation is also mediated by elevated Ca2+ which attenuates the activity of AC3 by calmodulin (CaM) kinase II phosphorylation (Wayman et al., 1995; Wei et al., 1996; Wei et al., 1998), enhances CaM-sensitive cAMP phosphodiesterase activity (Borisy et al., 1992; Yan et al., 1995) and desensitizes CNG channels by direct CaM binding (Munger et al., 2001; Song et al., 2008).
Sniffing is thought to regulate olfaction by several mechanisms (Kepecs et al., 2006; Wachowiak, 2011) including modulation of the olfactory detection threshold (Sobel et al., 2000) and facilitation of discrimination of odorants (Wesson et al., 2009). In addition, sniffing modulates olfaction by shaping the spike timing and firing phase in the main olfactory bulb (MOB) (Schaefer et al., 2006) and by affecting the sensitivity and pattern of glomerular odorant responses in the MOB (Oka et al., 2009). Interestingly, many studies have demonstrated that neural responses in the olfactory system are coupled to respiration or sniff, even in the absence of odorants. For example, slow-wave oscillations in the rat piriform cortex induced by ketamine are functionally correlated with respiration (Fontanini et al., 2003). Moreover, sniffing clean air without odorants can activate the human olfactory cortex and other regions of brain (Sobel et al., 1998a; Sobel et al., 1998b). Air-puffs through the nostrils activate the amygdala in monkey (Ueki and Domino, 1961) and also cause neuronal firing in the MOB of mice (Macrides and Chorover, 1972). Collectively, these studies suggest the interesting possibility that the airflow from sniffing may exert a mechanical force directly on olfactory cilia to activate OSN.
Using single cell patch-clamp recordings, it has been discovered that olfactory cilia of some OSN in the MOE or the septum organ can sense a mechanical force generated by a stream of liquid but the effect of airflow was not examined (Grosmaitre et al., 2007). Furthermore, the signaling pathway for airflow sensitivity is undefined. Here we report that the MOE of mice exhibits airflow-sensitive EOG responses. This response to airflow is desensitized by activation of the olfactory cAMP signaling pathway. In addition, we discovered that type 3 adenylyl cyclase is required for the airflow-sensitive EOG response in the MOE.
Materials and Methods
Chemicals
MDL12330A and SCH202676 were purchased from Tocris. All odorants, forskolin, IBMX and other chemicals were from Sigma.
Mouse strains
C57Bl/6 mice and Sprague Dawley rats were purchased from Charles River. AC3+/+ and littermate AC3−/− mice were bred from heterozygotes and genotyped as previously reported (Wong et al., 2000; Trinh and Storm, 2003; Wang et al., 2006). The MOE of AC3−/− is indistinguishable from AC3+/+ mice. To evaluate the integrity of the MOE of AC3−/− mice, we examined coronial sections from the MOE of AC3−/− mice using olfactory neuronal markers including OMP and Golf (Wong et al 2000). Sections of the MOE from AC3−/− mice showed similar staining patterns for Golf and MOE as AC3+/+ mice. The general architecture of the MOE from AC3−/− mice is indistinguishable from AC3+/+ mice. The age of mice used in this study was 2.5–8 months old. Rat age was 8 weeks. All of the mice used in this study were age-matched males or females. Mice were maintained on a 12 h light/dark cycle at 22°C, and had access to food and water ad libitum. All animal procedures were approved by the Institutional Animal Care and Use Committee at the University of Washington and performed in accordance with their guidelines.
Electro-olfactogram (EOG) recording
EOG recording were performed as previously described with some modifications (Wong et al., 2000; Trinh and Storm, 2003; Wang et al., 2006). Mice were sacrificed by decapitation. Each head was bisected through the septum with a razor blade and the septal cartilage was removed to expose the olfactory turbinates. Air-puffs were applied to the exposed MOE using an automated four-way slider valve that was controlled by a computer via a S48 Stimulator (Glass Technologies, West Warwick, RI). Air puff valve (P/N: 330224S303) was purchased from ASCO scientific and was a magnetic latching, normally closed valves. According to manufacture, the response time of the valve was ~ 5 ms. This valve generates a square wave with constant flow rate when on. The nitrogen stream reaching the MOE was at 22 °C, same as the MOE preparation. Nitrogen puff or humidified nitrogen puff (nitrogen passing over dsH2O in a glass cylinder) gave identical airflow responses but humidified nitrogen was used in most of the experiments because olfactory tissue remained viable for a longer period of time with humidified nitrogen. Odorized air was produced by blowing nitrogen through a horizontal glass cylinder that was half-filled either with 3-heptanone (500 µM) or with an odorant mix. The odor mix was comprised of eugenol, octanal, r-(+)-limonene, 1-heptanol, s-(−)-limonene, acetophenone, carvone, 3-heptanone, 2-heptanone, ethyl vanillin, butyric acid and citralva; each at 50 µM in dsH2O. The air-puff was driven by a pressure tank containing compressed ultra-pure nitrogen gas. If not indicated otherwise, the duration of air puff was 200 ms. The tip of the puff application tube had an inner diameter of 1.3 mm, which was directly pointed to the recording site on the MOE. The distance from tip of the air-puff application tube to surface of the recording turbinate was 1.5–2.0 centimeter. A flow meter (PRS FM43504, Praxair Inc, Seattle, WA) was installed in line to measure the flow rate of air-puffs. EOG recordings were performed using various flow rates. If not otherwise indicated, the flow rate was 2.4 l/min. Recording sites were in the middle of turbinate II of the MOE unless specified otherwise.
The EOG field potential was detected with an agar- and Ringer’s solution-filled glass microelectrode in contact with the apical surface of the olfactory epithelia in an open circuit configuration. A filter paper immersed in Ringer’s solution (125 mM NaCl, 2.5 mM KCl, 1 mM MgCl2, 2.5 mM CaCl2, 1.25 mM NaH2PO4, 20 mM HEPES and 15 mM D-Glucose, pH 7.3, osmolarity 305) was used to hold the sample on a plastic pad during recording. The filter paper was connected to Ringer’s bath solution and also served to connect the recording circuit as the ground electrode was immersed in Ringer’s bath solution. Electrophysiological field EOG signals were amplified with a CyberAmp 320 (Axon Instruments, Foster City, CA, USA) and digitized at 1–10 kHz by means of a Digidata 1332A processor and simultaneously through a MiniDigi 1A processor (Axon Instruments); the signals were acquired online with software pClamp 10.3 (Axon Instruments) and simultaneously with Axoscope 10 (Axon Instruments).
Odorants, forskolin/IBMX, SCH202676, or MDL12330A were applied in Ringers solution (~ 1 ml) (vehicle containing 0.2% DMSO or less) to the surface of the MOE, respectively. Drugs were washed away using Ringer’s solution (~1.5 ml each time, twice). Since residual liquid on the MOE surface prevents EOG recording, a layer of filter paper was put onto the nasal cavity to drain liquid away. In addition, the sample was placed at a slight downward angle to allow residual liquid on the MOE surface to flow away.
Exclusion of artifacts during EOG recording and data analysis
Occasionally, artifacts were seen in the recordings of airflow-sensitive responses due to damaged tissue preparations. Artifacts occurred in less than 5% of the recordings. Artifacts were distinguished from airflow-sensitive changes on the basis of several criteria including the shape of the EOG response. Artifacts usually had symmetric rising and decay phases while airflow-sensitive signals had a fast rising phase (20–80% rising time: 99 ± 2 ms, n = 8) with a relative slow decay phase. The decay phase of airflow-sensitive signals were readily fitted with a mono-exponential function, giving a deactivation time constant of 1400 ± 300 ms (n = 19). Artifacts usually lacked the mono-exponential deactivation phase. In addition, the half-width of maximum response of symmetric artifacts was 282 ± 19 ms (n = 6), which is much shorter than the airflow-sensitive signal (612 ± 56 ms, n = 8; p< 0.01). Furthermore, artifacts did not demonstrate amplitude adaptation upon repetitive stimulation, while the airflow-sensitive response showed adaptation upon rapid repetitive stimulations. In addition, the amplitude of airflow-sensitive responses was much larger than that of artifacts. As reported in Results, airflow-sensitive responses were sensitive to odorants, forskolin/IBMX, or SCH202676 while artifacts were insensitive to these chemical treatments.
Data analysis
Data were analyzed with Clampfit 10.3, Oringin 5 and GraphPad Prism 5. The desensitization and deactivation phases of the EOG field potential were fitted with a mono-exponential function (f(t)= A0 * exp(-t/τ) + a, where τ is the time constant; A0 is the maximal response, a is residual response).The amplitude of EOG field potential from most measurements was normalized to the control group before application of the drug for statistical analysis. The dose (flow rate)-response relationship of field potential was fitted with the Hill function (I = a + (Imax − a)/(1 + (EC50/[FR])n), where Imax is the maximal current; a is residual component; [FR] is flow rate. n is hill coefficient; EC50 is the flow rate at which half-maximal response occurs. We used student's t test (paired or unpaired as appropriate) for two-sample comparison and one-way ANOVA for multiple-sample comparisons. Statistical significance was taken as p < 0.05 and all data are presented as means ± SEM.
Results
Airflow stimulates EOG responses in the mouse MOE
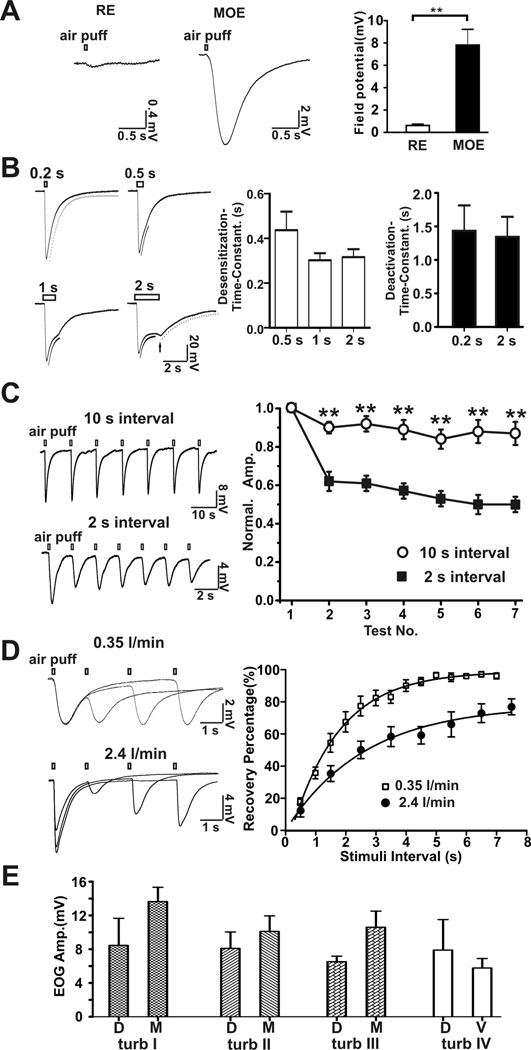
When pure nitrogen was puffed onto the mouse MOE, there was a fast rising airflow-sensitive EOG response followed by a decay phase similar to that generated by odorants (Figure 1A). However, airflow failed to evoke a marked response in the respiratory epithelia (RE) from the nasal cavity. Typical EOG trace recordings at four different air-puff durations (0.2, 0.5, 1 and 2 s) are shown in Figure 1B. The airflow-sensitive EOG responses displayed both desensitization (amplitude decay in the presence of stimuli) and deactivation (amplitude decay in the absence of stimuli) phases. The desensitization time constants were 0.42 ± 0.08 s (n = 6) with a 0.5 s air-puff; 0.30 ± 0.03 s (n = 6) with a 1 s air-puff and 0.32 ± 0.04 s (n = 6) with a 2 s air-puff. The deactivation time constants were 1.4 ± 0.4 s (n =16) with a 0.2 s air-puff and 1.3 ± 0.3 s (n = 6) with a 2 s air-puff. After a 2 s air-puff, the field EOG response exhibited a rebound potential after termination of the air puff (Figure 1B, arrow). These data indicate that olfactory sensory neurons in the MOE are able to sense airflow generated by air puff. We also examined the airflow-sensitive EOG response in response to repetitive air-puffs. The airflow-sensitive response exhibited adaptation; the shorter the inter-stimulation interval, the greater the adaptation (Figure 1C). There was good recovery of the response when a 10 sec inter-stimulation interval was used. The time constant for recovery from desensitization of the airflow-response was 2.6 sec (stimulating flow rate: 2.4 l/min) and 1.6 sec (flow rate: 0.35 l/min), respectively (Figure 1D). The airflow-sensitive response in different areas of the MOE varied from 5.8 to 13.6 mV with no statistically significant differences (Figure 1E).
Figure 1.
Mouse EOG responses to airflow. A, main olfactory epithelia (MOE, n = 13, middle of turbinate I), but not respiratory epithelia (RE, n = 8) in nasal cavity, respond to airflow stimulation. Left, representative traces of airflow-evoked responses (flow rate: 1 l/min). Right, statistical data of field potential. ** p<0.01, t-test. B, Representative traces of airflow-sensitive EOG responses in the middle of turbinate II evoked by air-puffs (2.4 l/min) of varying duration. Left, four representative EOG responses to air-puffs varying in duration from 0.2 to 2 s. The desensitization and deactivation phases of the EOG responses were fitted with mono-exponential functions. Fitting curves were aligned with the original traces: dash curve was for deactivation and black curve was for desensitization. A rebound field potential (arrow) was observed in the 2-second air puff stimulation. Right, bar graphs for desensitization and deactivation time constants. C, Effects of repetitive air-puffs on the airflow-sensitive EOG response. Left, representative traces of airflow-stimulated response at inter-stimulation intervals of 10 s (n = 7) and 2 s (n = 6). Right, plot of data. EOG voltage amplitude was normalized to the amplitude of the first puff stimulation. The airflow-sensitive responses had fast adaptation with 2 s and slow with 10 s stimulation intervals. ** p<0.01, one-way ANOVA test. Adaptation is one way to distinguish airflow-sensitive response from artifacts which do not show adaptation. D, Recovery kinetics of the airflow-sensitive EOG response. Airflow-sensitive response was evoked twice by air puff with various inter-stimulation intervals. Left, superimposed representative traces of EOG recording (top, 0.35 l/min; bottom, 2.4 l/min). Right, amplitude of airflow-sensitive signal of the second test was normalized to that of the first. Recovery percentage was plotted against stimulation interval and fitted with a mono-exponential function, yielding a recovery time constant of 1.6 sec (0.35 l/min, n = 6) and 2.6 sec (2.4 l/min flow rate, n = 9). With 2.4 l/min flow rate, maximal recovery (plateau) was 78%. E, Field potential amplitude of airflow-sensitive response (2.4 l/min) at turbinates I, II, III and IV in the MOE. D, dorsal; M, middle; V, ventral.
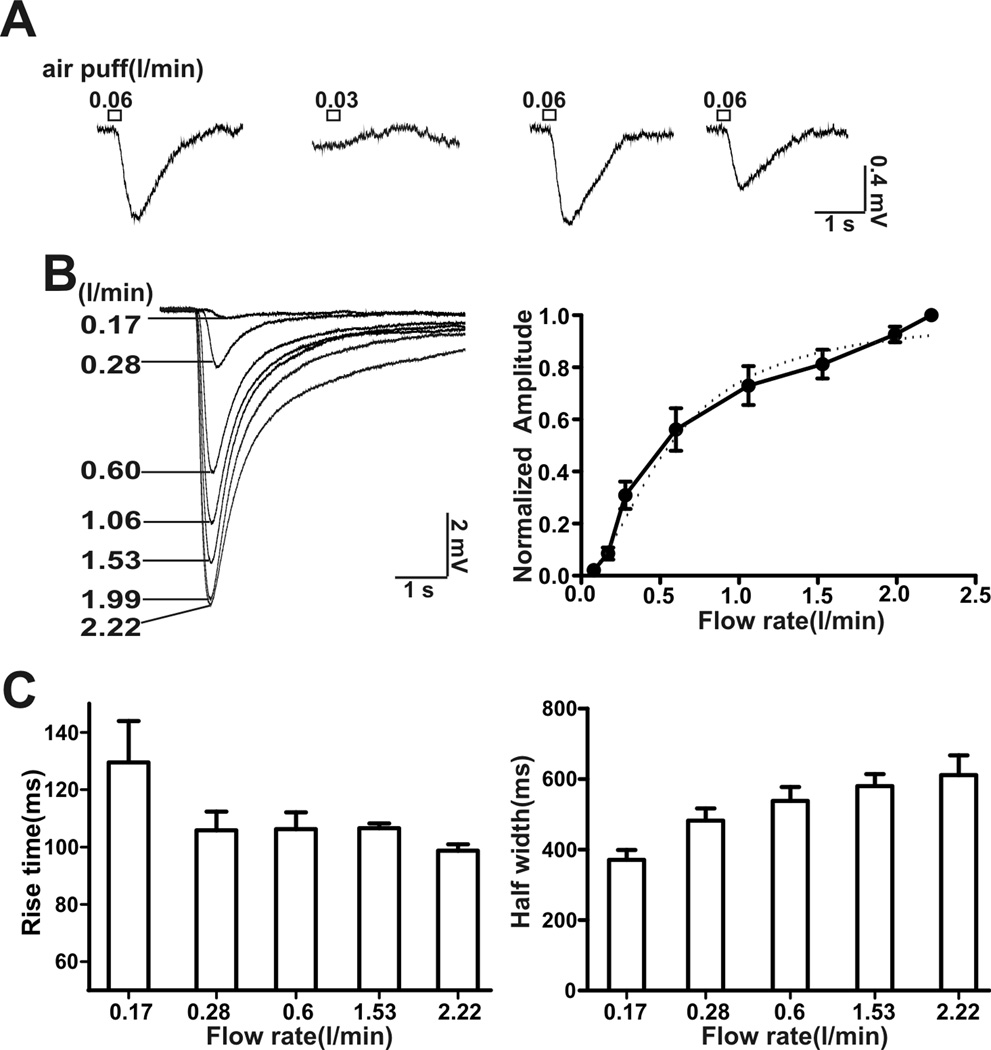
An examination of the threshold for airflow activation revealed that an air puff with a flow rate of 0.06 l/min elicited an overt airflow-sensitive response but not with a flow rate of 0.03 l/min (Figure 2A). This indicates that the threshold for airflow response was between 0.03–0.06 l/min. Since the application tip for the air puff was 1.5–2.0 cm away from the MOE, the flow rate at the surface of the MOE was actually lower. The steepest part of the airflow-dose-response curve was between 0.15–0.6 l/min (Figure 2B). The half-maximal activation of the airflow-sensitive response was 0.62 l/min with a hill coefficient of 2.2. The 20–80% rise time of activation varied from 99 ± 2 ms (flow rate: 2.4 l/min) to 129 ± 16 ms (flow rate: 0.17 l/min) and decreased with the strength of stimulation (Figure 2C). Moreover, the half-width of the airflow-sensitive response varied from 317 ± 26 ms (flow rate: 0.17 l/min) to 612 ± 56 ms (flow rate: 2.4 l/min) and increased with flow rate (Figure 2C).
Figure 2.
Threshold for activation and EC50 for the EOG airflow-sensitive response. A, Determination of the threshold for airflow activation. Representative EOG traces from one recording site. A flow rate of 0.06 l/min, but not of 0.03 l/min, stimulated an airflow-sensitive response, puff duration: 200 ms, n = 6.B, EOG traces at different airflow rates up to 2.22 l/min are shown. Right, plot of airflow-sensitive responses (amplitude normalized to the maximum) versus flow rate. Dose-response data was fitted with the Hill function (dash line). The EC50 was 0.62 ± 0.08 l/min (n = 8) with a Hill coefficient of 2.2 ± 0.3 (n = 8). C, the rise time for activation (20–80%) (left) and half-width of the airflow-sensitive response (right) at various flow rates.
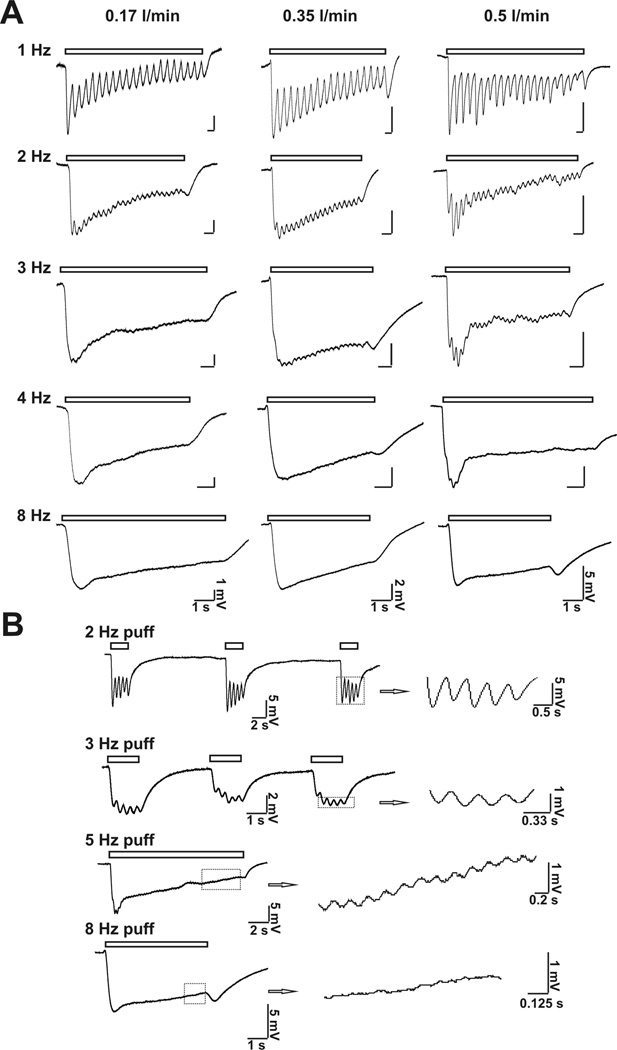
At rest, mice breathe 106–230/ minute, corresponding to 1.8–3.8 Hz breath frequency (Fox et al, 2007). To examine if the airflow-sensitive response in the MOE is associated with respiration or sniff, we tested the frequency-dependant airflow-responses in the MOE. Figure 3A reports frequency-dependant airflow responses at various flow rates. At all frequencies, air puff (with flow rates of 0.17, 0.35 or 0.5 l/min, respectively) induced airflow-sensitive EOG responses, which recovered after termination of the air puff. In addition, airflow-sensitive EOG responses oscillated in phase with air puff stimulating frequency. Figure 3B demonstrates that the higher the stimulating frequency, the lower the relative oscillating amplitude. Even with a 5 Hz stimulating air puff, an oscillation of field potential was observed. However, at 8 Hz, the rhythmic fluctuation was barely observable. These data suggest that airflow may elicit oscillations in the membrane potential in OSN.
Figure 3.
Puff frequency-dependent airflow-sensitive EOG responses. A, Varying flow rate (0.17; 0.35; and 0.5 l/min respectively) and several frequency (1; 2; 3; 4 and 8 Hz respectively) of air puff were used to stimulate MOE. Representative traces are shown. Puff duration: 50 ms; n = 5 – 9. B, High frequency air puff stimulation induced both EOG response and oscillation of the response. Shown are representative EOG traces stimulated with 2 Hz, 3 Hz, 5 Hz and 8 Hz air puff. Flow rate: 0.5 l/min; puff duration: 50 ms; n = 4 – 7. Oscillations of airflow-sensitive EOG responses in phase with stimulating air puff are enlarged on the right.
The EOG airflow-sensitive response is inhibited by SCH202676, a general inhibitor of G protein-coupled receptors
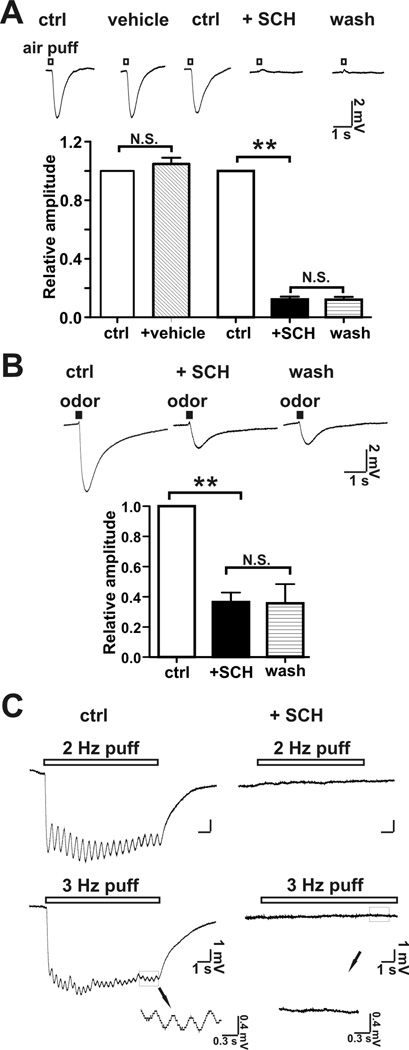
The role of receptors in the airflow response was evaluated using SCH-202676 (N-(2,3-diphenyl-1,2, 4-thiadiazol-5-(2H)-ylidene) methanamine), an inhibitor of G protein-coupled receptors (Lewandowicz et al., 2006). Treatment of MOE preparations with SCH202676 irreversibly inhibited airflow-sensitive (Figure 4A) as well as odorant-stimulated EOG responses (Figure 4B). In addition, not only the overt EOG potential, but also the frequency-dependant oscillation of airflow-sensitive response was abolished by SCH202676 (Figure 4C). This suggests that the airflow-sensitive and odorant-stimulated EOG responses may share a common mechanism. Although these data seemingly implicate olfactory receptors as the pressure sensitive element, SCH 202676 has broad specificity for G-protein coupled receptors (Lewandowicz et al., 2006) and the MOE contains other G-protein coupled receptors (Kawai et al., 1999).
Figure 4.
SCH202676, an inhibitor of G-protein coupled receptors inhibited airflow-sensitive and odor-stimulated responses. A, SCH202676 at 100 µM completely inhibited the airflow-sensitive response generated by an airflow of 2.4 l/min. Top, representative EOG traces of the airflow-sensitive response; Bottom, bar graph of data; n = 13, **, p < 0.01; N.S., not significant. B, SCH202676 at 100 µM partially inhibited the EOG odor-response. The EOG odor response was evoked by an air-puff (2.4 l/min; puff duration, 200 ms) containing an odorant mix. Top, representative EOG traces of odor-response. Bottom, bar graph of data; n = 7; **, p < 0.01; N.S., not significant. Neither inhibition (airflow-response or odor-response) by SCH202676 was reversible. C. SCH202676 abolished the oscillation of the EOG response at 2 Hz and 3 Hz air puff (pure N2) induced EOG field potentials. Left: control; right: addition of SCH202676 (100 µM). Bottom Inset, enlarged traces showing that oscillations of EOG response was abolished in the presence of SCH202676. Flow rate: 0.5 l/mi; air puff duration: 200 ms; n = 7.
Airflow-sensitive EOG response in the MOE is inhibited by activation of olfactory receptors by odorants
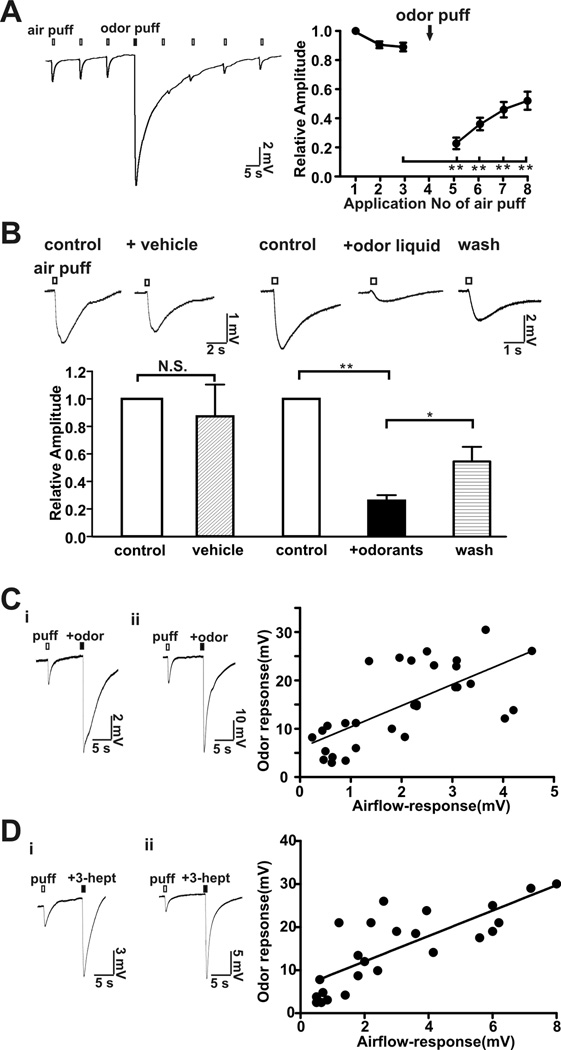
To determine if the airflow-sensitive response shares a common signaling pathway with odor responses, we tested if odorant desensitization of the MOE cross-desensitizes the airflow-sensitive response. An odorant mix was applied by air-puff and the sensitivity to air flow was monitored. The air puff-sensitive response was significantly attenuated by pre-application of an odorant puff (Figure 5A). An odorant solution was also directly applied to the MOE and the EOG airflow response was measured. As seen for odorant air puffs, application of an odorant solution also strongly inhibited the airflow-sensitive response whereas the vehicle for the odorants did not (Figure 5B). The airflow sensitivity of the MOE recovered after wash-out of the odorant mixture. These data indicated that the airflow-sensitive response was inhibited by desensitization of the olfactory signal pathway. Moreover, the amplitude of the airflow-sensitive response from different mice showed a positive correlation with the odorant responses (Figure 5C: odor mix; 5D: 3-heptanone) measured from the same turbinates. Collectively these data support the idea that airflow and odorant sensitivity of the MOE may share a common mechanism.
Figure 5.
Odorants reversibly desensitized the MOE to airflow. A, Application of an odorant mix applied via air puff (2.4 l/min, 200 ms) reversibly desensitized the airflow-sensitive response. Left, representative trace of EOG responses. Right, plot of normalized airflow-sensitive response versus application of the air puff. n = 12, **, p < 0.01 (before odor stimulation vs. after odor stimulation). B, A liquid odorant mix directly applied to the MOE reversibly inhibited the airflow-sensitive EOG response (2.4 l/min for 200 ms). The vehicle for the odorant mix didn’t change the airflow response. N.S., not significant. Washes with Ringer’s solution partially reversed the inhibitory effect of the odorant solution. Top, representative traces; Bottom, bar-graph of data. n = 8, ** p < 0.01; * p < 005, paired student t-test. C and D, Correlation between airflow-sensitive and odorant responses. The airflow-sensitive EOG response was first examined using an air-puff (2.4 l/min, 200 ms) and then the odorant mixture was applied by air-puff (2.4 l/min, 200 ms) using a mixture of odorants (see Methods, 50 µM each; C) or using a single odorant, 3-heptanone (500 µM; D) applied to the same location. Left, two representative EOG traces recording in the MOE showing both airflow- and odor-responses. Note the y-axis scale-bar distinctions. Right, scatter plot of odor-response versus airflow-sensitive response obtained from 27 different mice(C) or from 16 different mice (D). The linear equations obtained by linear regression were Y = 4.4 * X + 6.6 (C) and Y = 2.9 * X + 6.1(D); Pearson test of correlation analysis: p < 0.001(two-tailed), both C and D; r = 0.7(C) and r = 0.86 (D).
Activation of adenylyl cyclase abolishes the airflow-sensitive response in the MOE
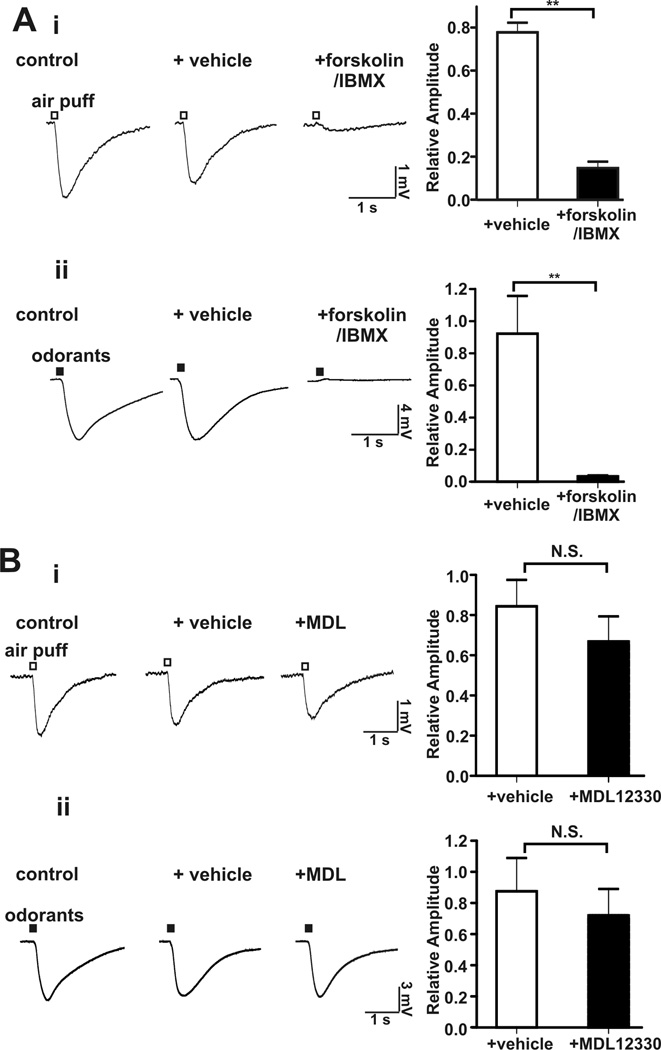
If the desensitization of the airflow-sensitivity of the MOE caused by pretreatment with odorants is attributable to cAMP increases, then activation of adenylyl cyclase by forskolin (Seamon and Daly, 1981) and inhibition of phosphodiesterases by IBMX (Kramer et al., 1977) should also impair sensitivity to airflow. Co-application of forskolin and IBMX strongly attenuated both the airflow- and odorant-stimulated EOG responses (Figure 6A). MDL 12330A, a nonspecific adenosine receptor inhibitor, failed to inhibit the airflow-sensitive response or odorant-induced EOG changes (Figure 6B). Since odorant-stimulated EOG responses depend on AC3, this indicates that MDL 12330A does not inhibit AC3 under our experimental conditions. The lack of effect of MDL 12303A on airflow-stimulated EOG responses contrasts with data published by others using voltage-clamp recording on single OSN (Grosmaitre et al., 2007). They took this as evidence that that the airflow sensitivity of the MOE depends on cAMP signaling. However, MDL 12330A inhibits adenosine receptors and would not be expected to inhibit all adenylyl cyclases. Furthermore, the drug affects the activity of several other proteins including a Gly-transporter (Gadea et al., 1999) as well as Ca2+ channels (Rampe et al., 1987) and is not a specific inhibitor of adenylyl cyclase activity.
Figure 6.
Activation of adenylyl cyclase by forskolin inhibited the airflow-sensitive EOG response in the MOE. A, The airflow- and odorant-sensitive EOG responses were abolished by addition of forskolin (50 µM) with IBMX (60 µM) to the MOE. Left, representative EOG traces of airflow-sensitive (i, n = 11) and odor (ii, n = 6) response; Right, bar graph of data; **, p < 0.01. B, The airflow- and odorant-sensitive EOG responses were unaffected by MDL12330A, an inhibitor of adenosine receptors. Left, representative EOG traces of airflow-sensitive (i, n = 8) and odor-response (ii, n = 7); Right, bar graph of data. N.S. not significant.
The MOE of AC3 −/− mice are insensitive to airflow stimulation
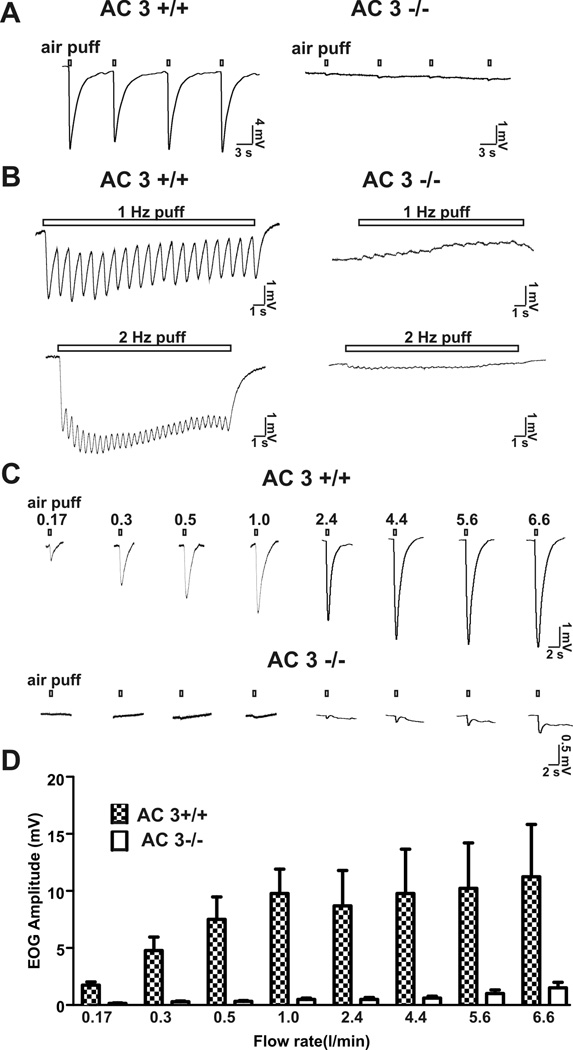
AC3 is the predominant adenylyl cyclase in the cilia of OSN and is essential for transduction of olfactory signals in OSN. Indeed AC3−/− mice are anosmic (Wong et al., 2000). To directly implicate cAMP signaling in the air puff-sensitive EOG response, the effect of airflow on EOG traces was examined using the MOE from AC3−/− mice. Air puffs delivered at a rate of 2.4 l/min to the MOE generated strong EOG responses in the MOE of AC3+/+ but not AC3−/− mice (Figure 7A). In addition, the oscillation of EOG response stimulated with 1 or 2 Hz air puff was dramatically reduced in AC3−/− mice (Figure 7B). Even higher flow rates up to 6.6 l/min failed to produce the typical EOG response when applied to AC3−/− MOE preparations (Figure 7 C & D). These data indicate that AC3 is obligatory for the airflow sensitivity of the mouse MOE.
Figure 7.
Air-puffs failed to stimulate an airflow-sensitive EOG response in AC3−/− mice. A, Representative EOG traces stimulated by single air-puffs (2.4l/min for 200 ms) to the MOE of AC3 +/+ (n = 12) and from AC3−/− mice (n = 8). B, AC3−/− mice also failed to display oscillation as well as downward EOG response upon 1 Hz and 2 Hz air-puff stimulations. Flow rate: 0.5 l/min; puff duration: 200 ms. C, EOG responses of AC3+/+ and AC3−/− MOE (exemplar traces are from two WT and two KO mice) to air-puffs of varying flow rates. D, Bar graph for flow rate-dependent airflow-sensitive responses for AC3+/+ (n = 9) and AC3−/− mice (n = 9).
Discussion
The objective of this study was to determine if mechanical force generated by airflow can stimulate the MOE using EOG recordings and to directly assess the role of cAMP signaling using AC3−/− mice. Since the CNG responds to both cAMP and cGMP, the fact that CNG−/− mice lack fluid-generated airflow responses cannot be taken as direct evidence for a role of cAMP signaling. The drug MDL 12330A cannot be used to implicate adenylyl cyclase activity in the airflow response because it is not specific to adenylyl cyclases (Rampe et al., 1987; Gadea et al., 1999) and it did not inhibit EOG responses caused by airflow or odorants in our study.
We discovered that airflow stimulates the MOE with progressively higher EOG responses as airflow increased. This sensitivity to airflow was desensitized by prior increases in cAMP caused by odorants or by a combination of forskolin and IBMX suggesting that odorant and airflow sensitivity may both depend on cAMP signaling. Indeed, the MOE from AC3−/− mice does not respond to airflow, thereby directly implicating cAMP signaling in airflow sensitivity.
One might argue that the EOG response to airflow is due to evaporation, cooling of the preparation, and activation of cold responsive sensory neurons. We think that this is unlikely since the nitrogen used in these experiments was humidified and pre-warmed to the same temperature as the MOE (22 °C). Furthermore, it has been established that cold-sensing neurons signal through TrpM8 channel (Latorre et al., 2011) and do not depend on AC3 for EOG responses. Moreover, the EOG response to airflow of the MOE was not inhibited by the TrpM8 antagonist, SKF96365 (data not shown).
Since AC3 is expressed only in the olfactory cilia of OSN (Bakalyar and Reed, 1990), we conclude that the cilia are most likely the primary organelle for airflow sensitivity. Sensing of mechanical force by cilia is not unique to olfactory cilia. For example, primary cilia in the apical surface of epithelia layer of the nephron can sense mechanical stress caused by fluid flow (Nauli et al., 2003). Interestingly, these primary cilia also express AC3 (Pluznick et al., 2009). Cilia in some sensory neurons of C. elegans also possess mechanosensitivity (Inglis et al., 2007). Cilia on OSNs seem to have dual functions: the detection of odorants and airflow.
Although this study indicates that cAMP signaling is required for the airflow sensitivity of the MOE, the molecular sensor in the cilia is not known. Most likely membrane stretch generated by airflow is detected by a transmembrane protein. In principle, an odorant receptor, AC3, or a combination of these molecules could be the airflow-sensitive element. AC3 is a likely candidate because it is a transmembrane protein with two 6 transmembrane domains reminiscent of ion channels (Krupinski et al., 1989). Moreover, adenylyl cyclase activity in vascular smooth muscle cells is sensitive to mechanical stretch (Mills et al., 1990) and vascular smooth muscle also expresses AC3 (Wong et al., 2001). Nevertheless, our data does not rule out a role of receptors in airflow sensitivity.
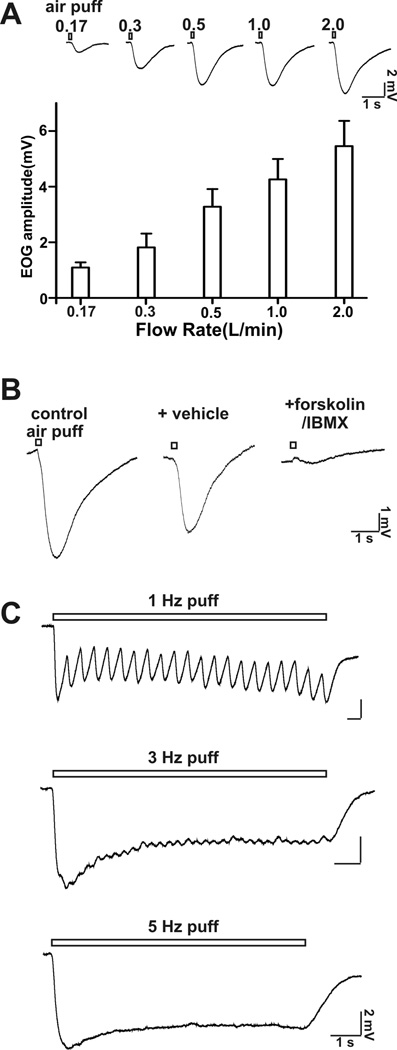
The threshold for airflow EOG responses in the mouse MOE preparation used in this study was between 0.03 to 0.06 l/min. The tidal volume of mice has been reported as 0.15–0.4 ml/breath (Fox et al 2007). Mice usually breathe at 106–230 times per minute (Fox et al 2007). From this one can estimate that the respiratory flow rate of mice would range from 0.03 l/min at the low end up to 0.18 l/min. We report measurable EOG changes at: 0.06 l/min; 0.17 l/mi; 0.35 l/min, 0.5 l/min or higher. Thus, the threshold flow rate for EOG responses that we obsevered is within the physiological sniffing range of mice. In addition, the maximal flow rate for sniffing with rats is reported as high as 0.5 l/min (Zhao et al., 2006). Therefore, we also examined the rat MOE for EOG responses to airflow (Figure 8) and discovered that flow rates of 0.2 to 0.5 l/min generate a measurable EOG response (Figure 8). Therefore, the threshold flow rate for EOG responses that we obsevered is within the physiological sniffing range of rats. Nevertheless, in our experiments the airflow was directed over an isolated section of the MOE and the cannula was 1 to 2 cm above the sample leading to uncertainties concerning the actual airflow at the surface of the sample. Also the velocity at the boundary layer of the intact MOE of the intact nose will be lower. Consequently, we cannot say unequivocally that the EOG responses to flow rates as low as 0.06 l/min in the isolated mouse MOE are physiologically relevant. However the observation that the EOG sensitivity to airflow was lost in AC3−/− mice is important particularly since this enzyme activity is also required for odorant detection. The data showing that treatment of MOE preparations with odorants or agents which increase cAMP decreased EOG responses to airflow also supports the general hypothesis that the responses to airflow may be physiologically relevant.
Figure 8.
Rat MOE is sensitive to airflow stimulation. A, top, EOG traces at different airflow rates up to 2 l/min are shown; bottom, bar graph (EOG amplitude) of airflow-sensitive responses at various flow rate. Recording site: middle of turbinate II; puff duration: 200 ms; n = 6 – 9. B, The airflow-sensitive response was abolished by application of forskolin (50 µM) and IMBX (60 µM). Flow rate: 0.5 l/min; puff duration: 200 ms; n = 6. C, High frequency air puff stimulation induced oscillation of the airflow-sensitive response. Shown are representative EOG traces stimulated with 1 Hz, 3 Hz, and 5 Hz air puff. Flow rate: 0.5 l/min; puff duration: 100 ms; n =
Although the absolute value of the airflow-sensitive response is not very high, it may still affect the membrane potential and may facilitate depolarization of OSN, thereby promoting initiation of an action potential. On the other hand, OSN should not be too sensitive to airflow because it could increase noise during olfactory perception and interfere with the coding of odor information. Our data is consistent with the idea that airflow from respiration or sniff may cause a rhythmic oscillation in OSN. This would induce an up-phase and down-phase of membrane potential of OSN, which subsequently regulate coding of odor information, or provide an oscillatory drive to the olfactory bulb or olfactory cortex (Wachowiak, 2011 Neuron). This idea is in line with a number of observations suggesting that oscillations in the MOB and olfactory cortex are coupled with respiration (Grosmaitre et al., 2007; Fontanini et al 2003; Schaefer et al., 2006; Carey and Wachowiak, 2011).
In conclusion, the mechanical force exerted by respiration or sniffing may function synergistically or additively with odorants to promote the depolarization of OSN, an idea supported by other published studies (Scott, 2006; Verhagen et al., 2007; Oka et al., 2009). Furthermore, airflow sensitivity of the MOE is detectable by EOG recordings and depends on cAMP signals generated by AC3.
Acknowledgements
This research was supported by NIH grant DC0415. We thank members of the Storm research lab for discussion and critical reading of the manuscript.
References
- Bakalyar HA, Reed RR. Identification of a specialized adenylyl cyclase that may mediate odorant detection. Science. 1990;250:1403–1406. doi: 10.1126/science.2255909. [DOI] [PubMed] [Google Scholar]
- Boekhoff I, Inglese J, Schleicher S, Koch WJ, Lefkowitz RJ, Breer H. Olfactory desensitization requires membrane targeting of receptor kinase mediated by beta gamma-subunits of heterotrimeric G proteins. Journal Of Biological Chemistry. 1994;269:37–40. [PubMed] [Google Scholar]
- Borisy FF, Ronnett GV, Cunningham AM, Juilfs D, Beavo J, Snyder SH. Calcium/calmodulin-activated phosphodiesterase expressed in olfactory receptor neurons. J Neurosci. 1992;12:915–923. doi: 10.1523/JNEUROSCI.12-03-00915.1992. [DOI] [PMC free article] [PubMed] [Google Scholar]
- Buonviso N, Amat C, Litaudon P. Respiratory modulation of olfactory neurons in the rodent brain. Chem Senses. 2006;31:145–154. doi: 10.1093/chemse/bjj010. [DOI] [PubMed] [Google Scholar]
- Carey RM, Wachowiak M. Effect of sniffing on the temporal structure of mitral/tufted cell output from the olfactory bulb. J Neurosci. 2011;31:10615–10626. doi: 10.1523/JNEUROSCI.1805-11.2011. [DOI] [PMC free article] [PubMed] [Google Scholar]
- Fox JG, Barthold SW, Davisson M, Newcomer CE, Quimby FW, Smith A, editors. The Mouse in Biomedical Research, Diseases. 2nd Edition. Vol 3. Elsevier; 2007. p. 55. [Google Scholar]
- Fontanini A, Spano P, Bower JM. Ketamine-xylazine-induced slow (< 1.5 Hz) oscillations in the rat piriform (olfactory) cortex are functionally correlated with respiration. J Neurosci. 2003;23:7993–8001. doi: 10.1523/JNEUROSCI.23-22-07993.2003. [DOI] [PMC free article] [PubMed] [Google Scholar]
- Gadea A, Lopez E, Lopez-Colome AM. The adenylate cyclase inhibitor MDL-12330A has a non-specific effect on glycine transport in Muller cells from the retina. Brain Res. 1999;838:200–204. doi: 10.1016/s0006-8993(99)01683-2. [DOI] [PubMed] [Google Scholar]
- Grosmaitre X, Santarelli LC, Tan J, Luo M, Ma M. Dual functions of mammalian olfactory sensory neurons as odor detectors and mechanical sensors. Nat Neurosci. 2007;10:348–354. doi: 10.1038/nn1856. [DOI] [PMC free article] [PubMed] [Google Scholar]
- Inglis PN, Ou G, Leroux MR, Scholey JM. The sensory cilia of Caenorhabditis elegans. WormBook. 2007:1–22. doi: 10.1895/wormbook.1.126.2. [DOI] [PMC free article] [PubMed] [Google Scholar]
- Jones DT, Reed RR. Golf: an olfactory neuron specific-G protein involved in odorant signal transduction. Science. 1989;244:790–795. doi: 10.1126/science.2499043. [DOI] [PubMed] [Google Scholar]
- Kawai F, Kurahashi T, Kaneko A. Adrenaline enhances odorant contrast by modulating signal encoding in olfactory receptor cells. Nat Neurosci. 1999;2:133–138. doi: 10.1038/5686. [DOI] [PubMed] [Google Scholar]
- Kepecs A, Uchida N, Mainen ZF. The sniff as a unit of olfactory processing. Chem Senses. 2006;31:167–179. doi: 10.1093/chemse/bjj016. [DOI] [PubMed] [Google Scholar]
- Kramer GL, Garst JE, Mitchel SS, Wells JN. Selective inhibition of cyclic nucleotide phosphodiesterases by analogues of 1-methyl-3-isobutylxanthine. Biochemistry. 1977;16:3316–3321. doi: 10.1021/bi00634a006. [DOI] [PubMed] [Google Scholar]
- Krupinski J, Coussen F, Bakalyar HA, Tang WJ, Feinstein PG, Orth K, Slaughter C, Reed RR, Gilman AG. Adenylyl cyclase amino acid sequence: possible channel- or transporter-like structure. Science. 1989;244:1558–1564. doi: 10.1126/science.2472670. [DOI] [PubMed] [Google Scholar]
- Latorre R, Brauchi S, Madrid R, Orio P. A cool channel in cold transduction. Physiology. 2011;26:273–285. doi: 10.1152/physiol.00004.2011. [DOI] [PubMed] [Google Scholar]
- Lewandowicz AM, Vepsalainen J, Laitinen JT. The 'allosteric modulator' SCH-202676 disrupts G protein-coupled receptor function via sulphydryl-sensitive mechanisms. Br J Pharmacol. 2006;147:422–429. doi: 10.1038/sj.bjp.0706624. [DOI] [PMC free article] [PubMed] [Google Scholar]
- Macrides F, Chorover SL. Olfactory bulb units: activity correlated with inhalation cycles and odor quality. Science. 1972;175:84–87. doi: 10.1126/science.175.4017.84. [DOI] [PubMed] [Google Scholar]
- Mills I, Letsou G, Rabban J, Sumpio B, Gewirtz H. Mechanosensitive adenylate cyclase activity in coronary vascular smooth muscle cells. Biochem Biophys Res Commun. 1990;171:143–147. doi: 10.1016/0006-291x(90)91368-3. [DOI] [PubMed] [Google Scholar]
- Munger SD, Lane AP, Zhong H, Leinders-Zufall T, Yau KW, Zufall F, Reed RR. Central role of the CNGA4 channel subunit in Ca2+-calmodulin-dependent odor adaptation. Science. 2001;294:2172–2175. doi: 10.1126/science.1063224. [DOI] [PMC free article] [PubMed] [Google Scholar]
- Nakamura T, Gold GH. A cyclic nucleotide-gated conductance in olfactory receptor cilia. Nature. 1987;325:442–444. doi: 10.1038/325442a0. [DOI] [PubMed] [Google Scholar]
- Nauli SM, Alenghat FJ, Luo Y, Williams E, Vassilev P, Li X, Elia AE, Lu W, Brown EM, Quinn SJ, Ingber DE, Zhou J. Polycystins 1 and 2 mediate mechanosensation in the primary cilium of kidney cells. Nat Genetics. 2003;33:129–137. doi: 10.1038/ng1076. [DOI] [PubMed] [Google Scholar]
- Oka Y, Takai Y, Touhara K. Nasal airflow rate affects the sensitivity and pattern of glomerular odorant responses in the mouse olfactory bulb. J Neurosci. 2009;29:12070–12078. doi: 10.1523/JNEUROSCI.1415-09.2009. [DOI] [PMC free article] [PubMed] [Google Scholar]
- Pluznick JL, Zou DJ, Zhang X, Yan Q, Rodriguez-Gil DJ, Eisner C, Wells E, Greer CA, Wang T, Firestein S, Schnermann J, Caplan MJ. Functional expression of the olfactory signaling system in the kidney. Proc Natl Acad Sci U S A. 2009;106:2059–2064. doi: 10.1073/pnas.0812859106. [DOI] [PMC free article] [PubMed] [Google Scholar]
- Rampe D, Triggle DJ, Brown AM. Electrophysiologic and biochemical studies on the putative Ca++ channel blocker MDL 12,330A in an endocrine cell. J Pharmacol Exp Ther. 1987;243:402–407. [PubMed] [Google Scholar]
- Schaefer AT, Angelo K, Spors H, Margrie TW. Neuronal oscillations enhance stimulus discrimination by ensuring action potential precision. PLoS Biol. 2006;4:e163. doi: 10.1371/journal.pbio.0040163. [DOI] [PMC free article] [PubMed] [Google Scholar]
- Scott JW. Sniffing and spatiotemporal coding in olfaction. Chem Senses. 2006;31:119–130. doi: 10.1093/chemse/bjj013. [DOI] [PMC free article] [PubMed] [Google Scholar]
- Seamon K, Daly JW. Activation of adenylate cyclase by the diterpene forskolin does not require the guanine nucleotide regulatory protein. J Biol Chem. 1981;256:9799–9801. [PubMed] [Google Scholar]
- Sobel N, Khan RM, Hartley CA, Sullivan EV, Gabrieli JD. Sniffing longer rather than stronger to maintain olfactory detection threshold. Chem Senses. 2000;25:1–8. doi: 10.1093/chemse/25.1.1. [DOI] [PubMed] [Google Scholar]
- Sobel N, Prabhakaran V, Desmond JE, Glover GH, Goode RL, Sullivan EV, Gabrieli JDE. Sniffing and smelling: separate subsystems in the human olfactory cortex. Nature. 1998a;392:282–286. doi: 10.1038/32654. [DOI] [PubMed] [Google Scholar]
- Sobel N, Prabhakaran V, Hartley CA, Desmond JE, Zhao Z, Glover GH, Gabrieli JD, Sullivan EV. Odorant-induced and sniff-induced activation in the cerebellum of the human. J Neurosci. 1998b;18:8990–9001. doi: 10.1523/JNEUROSCI.18-21-08990.1998. [DOI] [PMC free article] [PubMed] [Google Scholar]
- Song Y, Cygnar KD, Sagdullaev B, Valley M, Hirsh S, Stephan A, Reisert J, Zhao H. Olfactory CNG channel desensitization by Ca2+/CaM via the B1b subunit affects response termination but not sensitivity to recurring stimulation. Neuron. 2008;58:374–386. doi: 10.1016/j.neuron.2008.02.029. [DOI] [PMC free article] [PubMed] [Google Scholar]
- Touhara K, Vosshall LB. Sensing odorants and pheromones with chemosensory receptors. Annu Rev Physiol. 2009;71:307–332. doi: 10.1146/annurev.physiol.010908.163209. [DOI] [PubMed] [Google Scholar]
- Trinh K, Storm DR. Vomeronasal organ detects odorants in absence of signaling through main olfactory epithelium. Nat Neurosci. 2003;6:519–525. doi: 10.1038/nn1039. [DOI] [PubMed] [Google Scholar]
- Ueki S, Domino EF. Some evidence for a mechanical receptor in olfactory function. J Neurophysiol. 1961;24:12–25. doi: 10.1152/jn.1961.24.1.12. [DOI] [PubMed] [Google Scholar]
- Verhagen JV, Wesson DW, Netoff TI, White JA, Wachowiak M. Sniffing controls an adaptive filter of sensory input to the olfactory bulb. Nat Neurosci. 2007;10:631–639. doi: 10.1038/nn1892. [DOI] [PubMed] [Google Scholar]
- Wachowiak M. All in a sniff: olfaction as a model for active sensing. Neuron. 2011;71:962–973. doi: 10.1016/j.neuron.2011.08.030. [DOI] [PMC free article] [PubMed] [Google Scholar]
- Wang Z, Balet Sindreu C, Li V, Nudelman A, Chan GC, Storm DR. Pheromone detection in male mice depends on signaling through the type 3 adenylyl cyclase in the main olfactory epithelium. J Neurosci. 2006;26:7375–7379. doi: 10.1523/JNEUROSCI.1967-06.2006. [DOI] [PMC free article] [PubMed] [Google Scholar]
- Wayman GA, Impey S, Storm DR. Ca2+ inhibition of type III adenylyl cyclase in vivo. J Biol Chem. 1995;270:21480–21486. doi: 10.1074/jbc.270.37.21480. [DOI] [PubMed] [Google Scholar]
- Wei J, Wayman G, Storm DR. Phosphorylation and inhibition of type III adenylyl cyclase by calmodulin-dependent protein kinase II in vivo. J Biol Chem. 1996;271:24231–24235. doi: 10.1074/jbc.271.39.24231. [DOI] [PubMed] [Google Scholar]
- Wei J, Zhao AZ, Chan GCK, Baker LP, Impey S, Beavo JA, Storm DR. Phosphorylation and inhibition of olfactory adenylyl cyclase by CaM kinase II in neurons: a mechanism for attenuation of olfactory signals. Neuron. 1998;21:495–504. doi: 10.1016/s0896-6273(00)80561-9. [DOI] [PubMed] [Google Scholar]
- Wesson DW, Verhagen JV, Wachowiak M. Why sniff fast? The relationship between sniff frequency, odor discrimination, and receptor neuron activation in the rat. J Neurophysiol. 2009;101:1089–1102. doi: 10.1152/jn.90981.2008. [DOI] [PMC free article] [PubMed] [Google Scholar]
- Wong ST, Baker LP, Trinh K, Hetman M, Suzuki LA, Storm DR, Bornfeldt KE. Adenylyl cyclase 3 mediates prostaglandin E(2)-induced growth inhibition in arterial smooth muscle cells. J Biol Chem. 2001;276:34206–34212. doi: 10.1074/jbc.M103923200. [DOI] [PubMed] [Google Scholar]
- Wong ST, Trinh K, Hacker B, Chan GC, Lowe G, Gaggar A, Xia Z, Gold GH, Storm DR. Disruption of the type III adenylyl cyclase gene leads to peripheral and behavioral anosmia in transgenic mice. Neuron. 2000;27:487–497. doi: 10.1016/s0896-6273(00)00060-x. [DOI] [PubMed] [Google Scholar]
- Yan C, Zhao AZ, Bentley JK, Loughney K, Ferguson K, Beavo JA. Molecular cloning and characterization of a calmodulin-dependent phosphodiesterase enriched in olfactory sensory neurons. Proc Natl Acad Sci U S A. 1995;92:9677–9681. doi: 10.1073/pnas.92.21.9677. [DOI] [PMC free article] [PubMed] [Google Scholar]
- Zhao K, Dalton P, Yang GC, Scherer PW. Numerical modeling of turbulent and laminar airflow and odorant transport during sniffing in the human and rat nose. Chem Senses. 2006;31:107–118. doi: 10.1093/chemse/bjj008. [DOI] [PubMed] [Google Scholar]


