

Abstract
It has been suggested that one way we may create a stable percept of the visual world across multiple eye movements is to pass information from one set of neurons to another around the time of each eye movement. Previous studies have shown that some neurons in the lateral intraparietal area (LIP) exhibit anticipatory remapping: these neurons produce a visual response to a stimulus that will enter their receptive field after a saccade, but before it actually does so. LIP responses during fixation are thought to represent attentional priority, behavioral relevance or value. In this study, we test whether the remapped response represents this attentional priority, by examining the activity of LIP neurons while animals perform a visual foraging task. We find that the population responds more to a target than to a distractor before the saccade even begins to bring the stimulus into the receptive field. Within 20 ms of the saccade ending, the responses in almost a third of LIP neurons closely resemble the responses that will emerge during stable fixation. Finally, we show that in these neurons and in the population as a whole, this remapping occurs for all stimuli in all locations across the visual field and for both long and short saccades. We conclude that this complete remapping of attentional priority across the visual field could underlie spatial stability across saccades.
Introduction
Each time we move our eyes, visual information about the scene shifts to a new retinal location. Early visual areas process this information in retinotopic coordinates, so from an egocentric point of view, the world moves around us with each eye movement. However our percept is that we shift our gaze within a stable environment. It has been proposed that one way we may create this stability is using a mechanism in which receptive fields shift around the time of a saccade (Wurtz, 2008; Hall and Colby, 2011). This phenomenon, termed remapping, was first identified in the lateral intraparietal area (LIP; Duhamel et al., 1992). It describes a neuronal response to a stimulus or remembered stimulus that is presented outside of its receptive field, but in a location that is about to enter the receptive field via an upcoming saccade. For stable stimuli, the remapped response occurs earlier than can be explained by the normal visual pathway from the retina (Duhamel et al., 1992; Walker et al., 1995; Umeno and Goldberg, 1997; Kusunoki and Goldberg, 2003), but it is more easily illustrated with flashed stimuli because they are never present in the neuron’s receptive field (Duhamel et al., 1992; Walker et al., 1995; Umeno and Goldberg, 1997; Nakamura and Colby, 2002; Heiser and Colby, 2006; Berman et al., 2007). Several fundamental properties about remapping in LIP have already been studied (Kusunoki and Goldberg, 2003; Heiser and Colby, 2006) and the mechanisms underlying remapping have been examined using split-brain animals (Heiser et al., 2005; Berman et al., 2007; Dunn et al., 2010), reversible inactivation (Sommer and Wurtz, 2006) and modeling (Quaia et al., 1998; Hamker et al., 2011), yet details about what the remapped responses represent are limited (Crapse and Sommer, 2012).
If remapping is involved in creating a stable percept of the visual world, then we hypothesize that a complete representation of the visual world should be shifted around the time of a saccade, which would necessitate a transfer of response levels. It has previously been suggested that stimulus salience (Joiner et al., 2011) and context (Churan et al., 2011) affect remapped responses in the frontal eye field and superior colliculus, however these studies did not test whether response levels reflect the responses seen during stable fixation. We previously noted that, in a task in which multiple stimuli remained visible across multiple saccades, remapped responses in LIP appeared to be consistent with the responses seen after fixation was stabilized (Mirpour et al., 2009). This activity, which we call priority, can be thought of as representing the behavioral relevance of the stimulus (Gottlieb et al., 1998; Roitman and Shadlen, 2002; Louie and Glimcher, 2010; Mirpour and Bisley, 2012); it is a combination of top-down and bottom-up factors as they are combined in LIP (Ipata et al., 2009). In this study, we use these data to test the hypothesis that priority is remapped across the entire visual field. If this occurs, it supports the concept that remapping is involved in maintaining spatial stability of the visual world across saccades.
Materials and Methods
Subjects
All experiments were approved by the Chancellor’s Animal Research Committee at UCLA as complying with the guidelines established in the Public Health Service Guide for the Care and Use of Laboratory Animals. Two male rhesus monkeys (8-10 kg) were implanted with head posts, scleral coils and recording cylinders during sterile surgery under general anesthesia (Bisley and Goldberg, 2006; Mirpour et al., 2009). Animals were initially anesthetized with Ketamine and Xylazine and maintained with isofluorane. The animals were trained on the standard memory guided saccade task and on the foraging task (Fig. 1). Experiments were run using the REX system (Hays et al., 1982) and visual stimuli were presented on a CRT using the associated VEX software. Eye position signals were sampled using a magnetic search coil system (DNI) at 2 kHz and recorded for analysis at 1 kHz.
Figure 1.
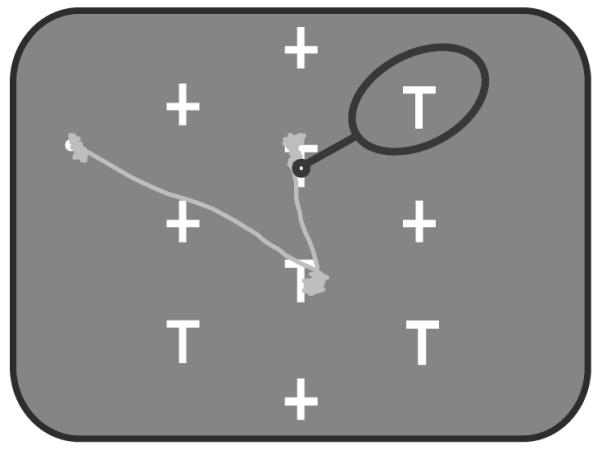
The behavioral task. In each trial, 5 distractors (+) and 5 potential targets (T) were presented. One T, the target, had a fluid reward linked to it, such that when the monkey looked at it for 500 ms within 8 s, he obtained the reward. The stimuli were arranged so that when the animal looked at one stimulus (small black circle) another stimulus was usually centered in the receptive field of the neuron (black oval). The gray trace shows an example eye movement path.
Tasks
Single unit-activity was recorded from two monkeys using tungsten microelectrodes (Alpha Omega, Israel). The location of LIP was determined using MRI images and neurons were only included if they or their immediate neighbors showed typical visual, delay and/or peri-saccadic activity in a memory guided saccade task (Barash et al., 1991) An automated memory-guided saccade task was used for calculating the size and position of the receptive fields. This has been described in detail elsewhere (Mirpour et al., 2010). Briefly, a 3 × 3 array of targets was used in a memory guided saccade task. This roughly estimated the center and size of the receptive field. Then a 5 × 5 array of targets was run to more precisely estimate the boundaries of the receptive field. We discriminated action potentials online using the MEX pattern spike sorter and sorted spikes were time stamped and stored at 1 kHz in REX.
Each trial of the foraging task (Fig. 1) started with a fixation point appearing in the left, right or the center of the monitor. The monkeys had to fixate on the fixation point for 450 to 700 ms to start the task, after which an array of 5 potential targets (T) and 5 distractors (+) appeared on the screen. One of the potential targets was loaded with reward. The monkeys had to fixate on the reward loaded target for 500 ms within 8 seconds after the start of the trial to receive the reward. This lead to a strategy in which the monkeys usually looked from target to target, waiting at each for approximately 650 ms (Mirpour et al., 2009). The stimuli were arranged in such a fashion that when the monkey looked at one stimulus, the neuron’s receptive field often encompassed another stimulus (large oval, Fig. 1). On each trial the spatial arrangement of the stimulus array was identical, but the positions of the potential targets and distractors were randomly assigned (Mirpour et al., 2009). Thus, from session to session, the locations of the objects were different and within a session there were 252 possible stimulus configurations.
Neural data analysis
The data here are a further analysis of those presented previously (Mirpour et al., 2009), and in which we noted what appeared to be a signal in the remapped response. Data were recorded from 54 LIP neurons (29 from monkey E and 25 from monkey C). In 29 of these neurons, we placed the initial fixation point in a location that enabled us to record the response to a single stimulus when the array appeared. For the search task, we analyzed neural activity during fixations in which there was a single object inside the receptive field. In two of the 54 neurons, the response field was so large that multiple stimuli were usually in the response field after the first saccade. The data from these neurons could not be used in the search task analyses, and only contributed data to the array onset analyses. For the search task analyses, data were aligned by array onset, by saccade onset or by the end of the saccade. To exclude the motor response, which could confound these analyses, we only included data from saccades that were not directed toward the receptive field of the neuron.
Spike density functions were calculated for visualization only by convolving spike trains with a Gaussian kernel with a 5 ms sigma. To calculate the time in which a neuron’s response significantly differentiated between a potential target and a distractor (vertical dashed lines, Fig. 2A-C), the responses in 25 ms sliding bins were compared using t-tests. The dashed lines represent the middle time point of the first bin in which the p-value from the t-test was less than 0.05 and in which at least 98 of the following 100 bins also had p-values less than 0.05. The same sliding window test was used to calculate the percentage of neurons that showed a significant difference between potential targets and distractors as a function of time (Fig. 3C).
Figure 2.

Mean single unit and population responses. A, B, C, Mean responses from a single neuron to a potential target (red traces) and to a distractor (blue traces) brought into the receptive field by the onset of the array (A) or by a saccade, with the data aligned by the onset of the saccade (B) or the end of the saccade (C). D, Mean normalized population responses from 29 neurons to the same two stimuli brought into the receptive field by the onset of the array. E, F, Mean normalized population responses from 52 neurons to the same two stimuli brought into the receptive field by a saccade, aligned by saccade onset (E) or by the end of the saccade (F). Vertical dashed lines show where the traces separated significantly.
Figure 3.

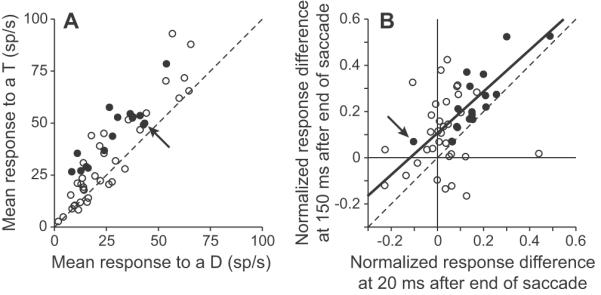
Responses to potential targets and distractors in 25 ms windows as a function of time. A, The mean response to a potential target is plotted as a function of the mean response to a distractor for all neurons in a 25 ms window centered 20 ms after the end of the last saccade. Filled points indicate which individual neurons showed a significant difference between responses (p<0.05, t-tests). B, The mean response to a potential target is plotted as a function of the mean response to a distractor for all neurons in a 25 ms window centered 20 ms after array onset. Filled points indicate which individual neurons showed a significant difference between responses (p<0.05, t-tests). C, The proportion of neurons that showed a significantly stronger response to a potential target compared to a distractor in 25 ms windows are plotted as a function of the mid-point in the analysis window. The black trace shows data aligned with array onset; the gray trace shows data aligned by the end of the saccade. The arrow shows the time bin from which the data in (A) and (B) were taken.
To calculate the differentiation time between responses to potential targets and distractors at the population level, the average normalized responses in 25 ms sliding bins were calculated for each neuron and the responses to potential targets and distractors were compared using Wilcoxon sign-rank tests. The dashed lines in Figs. 2D-F represent the middle time point of the first bin in which the p-value from the Wilcoxon rank test was less than 0.05 and in which at least 98 of the following 100 bins also had p-values less than 0.05. Normalized responses were calculated by dividing the actual response by the normalization factor for that neuron. The normalization factor was calculated by taking the mean response in a 200 ms period starting 100 ms after the end of the previous saccade when a distractor, which had not been fixated, was in the response field and was not the goal of the following saccade.
For analyses of the remapping period, we always calculated the response from the number of spikes in a 25 ms window, centered 20 ms after the end of the previous saccade. This window was chosen because almost a third of neurons showed a significant difference in response to a distractor and potential target at this time and that this cannot come via the retina as the bin ends 32 ms after the end of the previous saccade (Bisley et al., 2004). The results were qualitatively similar if earlier or later bins were used.
To compare the responses in the remapping period to the responses during stable fixation, we calculated a normalized response difference (NRD). By definition, the stable fixation period was a 25 ms window centered 150 ms after end of the last saccade. The NRDs were calculated using the following two formulae:
| (1) |
| (2) |
Where NRDf and NRDr are the normalized response differences during stable fixation (f) and remapping (r) respectively. Tf and Df are the average responses of a neuron to a potential target (T) and a distractor (D) inside the receptive field during the fixation time. Tr and Dr are the average responses of a neuron to a potential target (T) and a distractor (D) that are brought into the receptive field by the saccade during the remapping time. Note that both formulae used the sum of the average responses during stable fixation as the normalizing factor in the denominator of the equations. This allowed us to directly compare the relative difference in the numerators in the two conditions.
To quantitatively evaluate whether remapping occurred for all spatial locations, we ran a three-way ANOVA. The factors in the ANOVA were object identity (potential target or distractor), saccade starting location (a subset of all unique starting locations of saccades that had at least 10 recorded fixations) and saccade ending location (a subset of all unique ending locations of saccades that had at least 10 recorded fixations). Data were analyzed using custom code written in Matlab (Mathworks Inc.).
Results
A representation of stimulus priority was present in the remapped response
The anticipatory remapping signal in LIP reflected the activity seen during fixation. We have previously shown that most neurons in LIP respond more to potential targets than task irrelevant distractors in this foraging task (Mirpour et al., 2009). This is illustrated in Fig. 2A, which shows the response of a single LIP neuron to the onset of the array when a potential target (red trace) or a distractor (blue trace) appeared in its receptive field. From array onset, it took 79 ms before the neuron’s response significantly differentiated between a potential target and a distractor (vertical dashed line, Fig. 2A). This was calculated using a sliding window analysis, in which the responses in 25 ms bins were compared using a t-test (for details see Materials and Methods).
To test if this neuron showed anticipatory remapping, we examined the responses when a potential target or a distractor was brought into the receptive field by a saccade, aligned by either the start of the saccade (Fig. 2B) or by the end of the saccade (Fig. 2C). Well after the saccade (150-250 ms), the neuron responded with significantly greater activity to the potential target than to the distractor, independent of whether the data were aligned by the start or end of the saccade (t-tests, p<0.05). Importantly, whether the response of the neuron was aligned by the start of the saccade or by the end of the saccade, the neuron’s response differentiated between a potential target and a distractor sooner than it did in the array onset condition (compare vertical dashed lines in Figs. 2A-C). When aligned by the end of the saccade, which better approximates the time that the stimulus entered the center of the receptive field, the neuron significantly differentiated between the potential target and distractor 69 ms earlier than following array onset. In fact, in this condition, the neuron significantly differentiated between the potential target and distractor in a shorter time (10 ms after the end of the saccade) than the visual latency of the neuron, clearly indicating that information about the identity of the stimulus could not have come from the retina.
The same early differentiation between responses to potential targets and distractors brought into the receptive field by a saccade was observed at the population level. Figures 2D-F show average population responses from 29 neurons when a stimulus appeared in the receptive field following array onset (Fig. 2D) and from 52 neurons when the stimulus was brought into the receptive field by a saccade, either aligned by saccade onset (Fig. 2E) or aligned by the end of the saccade (Fig. 2F). For the population, it took approximately 86 ms for the population response to significantly differentiate between a potential target and a distractor after array onset. As in the single unit example, this occurred much earlier when the stimulus was brought in by a saccade (compare vertical dashed lines); the population response significantly differentiated between a potential target and distractor 16 ms before the start of the saccade and 51 ms before the end of the saccade.
Next we studied how many individual neurons showed the priority remapping effect. Under ideal conditions, a neuron that does not exhibit a remapped response should significantly differentiate between a potential target and a distractor at the same time whether brought into the receptive field by array onset or by a saccade, when aligned by the end of the saccade. The underlying concept is that when aligned by the end of the saccade, the stimulus only enters the receptive field shortly before time zero, so if the response is coming from the retina, then it will do so with a timing similar to that seen when the array appears de novo. Indeed, this has been shown in area MT, which does not display anticipatory remapping (Ong and Bisley, 2011). Thus, to test whether neurons show anticipatory remapping, we analyzed the neural data aligned with the end of the saccade.
To examine how many neurons showed a differential response to a potential target compared to a distractor as a function of time, we used the same sliding window analysis used above. Figure 3A shows mean responses to potential targets plotted as a function of mean responses to distractors for all 52 neurons in a 25 ms bin centered 20 ms after the end of the previous saccade. Neurons with individual significant differences are illustrated by the filled circles (p<0.05, t-tests). All but one of the significant neurons responded more to a potential target than to a distractor. During the same window, only 2 neurons showed a significant difference in the array onset condition (Fig. 3B) and these both responded more in the distractor condition than in the potential target condition. Note that this epoch is entirely before the visual latency in the array onset condition, so it is quite possible that these neurons, and several in Fig. 3A, may be highlighted due to chance because we are performing multiple comparisons and are using a p-value of 0.05 to indicate significance. Figure 3C illustrates the percentage of neurons showing significantly greater activity to a potential target than to a distractor at each point tested in the array onset condition (black) and in the saccade condition (gray). In the array onset condition a small number of neurons begin to consistently differentiate between potential targets and distractors around 45 ms, but most start to show a consistent difference between 95 and 125 ms. When aligned by the end of the saccade, a small number of neurons showed consistent differences as early as 75 ms before the end of the saccade (see early step in gray trace, Fig. 3C), which is more than 40 ms prior to the beginning of the average saccade. A substantial subset of neurons began to show the difference around 10-20 ms after the saccade. For the rest of this manuscript, we will use the activity from the 25 ms window centered 20 ms after the end of the last saccade as our example of remapping activity. We chose this window as it is one of the first where a third of neurons have significant differences (arrow, Fig. 3C) and it encompasses a time in which activity can only come from remapping: 8 ms to 32 ms inclusively. Similar results from all analyses were found at later times and, albeit with less neurons involved, at earlier times.
Most of the neurons with anticipatory responses that differentiated between a potential target and a distractor responded in the same way during stable fixation. If anticipatory remapping is thought to send a response to the neuron before it would get there via the retina, then the activity during the remapping period should resemble the activity that would appear later. To test this, we first examined the responses in a 25 ms window centered 150 ms after the end of the saccade. Figure 4A shows the responses for all 52 neurons from this window. As expected from previous studies (Oristaglio et al., 2006; Thomas and Pare, 2007; Ipata et al., 2009; Mirpour et al., 2009), the majority of neurons responded more to a potential target than to a distractor. Indeed, all of the neurons that had a significant anticipatory remapping response at 20 ms (filled circles in Fig. 3A) had a stronger response to a potential target than to a distractor at 150 ms, well after the saccade ended (filled circles in Fig. 4A). In fact, all of these neurons had a significantly greater response to a potential target than to a distractor in this window. Interestingly, the one neuron that showed greater activity to a distractor in the remapping period (filled point below the unity line in Fig. 3A) showed a weak difference in response during stable fixation (arrow, Fig. 4A).
Figure 4.
Responses during fixation are similar to responses during the remapping period. A, The mean response to a potential target is plotted as a function of the mean response to a distractor for all neurons in a 25 ms window centered 150 ms after the end of the last saccade. Filled points indicate which individual neurons showed a significant difference between responses in the remapping period; ie the significant neurons from Fig. 3A. The arrow indicates the neuron that had a greater response to a distractor in the remapping period. B, The relative normalized response differences between a potential target and distractor from a 25 ms window centered 150 ms after the end of the last saccade are plotted as a function of the normalized response differences between a potential target and distractor from a 25 ms window centered 20 ms after the end of the last saccade. The absolute differences were divided by the sum of activity from the activity recorded at 150 ms for both axes. The solid line shows the line of best fit for all the filled neurons. Other conventions as in (A).
The relative differences in response magnitude to the two stimuli were similar during the remapping period and the stable fixation period. The above analysis showed that all of the neurons that had significantly stronger responses to potential targets in the remapping period also had significantly stronger responses to potential targets during fixation. However, if the remapped response is to be useful to the system, then the relative responses to the different stimuli should be similar in the remapping period and during stable fixation. To test this, we calculated a normalized response difference. This was based on a standard contrast index: for the fixation period we divided the difference between the response to a potential target and the response to a distractor by the sum of the two. So that we could directly compare the normalized differences, we divided the difference between the response to a potential target and the response to a distractor in the remapping period by the sum of the activity measured in the fixation period. We found that there was a significant correlation (solid line, Fig. 4B; p = 0.0001, r2 = 0.66, intercept: 0.10, slope: 0.90, Pearson correlation) between the normalized response differences in the two windows for the neurons that showed a significant difference in response during the remapping period (filled circles, Fig. 4B) and no correlation for neurons that did not show a difference in the remapping period (open circles, p = 0.43, r2 = 0.019). Indeed, if the outlier neuron that showed greater activity to a distractor compared to a potential target during the remapping period (filled point below the unity line in Fig. 3A) was excluded from the pool of significant neurons (arrow, Fig. 4B), the regression had a slope of 1.01, with an intercept of 0.080 and an r-square of 0.63. In either case, although there is clearly some variance, this correlation suggests that the actual differences in responses to the two stimuli during the remapping and fixation periods were similar, with a slightly greater difference present during the fixation condition. We take this to be good evidence that the response in LIP during this remapping period strongly resembles the response in LIP during stable fixation.
The remapped response differentiated among all classes of stimuli. From the data presented above, it seems that responses to both potential targets and distractors are remapped. However, it is possible that only the responses to potential targets are remapped and the correlation in Fig. 4B is just due to the fact that the neurons that have greater activity to potential targets during fixation also have greater activity to potential targets in the remapping period. To test whether the responses from all classes of stimuli are remapped, we analyzed responses from four different conditions. First, we divided the data from potential targets into two classes based on whether the stimulus that was brought into the receptive field by a saccade had already been fixated on that trial or not. We have previously shown that responses to a T are reduced once it has been fixated (Mirpour et al., 2009), so we predicted that on this subset of fixations, the response to a fixated T would be less than to a potential target that had not been fixated. In addition to the distractor category, we also included data from fixations in which no stimulus was brought into the receptive field by the saccade. Usually in these cases, part of the edge of the screen or the wall behind the screen was in the receptive field. But, consistent with a previous study (Gottlieb et al., 1998), because these were stable background items we found that responses during fixation with ‘nothing’ in the receptive field were consistently low. We hypothesized that if an accurate representation of the activity seen in stable fixation is remapped, then during our remapping period (a 25 ms bin centered around 20 ms after the end of the saccade), we should see greatest activity to a potential target, lesser activity to previously fixated Ts and distractors and the lowest response when nothing would be brought into the receptive field. We found this pattern of activity (Fig. 5). The mean normalized response to nothing in the receptive field was significantly lower than the mean normalized responses to any of the other three categories (p<0.001, paired t-tests). These differences remained significant (p<0.001) even when we only looked at the subset of neurons that showed a significant difference between distractors and potential targets in the remapping period (ie. filled circles in Fig. 3A). We also found that the remapped response to a potential target was significantly greater than to a distractor (p<<0.001) and to a previously fixated T (p=0.014) showing that the remapped activity closely resembles the activity that will be present after fixation has stabilized.
Figure 5.
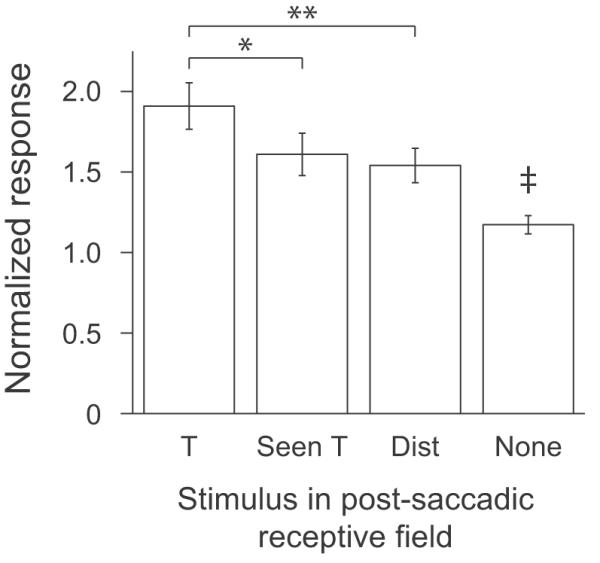
Mean normalized responses in the remapping period. Mean normalized responses from 59 neurons in a 25 ms window centered 20 ms after the end of the saccade are plotted for fixations in which the saccade brought a potential target that had not been fixated (T), a potential target that had been previously fixated within the trial (Seen T), a distractor (Dist) or no stimulus (None) into the receptive field. *: p<0.05; **: p<0.001; ‡: p<0.001 when compared to all other categories.
Remapping occurred in all spatial locations
Because we did not simultaneously record from neurons covering the entire visual field, we addressed the question of whether the entire visual field is remapped by looking at remapping when gaze was at different locations on the screen. Although we recorded from only a single neuron at a time, the animal had access to the whole visual field, so any object in the receptive field was really just one among many. Thus, for each different starting location and saccade vector, we get information about how the animal processed that region of space.
Neurons exhibiting remapping tended to remap responses independently of the start and end points of the saccade. Because the pre-array fixation point was usually kept in the same location within a session, some saccades were more commonly executed than others. Figure 6 shows the responses to a potential target and distractor brought into the receptive field by the four most common saccades in a single session. It is clear that in all cases the neuron’s responses differentiate between the potential target and distractor before 60 ms; illustrating an anticipatory remapping of stimulus priority. To try and quantify this, we analyzed the responses for each neuron in the remapping period (vertical gray bars, Fig. 6) using a 3-way ANOVA for all saccade starting and ending locations that were fixated at least 10 times within the session. The factors in the ANOVA were object identity (potential target or distractor in the response field), saccade starting location and saccade ending location. We found that 18/52 neurons (34.6%) showed a significant main effect of object identity in which the response to a potential target was significantly greater than the response to a distractor. This is illustrated in Fig. 7A, in which the mean responses to a potential target are plotted as a function of the mean responses to a distractor and in which the neurons with a main effect of object identity are indicated by filled circles. These neurons differentiated between a potential target and distractor independent of starting or ending location. There is a great deal of overlap between these neurons and those neurons identified in the analysis illustrated in Fig. 3A. 14 of the 18 neurons that were significant in this analysis were also significant in Fig. 3A, in which the analysis involved t-tests and in which more data were available, because all saccade starting and ending locations were used.
Figure 6.

Mean responses from a single neuron for four different saccades. Mean responses from fixations in which a potential target (red traces) or a distractor (blue traces) were brought into the receptive field by a saccade, aligned by the end of the saccade. The inserts show the stimulus locations, saccade directions and, in the lower left insert, the location of the response field relative to the pre-saccadic fixation location. The vertical gray bars show the remapping period, a 25 ms window centered 20 ms after the end of the saccade.
Figure 7.

Results from the 3-way ANOVA. A, B, C, The results from the 3-way ANOVA are illustrated on plots showing the mean response to a potential target plotted against the mean response to distractor for each neuron. Filled circles indicate which neurons had a main effect of object category (A), which neurons had a main effect of starting location (B) and which neurons had an interaction between object and starting location (C).
A broad enough group of starting and ending locations were used in many neurons to show a significant gain field effect. We found that 36/52 neurons (69.2%) showed a main effect of saccade starting location and 28/52 neurons (53.8%) showed a main effect of saccade ending location. In both cases, there was no relationship between how the neurons responded to the two different stimuli and whether they showed significant main effects of location. This is illustrated in Fig. 7B, in which neurons that showed a significant main effect of saccade starting location (filled circles) are evenly spread throughout the figure. Very few neurons showed an interaction between starting location and object identity (4/52; 7.8%; Fig. 7C) or ending location and object identity (3/52; 5.8 %), and only 3 of those 7 were neurons that showed a main effect of object identity. Together, these results show that almost a third of neurons respond more to a potential target than to a distractor during the remapping period, and almost all of these do it independent of starting or ending location. Those neurons that show both a main effect of object identity and starting or ending location, but no interaction, are showing a gain effect. They have different magnitudes of responses when the eye is in different locations, but still differentiate between potential targets and distractors in those locations. These data suggest that the population remapping response we see is not biased or driven by saccade starting or ending locations.
The remapped response was similar for shorter and longer saccades. The above analysis showed that responses from across the visual field were remapped, however it did not differentiate between saccades that were made to neighboring stimuli and longer saccades. Due to the lack of restrictions on eye movements, the animals’ saccade lengths varied greatly, but because of the arrangement of the stimuli, the distributions were clearly multi-modal (Fig. 8A). To show that remapping occurred for both short and long saccades, we divided the saccades in each session into two equal sized categories: short and long. We excluded all saccades of 2 deg or less to remove micro-saccades and saccades that kept gaze close to the same stimulus. This usually resulted in having a single mode in the long saccade category and one or two modes in the short saccade category. The separation of the data into two categories approximately halved the number of data points in every category. The mean number of fixations (± SEM) per session for the short saccades was 95.1±11.7 (range: 3 to 442) when a potential target in the response field and was 128.4±13.7 (range: 8 to 535) when a distractor was in the response field. For long saccades these numbers were 92.0±9.3 (range: 5 to 285) for potential targets and 121.4±11.0 (range: 6 to 358) for distractors. Using these data, we still found that the population responded more to a potential target than to a distractor during the remapping period for both short saccades (p << 0.001; Fig. 8B) and long saccades (p << 0.001; Fig. 8C). Furthermore, a subset of neurons continued to illustrate a significant difference in response (p<0.05; solid circles, Figs. 8B and C). When combined with the results of Heiser and Colby (2006), our data show that LIP responses are remapped for both short and long saccades, from any starting point or ending point and for saccades in multiple directions. From this we conclude that attentional priority from across the entire visual field is remapped with each saccade.
Figure 8.

Remapping occurs for both short and long saccades. A, The distribution of saccade lengths from an example single session. For analysis, saccades of 2 deg or less were excluded. B, The mean response to a potential target is plotted as a function of the mean response to a distractor for the short saccades in a 25 ms window centered 20 ms after the end of the last saccade. C, The mean response to a potential target is plotted as a function of the mean response to a distractor for the long saccades in a 25 ms window centered 20 ms after the end of the last saccade. Filled points indicate which individual neurons showed a significant difference between responses (p<0.05, t-tests).
Discussion
This study identified two novel and fundamental properties about anticipatory remapping. First, we found that anticipatory activity is a reasonable facsimile of the activity that emerges after fixation stabilizes. Second, we showed that activity across the entire visual scene is remapped. These data are consistent with the hypothesis that activity across LIP is remapped around the time of the saccade, so that by the time the saccade finishes the activity profile closely resembles the profile that will come via the visual system after fixation commences. These are essential properties if remapping is to play a significant role in maintaining spatial stability across saccades.
It has been suggested that remapping is involved in maintaining visual stability (Wurtz, 2008; Hall and Colby, 2011). The concept is that if LIP acts as a priority map, which is used to guide covert and overt attention, then the remapping of priority for all spatial locations is an efficient way to help overcome disturbances to spatial awareness that could occur due to gaze shifts and the resulting delay as new information from the retina makes its way into cortex. Responses of neurons that do not exhibit remapping retain a representation of the pre-saccadic scene up until the point when the response stops following a saccade that removes a stimulus from the response field. And, as we have shown, neurons that display remapping obtain a representation of the post-saccadic scene as early as 10-20 ms after the saccade. Thus, there is a relatively faithful representation of space that switches from the pre-to post-saccadic representation shortly after the saccade ends without having to wait for the visual system to catch up.
A number of recent studies have examined the strength of remapped responses. A study by Crapse and Sommer (2012) showed that the stability of a stimulus influenced the remapped response in FEF and other studies have suggested that stimulus salience (Joiner et al., 2011) and context (Churan et al., 2011) appear to affect remapping in the FEF and superior colliculus. Our data add to this literature by showing that the remapped responses of many neurons not only differentiate between different stimulus classes, but that these responses are correlated to the responses seen in the same neurons once fixation has stabilized.
The responses in LIP have been described by some labs as representing priority (Gottlieb et al., 2009; Bisley and Goldberg, 2010; Mirpour and Bisley, 2012); a combination of bottom-up salience and top-down cognitive processes. Others have suggested that the responses may represent the relative value of a stimulus (Platt and Glimcher, 1999; Dorris and Glimcher, 2004; Sugrue et al., 2004; Seo et al., 2009; Louie and Glimcher, 2010) or the outcome of a decision process (Roitman and Shadlen, 2002; Yang and Shadlen, 2007; Churchland et al., 2008; Kiani et al., 2008). Independent of the language describing the activity or of the putative roles that LIP may play, there is a clear consensus that the response level of LIP neurons is functionally important. Our finding, that the anticipatory remapped response reflects the response that the neuron will have following the saccade, suggests that the remapped response is important in maintaining some stability of information transfer across saccades (Melcher and Morrone, 2003; Melcher, 2005), independent of whether that information is priority, value or a representation of a decision. Similar results have been described in an abstract, which focused on pre-saccadic and post-saccadic shape selectivity to briefly flashed stimuli (Subramanian et al., 2009).
It has been suggested that only the attended stimulus is remapped (Hall and Colby, 2011). If this is interpreted as meaning that only the response from a single stimulus is remapped, then our data are inconsistent this hypothesis. However, our data are consistent if the interpretation is that any stimulus that could capture attention is remapped. If this is the case, we would argue that a better description of this would be that attentional priority is remapped. Our data suggest that responses from all stimuli are remapped across the visual field around every saccade when multiple stimuli are present. Although we only recorded from one neuron at a time, we assume that the neuron is one of many the animal uses to guide behavior. Thus, the fact that each neuron exhibited a remapped response independent of where the saccade started and ended suggests that responses about all stimuli are remapped across each eye movement. In a study using reverse correlation analysis, broad remapping was not seen (Churan et al., 2011). However, this could be due to the rapid changes across the visual field (stimuli were moved every 11.7 ms), which may not provide a stable enough template for remapping.
From a mechanistic standpoint, remapping priority across the entire visual field should not be significantly more complex than remapping a single stimulus. It has previously been shown that remapping occurs for saccades made in multiple directions (Heiser and Colby, 2006) and, based on the fact that all remapping studies place stimuli at different locations, so as to match the neuron’s receptive field location, it is clear that remapping occurs at many, if not all, eccentricities and spatial locations (Churan et al., 2011; Joiner et al., 2011). Thus, the mechanism that is utilized to remap a single stimulus should be able to remap responses from any one location to any other location within the visual field. Given that the system can do this, it should be able to handle moving responses across the visual field along any vector. One could argue that only high priority stimuli are remapped and, in our study, distractors are considered of high enough priority to be remapped. This could be because they are not stable over time (Gottlieb et al., 1998) and are bright and salient against the background (Arcizet et al., 2011). However, given that there is no clear evidence that anticipatory remapping is limited to a single stimulus or a limited number of stimuli, we feel that the evidence more strongly supports the hypothesis that responses representing priority from the entire visual scene are remapped around every saccade.
Our analyses are very conservative and probably underestimate how many neurons show remapping and how early the neurons differentiate between potential targets and distractors. This is due to three reasons. First, unlike previous remapping studies, which have just needed to identify the beginning of a remapped response (Duhamel et al., 1992; Nakamura and Colby, 2002), we are attempting to identify a difference in the remapped response. Second, the saccade not only brings an object into the receptive field, but usually takes an object out of the receptive field, thus the activity prior to the saccade is usually elevated already. Finally, some neurons show a post-saccadic excitability that occurs around the time we expect to find the remapped response. Despite these difficulties, we found that about a third of neurons show a differential remapped response as early as 10-20 ms after the end of the prior saccade and this is represented in the population before the saccade even begins.
Most studies that have examined LIP remapping activity have done so using brief stimuli presented just before the saccade (Duhamel et al., 1992; Kusunoki and Goldberg, 2003; Heiser et al., 2005; Heiser and Colby, 2006; Berman et al., 2007; Joiner et al., 2011). This paradigm is used to probe the system during the remapping process and can be directly related to behavioral studies that have examined the perception of similarly presented stimuli (Honda, 1989; Dassonville et al., 1992; Schlag and Schlag-Rey, 1995; Jeffries et al., 2007). We chose to use spatially stable stimuli because the neural remapping under these conditions better represents the process occurring as we shift our gaze around the real world. In addition, one of the main questions we were interested in, whether attentional priority is remapped, is better addressed with stable stimuli as we do not have to deal with the uninformative visual burst that dominates the initial response in LIP to sudden onsets (Bisley et al., 2004).
Our data are consistent with behavioral studies that have examined the time course of remapping inhibition of return (Posner and Cohen, 1984). Recent studies have shown that the slowing of reaction times, thought to be brought about by inhibitory tagging, have already been remapped when tested shortly after a saccade has been made (Pertzov et al., 2010; Hilchey et al., submitted). We have suggested that the reduced activity seen in response to T that has been examined (Seen T in Fig. 5), could be a neural correlate of this inhibitory tagging (Shariat Torbaghan et al., in press). Thus, the fact that this reduced activity is present 20 ms after fixation begins could explain the fact that reaction time inhibition of return is found when probed shortly after a saccade has been made.
Acknowedgements
This work was supported by a McKnight Scholar Award, a Klingenstein Fellowship Award in the Neurosciences, an Alfred P. Sloan Foundation Research Fellowship and the National Eye Institute (R01 EY019273-01). We thank Dr. Rich Krauzlis for comments on the manuscript and members of the UCLA DLAM for their superb animal care.
References
- Arcizet F, Mirpour K, Bisley JW. A pure salience response in posterior parietal cortex. Cereb Cortex. 2011;21:2498–2506. doi: 10.1093/cercor/bhr035. [DOI] [PMC free article] [PubMed] [Google Scholar]
- Barash S, Bracewell RM, Fogassi L, Gnadt JW, Andersen RA. Saccade-related activity in the lateral intraparietal area. I. Temporal properties; comparison with area 7a. Journal of Neurophysiology. 1991;66:1095–1108. doi: 10.1152/jn.1991.66.3.1095. [DOI] [PubMed] [Google Scholar]
- Berman RA, Heiser LM, Dunn CA, Saunders RC, Colby CL. Dynamic circuitry for updating spatial representations: III. From neurons to behavior. J Neurophysiol. 2007;98:105–121. doi: 10.1152/jn.00330.2007. [DOI] [PMC free article] [PubMed] [Google Scholar]
- Bisley JW, Goldberg ME. Neural correlates of attention and distractibility in the lateral intraparietal area. J Neurophysiol. 2006;95:1696–1717. doi: 10.1152/jn.00848.2005. [DOI] [PMC free article] [PubMed] [Google Scholar]
- Bisley JW, Goldberg ME. Attention, intention, and priority in the parietal lobe. Annu Rev Neurosci. 2010;33:1–21. doi: 10.1146/annurev-neuro-060909-152823. [DOI] [PMC free article] [PubMed] [Google Scholar]
- Bisley JW, Krishna BS, Goldberg ME. A rapid and precise on-response in posterior parietal cortex. J Neurosci. 2004;24:1833–1838. doi: 10.1523/JNEUROSCI.5007-03.2004. [DOI] [PMC free article] [PubMed] [Google Scholar]
- Churan J, Guitton D, Pack CC. Context dependence of receptive field remapping in superior colliculus. J Neurophysiol. 2011;106:1862–1874. doi: 10.1152/jn.00288.2011. [DOI] [PubMed] [Google Scholar]
- Churchland AK, Kiani R, Shadlen MN. Decision-making with multiple alternatives. Nat Neurosci. 2008;11:693–702. doi: 10.1038/nn.2123. [DOI] [PMC free article] [PubMed] [Google Scholar]
- Crapse TB, Sommer MA. Frontal eye field neurons assess visual stability across saccades. J Neurosci. 2012;32:2835–2845. doi: 10.1523/JNEUROSCI.1320-11.2012. [DOI] [PMC free article] [PubMed] [Google Scholar]
- Dassonville P, Schlag J, Schlag-Rey M. Oculomotor localization relies on a damped representation of saccadic eye displacement in human and nonhuman primates. Vis Neurosci. 1992;9:261–269. doi: 10.1017/s0952523800010671. [DOI] [PubMed] [Google Scholar]
- Dorris MC, Glimcher PW. Activity in posterior parietal cortex is correlated with the relative subjective desirability of action. Neuron. 2004;44:365–378. doi: 10.1016/j.neuron.2004.09.009. [DOI] [PubMed] [Google Scholar]
- Duhamel JR, Colby CL, Goldberg ME. The updating of the representation of visual space in parietal cortex by intended eye movements. Science. 1992;255:90–92. doi: 10.1126/science.1553535. [DOI] [PubMed] [Google Scholar]
- Dunn CA, Hall NJ, Colby CL. Spatial updating in monkey superior colliculus in the absence of the forebrain commissures: dissociation between superficial and intermediate layers. J Neurophysiol. 2010;104:1267–1285. doi: 10.1152/jn.00675.2009. [DOI] [PMC free article] [PubMed] [Google Scholar]
- Gottlieb J, Balan P, Oristaglio J, Suzuki M. Parietal control of attentional guidance: the significance of sensory, motivational and motor factors. Neurobiol Learn Mem. 2009;91:121–128. doi: 10.1016/j.nlm.2008.09.013. [DOI] [PMC free article] [PubMed] [Google Scholar]
- Gottlieb JP, Kusunoki M, Goldberg ME. The representation of visual salience in monkey parietal cortex. Nature. 1998;391:481–484. doi: 10.1038/35135. [DOI] [PubMed] [Google Scholar]
- Hall NJ, Colby CL. Remapping for visual stability. Philos Trans R Soc Lond B Biol Sci. 2011;366:528–539. doi: 10.1098/rstb.2010.0248. [DOI] [PMC free article] [PubMed] [Google Scholar]
- Hamker FH, Zirnsak M, Ziesche A, Lappe M. Computational models of spatial updating in peri-saccadic perception. Philos Trans R Soc Lond B Biol Sci. 2011;366:554–571. doi: 10.1098/rstb.2010.0229. [DOI] [PMC free article] [PubMed] [Google Scholar]
- Hays AV, Richmond BJ, Optican LM. Unix-based multiple-process system, for real-time data acquisition and control. WESCON Conf Proc. 1982;2:1–10. [Google Scholar]
- Heiser LM, Colby CL. Spatial updating in area LIP is independent of saccade direction. J Neurophysiol. 2006;95:2751–2767. doi: 10.1152/jn.00054.2005. [DOI] [PubMed] [Google Scholar]
- Heiser LM, Berman RA, Saunders RC, Colby CL. Dynamic circuitry for updating spatial representations. II. Physiological evidence for interhemispheric transfer in area LIP of the split-brain macaque. J Neurophysiol. 2005;94:3249–3258. doi: 10.1152/jn.00029.2005. [DOI] [PubMed] [Google Scholar]
- Hilchey MD, Klein RM, Satel J, Wang Z. Oculomotor inhibition of return: How soon is it “recoded” into spatiotopic coordinates? doi: 10.3758/s13414-012-0312-1. submitted. [DOI] [PubMed] [Google Scholar]
- Honda H. Perceptual localization of visual stimuli flashed during saccades. Percept Psychophys. 1989;45:162–174. doi: 10.3758/bf03208051. [DOI] [PubMed] [Google Scholar]
- Ipata AE, Gee AL, Bisley JW, Goldberg ME. Neurons in the lateral intraparietal area create a priority map by the combination of disparate signals. Exp Brain Res. 2009;192:479–488. doi: 10.1007/s00221-008-1557-8. [DOI] [PMC free article] [PubMed] [Google Scholar]
- Jeffries SM, Kusunoki M, Bisley JW, Cohen IS, Goldberg ME. Rhesus monkeys mislocalize saccade targets flashed for 100ms around the time of a saccade. Vision Res. 2007;47:1924–1934. doi: 10.1016/j.visres.2007.02.021. [DOI] [PMC free article] [PubMed] [Google Scholar]
- Joiner WM, Cavanaugh J, Wurtz RH. Modulation of shifting receptive field activity in frontal eye field by visual salience. J Neurophysiol. 2011;106:1179–1190. doi: 10.1152/jn.01054.2010. [DOI] [PMC free article] [PubMed] [Google Scholar]
- Kiani R, Hanks TD, Shadlen MN. Bounded integration in parietal cortex underlies decisions even when viewing duration is dictated by the environment. J Neurosci. 2008;28:3017–3029. doi: 10.1523/JNEUROSCI.4761-07.2008. [DOI] [PMC free article] [PubMed] [Google Scholar]
- Kusunoki M, Goldberg ME. The time course of perisaccadic receptive field shifts in the lateral intraparietal area of the monkey. J Neurophysiol. 2003;89:1519–1527. doi: 10.1152/jn.00519.2002. [DOI] [PubMed] [Google Scholar]
- Louie K, Glimcher PW. Separating value from choice: delay discounting activity in the lateral intraparietal area. J Neurosci. 2010;30:5498–5507. doi: 10.1523/JNEUROSCI.5742-09.2010. [DOI] [PMC free article] [PubMed] [Google Scholar]
- Melcher D. Spatiotopic transfer of visual-form adaptation across saccadic eye movements. Curr Biol. 2005;15:1745–1748. doi: 10.1016/j.cub.2005.08.044. [DOI] [PubMed] [Google Scholar]
- Melcher D, Morrone MC. Spatiotopic temporal integration of visual motion across saccadic eye movements. Nat Neurosci. 2003;6:877–881. doi: 10.1038/nn1098. [DOI] [PubMed] [Google Scholar]
- Mirpour K, Bisley JW. Dissociating activity in the lateral intraparietal area from value using a visual foraging task. Proc Natl Acad Sci U S A. 2012;109:10083–10088. doi: 10.1073/pnas.1120763109. [DOI] [PMC free article] [PubMed] [Google Scholar]
- Mirpour K, Ong WS, Bisley JW. Microstimulation of posterior parietal cortex biases the selection of eye movement goals during search. J Neurophysiol. 2010;104:3021–3028. doi: 10.1152/jn.00397.2010. [DOI] [PMC free article] [PubMed] [Google Scholar]
- Mirpour K, Arcizet F, Ong WS, Bisley JW. Been there, seen that: a neural mechanism for performing efficient visual search. J Neurophysiol. 2009;102:3481–3491. doi: 10.1152/jn.00688.2009. [DOI] [PMC free article] [PubMed] [Google Scholar]
- Nakamura K, Colby CL. Updating of the visual representation in monkey striate and extrastriate cortex during saccades. Proc Natl Acad Sci U S A. 2002;99:4026–4031. doi: 10.1073/pnas.052379899. [DOI] [PMC free article] [PubMed] [Google Scholar]
- Ong WS, Bisley JW. A lack of anticipatory remapping of retinotopic receptive fields in the middle temporal area. J Neurosci. 2011;31:10432–10436. doi: 10.1523/JNEUROSCI.5589-10.2011. [DOI] [PMC free article] [PubMed] [Google Scholar]
- Oristaglio J, Schneider DM, Balan PF, Gottlieb J. Integration of visuospatial and effector information during symbolically cued limb movements in monkey lateral intraparietal area. J Neurosci. 2006;26:8310–8319. doi: 10.1523/JNEUROSCI.1779-06.2006. [DOI] [PMC free article] [PubMed] [Google Scholar]
- Pertzov Y, Zohary E, Avidan G. Rapid formation of spatiotopic representations as revealed by inhibition of return. J Neurosci. 2010;30:8882–8887. doi: 10.1523/JNEUROSCI.3986-09.2010. [DOI] [PMC free article] [PubMed] [Google Scholar]
- Platt ML, Glimcher PW. Neural correlates of decision variables in parietal cortex. Nature. 1999;400:233–238. doi: 10.1038/22268. [DOI] [PubMed] [Google Scholar]
- Posner MI, Cohen Y. Components of visual orienting. In: Bouma H, Bouwhuis D, editors. Attention and Performance. Erlbaum; Hillsdale, NJ: 1984. pp. 531–556. [Google Scholar]
- Quaia C, Optican LM, Goldberg ME. The maintenance of spatial accuracy by the perisaccadic remapping of visual receptive fields. Neural Networks. 1998;11:1229–1240. doi: 10.1016/s0893-6080(98)00069-0. [DOI] [PubMed] [Google Scholar]
- Roitman JD, Shadlen MN. Response of neurons in the lateral intraparietal area during a combined visual discrimination reaction time task. J Neurosci. 2002;22:9475–9489. doi: 10.1523/JNEUROSCI.22-21-09475.2002. [DOI] [PMC free article] [PubMed] [Google Scholar]
- Schlag J, Schlag-Rey M. Illusory localization of stimuli flashed in the dark before saccades. Vision Res. 1995;35:2347–2357. doi: 10.1016/0042-6989(95)00021-q. [DOI] [PubMed] [Google Scholar]
- Seo H, Barraclough DJ, Lee D. Lateral intraparietal cortex and reinforcement learning during a mixed-strategy game. J Neurosci. 2009;29:7278–7289. doi: 10.1523/JNEUROSCI.1479-09.2009. [DOI] [PMC free article] [PubMed] [Google Scholar]
- Shariat Torbaghan S, Yazdi D, Mirpour K, Bisley JW. Inhibition of return in a visual foraging task in non-human subjects. Vision Res. doi: 10.1016/j.visres.2012.03.022. in press. DOI: 10.1016/j.visres.2012.03.022. [DOI] [PMC free article] [PubMed] [Google Scholar]
- Sommer MA, Wurtz RH. Influence of the thalamus on spatial visual processing in frontal cortex. Nature. 2006;444:374–377. doi: 10.1038/nature05279. [DOI] [PubMed] [Google Scholar]
- Subramanian J, Clemens J, Colby CL. Shape selectivity during remapping in macaque lateral intraparietal area; Neuroscience Meeting Planner; Chicago, IL: Society for Neuroscience. 2009; p Program No 758.758. [Google Scholar]
- Sugrue LP, Corrado GS, Newsome WT. Matching behavior and the representation of value in the parietal cortex. Science. 2004;304:1782–1787. doi: 10.1126/science.1094765. [DOI] [PubMed] [Google Scholar]
- Thomas NW, Pare M. Temporal processing of saccade targets in parietal cortex area LIP during visual search. J Neurophysiol. 2007;97:942–947. doi: 10.1152/jn.00413.2006. [DOI] [PubMed] [Google Scholar]
- Umeno MM, Goldberg ME. Spatial processing in the monkey frontal eye field. I. Predictive visual responses. J Neurophysiol. 1997;78:1373–1383. doi: 10.1152/jn.1997.78.3.1373. [DOI] [PubMed] [Google Scholar]
- Walker MF, Fitzgibbon EJ, Goldberg ME. Neurons in the monkey superior colliculus predict the visual result of impending saccadic eye movements. J Neurophysiol. 1995;73:1988–2003. doi: 10.1152/jn.1995.73.5.1988. [DOI] [PubMed] [Google Scholar]
- Wurtz RH. Neuronal mechanisms of visual stability. Vision Res. 2008;48:2070–2089. doi: 10.1016/j.visres.2008.03.021. [DOI] [PMC free article] [PubMed] [Google Scholar]
- Yang T, Shadlen MN. Probabilistic reasoning by neurons. Nature. 2007;447:1075–1080. doi: 10.1038/nature05852. [DOI] [PubMed] [Google Scholar]