

Abstract
With the widespread use of combination antiretroviral agents, the incidence of HIV-associated nephropathy has decreased. Currently, HIV-infected patients live much longer and often suffer from comorbidities such as diabetes mellitus. Recent epidemiological studies suggest that concurrent HIV infection and diabetes mellitus may have a synergistic effect on the incidence of chronic kidney disease. To address this, we determined whether HIV-1 transgene expression accelerates diabetic kidney injury using a diabetic HIV-1 transgenic (Tg26) murine model. Diabetes was initially induced with low-dose streptozotocin in both Tg26 and the wild-type mice on the C57BL/6 background, which is resistant to classic HIV-associated nephropathy. Although diabetic nephropathy is minimally observed on C57BL/6 background, diabetic Tg26 mice exhibited a significant increase in glomerular injury compared to non-diabetic Tg26 mice or diabetic wild type mice. Validation of microarray gene expression analysis from isolated glomeruli showed a significant up-regulation of pro-inflammatory pathways in the diabetic Tg26 mice. Thus, our study found that expression of HIV-1 genes aggravates diabetic kidney disease
INTRODUCTION
It had been nearly three decades since the first published reports of HIV-associated nephropathy (HIVAN), an aggressive form of focal segmental glomerulosclerosis (FSGS) in patients with Acquired Immunodeficiency Syndrome (AIDS) 1–3. Within years, HIVAN was recognized as not only as an AIDS-defining illness 4, but also a disease predominant in patients of African descent 5. The incidence of HIVAN and the progression to End Stage Renal Disease (ESRD) continued to rise until the advent and the use of combination antiretroviral therapy (cART) in the mid 1990s. In fact, with the widespread use of cART, the incidence of ESRD attributed to HIVAN has reduced to approximately 800–900 cases per year in the United States. However, the prevalence of ESRD in this population has continued to rise, likely due to an increase in patient survival 6. In addition, as patients live longer with HIV, they are at increased risk for comorbidities such as Hypertension and Diabetes Mellitus 7.
Several studies have shown that many patients that undergo a clinically indicated kidney biopsy are diagnosed with a non-HIVAN related kidney disease in the post-ART era ranging from immune complex-mediated kidney diseases to arterionephrosclerosis and diabetic nephropathy 8–10. Studies such as these suggest that the spectrum of kidney disease has considerably changed in the last 15 years. With this change, the clinical course of kidney disease in the cART era has been more indolent, a slow progressive decline in kidney function with lower levels of proteinuria. Although the Office of AIDS Research Advisory Council (OARAC) has clearly stated in the 2012 guidelines that the presence of HIVAN is an indication for initiation of cART regardless of CD4 count, the decision to start cART in non-HIVAN related kidney disease independent of other factors remains unclear (Aidsinfo.nih.gov).
Studies have estimated that nearly 15% of HIV-1 infected patients have comorbid Diabetes Mellitus (DM). In fact, several studies have suggested that concurrent HIV and DM may have an additive effect on the incidence of Chronic Kidney Disease (CKD) 11, 12. For example, Choi et al. showed that HIV and DM may have a synergistic effect on the incidence of End Stage Renal Disease in both Caucasians and African Americans 11. Specifically, in a recent study using the Veterans Aging Cohort Study (VACS) database, we demonstrated that concurrent HIV and DM have a greater effect on the risk of CKD progression than from either condition alone 12.
Since the derivation of the HIV-1 transgenic mice bearing a defective provirus lacking gag-pol (Tg26) in the early 1990s, studies have shown that classical features of HIVAN are exhibited primarily on the FVB background strain 13. These Tg26 mice at an early age exhibit nephrotic range proteinuria, podocyte dedifferentiation and proliferation, collapsing FSGS, and microcystic tubular dilatation and injury, consistent with features observed in HIVAN 13. However, these changes are not observed in the Tg26 mice on the C57BL/6 background. Therefore, Tg26 mice on the C57BL/6 background strain were used to study non-HIVAN kidney disease.
Although epidemiological studies suggest that HIV infection is associated with the progression of CKD in patients with DM, the cause-effect relationship and the mechanism behind this association have yet to be described. Previous studies suggest that chronic inflammation contributes to the disease pathogenesis in both Diabetic Nephropathy and HIVAN 14, 15. Thus, we hypothesized that chronic infection with HIV-1 leads to a pro-inflammatory state thereby accelerating diabetic glomerular disease. Here, we demonstrate that streptozotocin-induced diabetic mice exhibit more glomerular injury in the presence of HIV-1 transgene expression. We also provide evidence suggesting that this process is associated with an upregulation of pro-inflammatory pathways.
RESULTS
Diabetic Tg26 mice exhibit an increase in glomerular injury
C57BL/6 mice are typically resistant to STZ-induced diabetic nephropathy 16 and Tg26 mice on the C57BL/6 background are resistant to HIVAN, typically observed on the FVB background 17, 18. In order to study non-HIVAN related kidney disease, Tg26 mice on the C57BL/6 background was used to test our hypothesis. To confirm that STZ treatment induced diabetes mellitus in mice, physiological parameters of the mice in each of the four groups were measured (Supplementary Table 1). Also, to verify that HIV-1 viral gene expression was unchanged after induction of diabetes with STZ, nef mRNA expression was measured using real-time pcr (Supplementary figure 1). A lack of change in nef expression in Tg26 mice with or without diabetes suggests that an increase in glomerular injury observed in the diabetic Tg26 mice was not a result of an increase in local viral gene expression. nef mRNA expression was undetectable in wild-type mice (data not shown). At 6 months of age, diabetic Tg26 mice exhibited a significant increase in proteinuria as compared to all other groups (Figure 1). Histological changes by light and electron microscopy at low power and high power magnification are shown at 6 months of age (Figure 2). Histologically and by quantification, glomerular size, mesangial expansion, and GBM thickening were significantly increased in the diabetic Tg26 mice as compared to all other groups (Figure 3A–C). Additionally, diabetic and non-diabetic Tg26 mice had a significant increase in foot process effacement as compared to wild-type mice with or without diabetes (Figure 3D). Also, podocyte number per glomerulus was significantly reduced in diabetic Tg26 mice as compared to all other groups (Figure 3E). Combined, these findings suggest that expression of HIV-1 transgene in C57BL/6 diabetic mice induces glomerular injury, typically observed in early diabetic nephropathy.
Figure 1. Diabetic Tg26 mice exhibit an increase in proteinuria.

Wild-type (WT) and Tg26 mice were treated with STZ (Streptozotocin). Urine was collected at baseline prior to STZ or sodium citrate buffer injection and urine protein/creatinine ratio was checked monthly. (A) Urine protein/creatinine ratio at 6 months of age (n=6, *p< 0.01 versus mice treated with sodium citrate buffer).
Figure 2. Diabetic Tg26 mice exhibit an increase in glomerular injury.

Paraffin embedded sections were stained with periodic acid-Schiff (PAS) and images were taken at low power (X 20) and high power (X 40). Ultrastructural changes are shown at low power (X 3000) and high power (X 10000) by transmission electron microscopy.
Figure 3. Quantification of glomerular injury in Diabetic Tg26 mice.

Quantification of (A) glomerular volume, (B) GBM thickness (C) and mesangial expansion are shown (n=3, *p<0.0001 versus all other groups). (D) Quantification of podocyte effacement is shown (n=4, *p<0.0001 versus all groups, **P<0.0001 versus diabetic and non-diabetic wild-type mice). (E) Quantification of podocyte number is shown (n=3, *p<0.0001 versus all groups).
Increase in the activation of pathways involved in inflammation from enrichment analysis of gene array data in diabetic Tg26 mice
To identify unique or synergistic pathways from the differentially expressed genes in the diabetic Tg26 mice, we used oligonucleotide microarrays to profile gene expression in glomeruli isolated from wild-type mice, diabetic wild-type mice, Tg26 mice, and diabetic Tg26 mice. Similarly, microarrays from patients with diabetic nephropathy (glomeruli) were retrieved from the Woroniecka Database in Nephromine (http://www.nephromine.org). Also, to compare changes in gene expression in known murine models of diabetic nephropathy, we acquired microarrays deposited in Gene Expression Omnibus (GSE710) 19. Of the differentially expressed genes in each experimental group, we performed gene enrichment analysis using Expression2Kinases software program to identify pathways involved in inflammation and fibrosis. A combination of gene-list libraries such as Wikipathway, MGI Mammalian Phenotype, KEGG Pathway, and GO molecular function revealed a significant increase in the activation of pathways involving inflammation in the diabetic Tg26 mice, consistent with those observed in human diabetic nephropathy and a known murine model of diabetic nephropathy (db/db mice) (Figure 4). These findings suggest that HIV-1 and diabetes may have a synergic effect on the induction of a pro-inflammatory state leading to the pathogenesis observed in the diabetic Tg26 mice.
Figure 4. Activation of pathways involved in inflammation from gene enrichment analysis in diabetic Tg26 mice, db/db mice (GSE710), and human diabetic nephropathy.

Analysis of terms that are overrepresented among differentially expressed genes in each of the groups as compared to untreated wild-type mice using a combination of the following gene-list libraries: Wikipathway, MGI Mammalian Phenotype, KEGG Pathway, and GO molecular function (p<0.05 + Benjamini-Hochberg correction).
Upregulation of pro-inflammatory genes is validated by real-time PCR
To validate the activation of pro-inflammatory pathways from gene enrichment analysis, primers for selected genes implicated in inflammation were designed (Supplementary Table 2) and quantitative real-time PCR was performed. These pro-inflammatory genes include VCAM1, FAS, FASL, c-MYC, CCL2, and ICAM1. Real-time PCR revealed a significant increase in these pro-inflammatory genes in isolated glomeruli of diabetic Tg26 mice as compared to all other groups (Figure 5). Combined, these findings confirm that a local pro-inflammatory state is associated with the glomerular disease observed in the diabetic Tg26 mice.
Figure 5. Upregulation of pro-inflammatory genes in diabetic Tg26 mice is validated by real-time pcr.
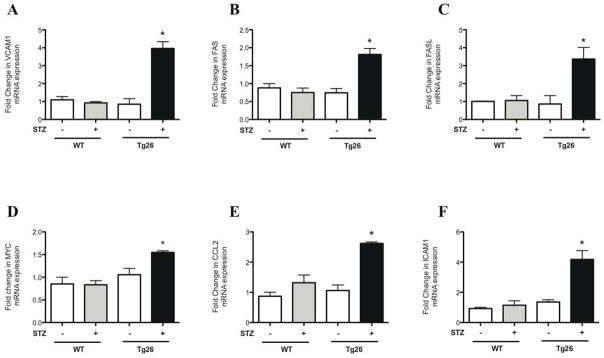
Glomeruli were isolated from all groups of mice and total RNA was extracted. Real-time PCR was performed for (A) VCAM1, (B) FAS, (C) FASL, (D) c-MYC, (E) CCL2, and (F) ICAM1 (n=3, *p<0.01 versus all other groups).
Circulating levels of inflammatory markers
To clarify the role of circulating inflammatory markers in the progression of kidney disease observed in diabetic Tg26 mice, serum was collected from all 4 groups of mice at the time of sacrifice. Sandwich enzyme immunoassay technique was used to measure the circulating levels of TNFR1, TNFR2, and IL-6. A significant increase in TNFR1 and IL-6 serum levels was observed in diabetic only, Tg26 only, and diabetic Tg26 mice as compared to wild-type mice (Figure 6A, 6C). This finding was not observed in circulating levels of TNFR2 (Figure 6B). Although the activation of local inflammatory genes is predominantly observed in the diabetic Tg26 mice, elevation of circulating inflammatory cytokines may still contribute to the glomerular changes observed in this group.
Figure 6. Measurement of circulating serum inflammatory markers.
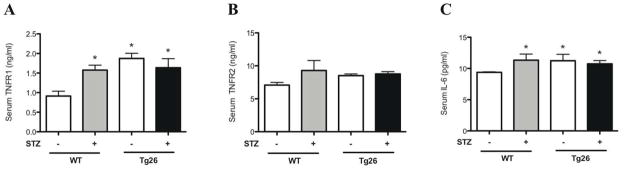
Blood was drawn and serum was isolated from all groups of mice. Quantitative sandwich enzyme immunoassay was used to measure serum (A) TNFR1, (B) TNFR2, and (C) IL-6 levels (n=6, *p<0.005 versus WT mice).
Upregulation of pro-fibrotic genes in diabetic Tg26 mice by real-time PCR
To assess for the activation of pro-fibrotic pathways, primers for genes involved in mesangial expansion were designed (Supplementary Table 2) and quantitative real-time PCR was performed. These genes include TGFβ1, CTGF, Collagen Type I, and α-SMA. Real-time PCR from glomerular extracts revealed a significant increase in the mRNA expression of these genes in the diabetic Tg26 mice as compared to all other groups (Figure 7).
Figure 7. Upregulation of pro-fibrotic genes in diabetic Tg26 mice by real-time pcr.

Glomeruli were isolated from all groups of mice and total RNA was extracted. Real-time PCR was performed for (A) TGFβ1, (B) CTGF, (C) α-SMA, and (D) Collagen Type 1 (n=3, *p<0.01 versus all other groups).
Collagen Type IV expression is increased in diabetic Tg26 mice
Collagen Type IV is constitutively expressed in the glomerular basement membranes (GBM) as well as in the mesangial matrix 20. Since we observed an increase in glomerular basement membrane thickness and mesangial matrix in the diabetic Tg26 mice, Type IV collagen expression was measured to assess for changes in expression and distribution. In isolated glomeruli, Collagen Type IV mRNA expression was significantly increased in diabetic Tg26 mice (Figure 8A). These findings were validated by immunofluorescence qualitatively and quantitatively (Figure 8B–C).
Figure 8. Collagen Type IV expression is increased in diabetic Tg26 mice.
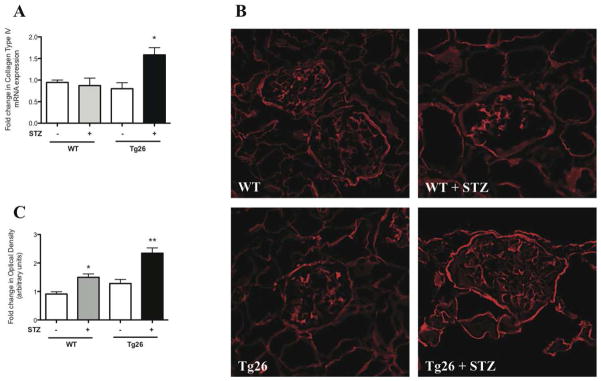
Glomeruli were isolated from all groups of mice and total RNA was extracted. (A) Real-time PCR was performed for Collagen Type IV (n=3, *p<0.05 versus all other groups). Renal cortex was isolated from all groups of mice and (B) immunofluorescence was performed staining for Collagen Type IV with (C) quantification using ImageJ (n=3, *p<0.05 versus WT, **p<0.05 versus all other groups).
Smad3 phosphorylation is increased in diabetic Tg26 mice
Since, there was an upregulation of local pro-fibrotic genes involved in matrix expansion and GBM thickening, we assessed for activation in TGFβ pathway by measuring Smad3 phosphorylation from isolated renal cortex. Smad3 phosphorylation was significantly increased in the diabetic Tg26 mice (Figure 9A). These findings were quantified by densitometry analysis (Figure 9B). Combined, these findings suggest a significant activation of the pro-fibrotic pathway in the diabetic Tg26 mice.
Figure 9. Smad3 phosphorylation is increased in diabetic Tg26 mice.
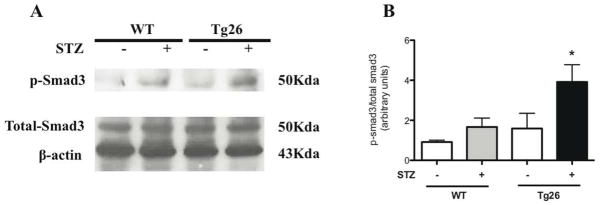
Nuclear protein was initially isolated from renal cortex and p-smad3 (smad3 phosphorylation), total-smad3, and Beta-actin protein expression was measured by (A) western blot. The representative blots of three independent experiments are shown. (B) The densitometry analyses of these blots are shown (n=3, *p<0.05 versus all other groups).
DISCUSSION
A large body of epidemiological studies indicates that the spectrum of HIV-related kidney disease has dramatically changed in the last decade. Furthermore, as patients with HIV live longer, they are more susceptible to non-HIVAN related kidney diseases such as diabetic nephropathy. Although a diagnosis of HIVAN is an indication for cART initiation regardless of CD4 count, it remains unclear whether this remains applicable to patients with non-HIVAN related kidney disease. Furthermore, mechanisms that contribute to this disease process have yet to be described. Here, we provide evidence that HIV-1 may contribute to or aggravate early stages of glomerular disease observed in diabetic nephropathy probably through activation of pro-inflammation pathways.
Although epidemiology studies suggest that HIV infection is associated with the progression of diabetic nephropathy, the cause-effect relationship remains unclear. We provide direct evidence showing that expression of HIV-1 transgene in the diabetic mice contributes to a significant increase in glomerular injury, mimicking early diabetic nephropathy. The observed changes in glomerular injury in the diabetic Tg26 mice were on the C57BL/6 background, a strain typically resistant to diabetic nephropathy and HIVAN 16–18. While these findings suggest that HIV infection contributes to the acceleration of diabetic nephropathy, we do acknowledge that the pathology is not overwhelming. In fact, these findings are more representative of an early stage of glomerular disease and are likely attributable to the sclerosis-resistant mouse background, C57BL/6 21. Diabetes-related glomerulosclerosis is typically observed in sclerosis prone genetic backgrounds 16, 22, 23. Further studies using a similar approach in sclerosis-prone genetic backgrounds will be required to determine the progression to advanced glomerulosclerosis. Nonetheless, we believe the changes observed in this study are unique and likely attributable to the presence of concomitant diabetes and HIV-1 transgene expression, especially since these pathologic changes are typically not observed on this background.
In order to identify genes or synergistic pathways that play a role in the disease progression observed in the diabetic Tg26 mice, microarray expression studies were performed. Using the gene enrichment analysis tool from the Expression2Kinases software 24, we confirmed that pro-inflammatory genes were significantly upregulated in diabetic Tg26 mice, suggesting an underlying mechanism mediating the observed disease process. Similar inflammatory pathways were also activated in human diabetic nephropathy as well as a known murine model of diabetic nephropathy. This suggests that diabetic nephropathy may in part be activated by complementing these inflammatory pathways in C57BL/6 mice in the setting of concomitant diabetes and HIV-1 transgene expression. Also, the activation of inflammatory pathways with HIV infection is consistent with previous studies 25. Furthermore, HIV-associated inflammation has been implicated in premature onset of other end organ abnormalities 25, 26. Finally, we observed an upregulation of genes involved in GBM thickening and mesangial expansion as well as the activation of TGFβ pathway in diabetic Tg26 mice. Therefore, we speculate that a state of local chronic inflammation induced by HIV accelerates diabetic kidney disease.
Circulating levels of TNFR1 have been associated with the progression of diabetic nephropathy 27, 28. Minimal, but yet a significant elevation in serum TNFR1 and IL-6 may contribute to the early glomerular changes observed in the diabetic Tg26 mice. However, it is likely not primarily responsible for the histological changes observed in the diabetic Tg26 mice, since a significant increase in serum TNFR1 and IL-6 levels was also observed in diabetic only and Tg26 only mice. The role of HIV induced systemic inflammatory response in kidney injury still remains to be defined until other circulating inflammatory markers are measured. However, in HIVAN, reciprocal renal transplantation between wild-type and Tg26 mice revealed that intrarenal expression of HIV-1 genes is responsible for progression to HIVAN and not due to systemic inflammation 29. Therefore, the kidney has been considered a reservoir for HIV-1. In this study, a lack of change in nef expression in Tg26 mice with or without diabetes suggests that an increase in glomerular injury observed in the diabetic Tg26 mice is not a result of an increase in local viral gene expression.
In summary, we report a murine model to study non-HIVAN related kidney disease. Our studies suggest that the presence of HIV-1 transgene accelerates the progression of diabetic nephropathy. Furthermore, the activation of local pro-inflammatory pathways in the setting of concurrent diabetes and HIV-1 transgene expression may contribute to glomerular injury observed in this murine model. This study provides a novel insight into potential mechanisms involved in the progression of non-HIVAN related kidney disease.
METHODS
Genotyping of Tg26 mice
Mount Sinai School of Medicine Animal Institute Committee approved all animal studies and the NIH Guide for the Care and Use of Laboratory Animals was followed strictly. Derivation of a transgenic mouse line (Tg26 mice) that bears a defective HIV-1 provirus lacking gag-pol (Tg26) has been described 13. Tg26 mice in the FVB/N background were backcrossed six generations to C57BL/6 background. Wild-type (WT) mice generated from the same litter of Tg26 mice were used as the controls in the studies. Genotyping by tail prep and PCR were performed at 2 weeks of age as previously described 30.
Low-dose streptozotocin-induced diabetes
Induction of diabetes using streptozotocin (STZ) has previously been described 31. Briefly, on day 1, Tg26 and WT mice at 6 weeks of age were initially deprived of food for 4 hours. Then low dose STZ (50mg/kg) in 50mM sodium citrate buffer (pH 5.4) was administered intraperitoneally. STZ was administered similarly at the same dose on days 2 to 5. On day 14, all mice were deprived of food for 6 hours and fasting blood glucose level from tail vein was checked using One Touch Blood Glucose Monitoring System. Repeat fasting blood glucose measurements were performed monthly to verify hyperglycemia. Diabetes Mellitus was defined as sustained fasting blood glucose above 250mg/dl at two distinct time points two weeks post STZ injection 31. All mice were sacrificed at 6 months of age.
Measurement of urine albumin and creatinine
Urine albumin was quantified by ELISA using a kit from Bethyl Laboratory Inc. (Houston, TX, USA). Urine creatinine levels were measured in the same samples using QuantiChrom™ Creatinine Assay Kit (DICT-500) (BioAssay Systems) according to the manufacturer instructions. The urine albumin excretion rate was expressed as the ratio of albumin to creatinine.
Bright-field light microscopy and morphometric studies
Mice were perfused with HBSS and fixed with 4% paraformaldehyde overnight. Kidney tissue was embedded in paraffin by American Histolabs (Gaithersberg, MD) and 3μm thick sections were stained with periodic acid-Schiff (PAS) (Sigma).
Estimation of glomerular volume and mesangial area was performed as previously described 32, 33. Briefly, digitized images were scanned and profile areas were traced using ImageJ. Mean glomerular tuft volume (GV) was determined from mean glomerular cross-sectional area (GA) by light microscopy. GA was calculated based on average area of 30 glomeruli in each group and GV was calculated based on the following equation:
(β= 1.38, the shape coefficient of spheres (the idealized shape of glomeruli), and κ = 1.1, the size distribution coefficient). Also, mesangial expansion was defined as PAS-positive and nuclei-free area in the mesangium. Quantification of mesangial expansion was based on 20 glomeruli cut at the vascular pole in each group.
Quantification of podocyte number per glomerulus was determined using WT-1 stained podocytes. First, kidney sections from these mice were prepared in identical fashion. Then, 4μm thick sections were stained with rabbit anti-WT-1 (Novus) as previously described 34. Counting of podocytes and quantification of glomerular are and volume was measured using ImageJ and by the method standardized by Animal Models of Diabetic Complications Consortium 32.
Transmission electron microscopy and morphometric studies
Mice were perfused with HBSS and then immediately fixed in 2.5% glutaraldehyde for electron microscopy (EM). Sections were mounted on a copper grid and photographed under a Hitachi H7650 microscope.
Quantification of podocyte effacement was performed as previously described 35. Briefly, negatives were digitized, and images with a final magnitude of approximately X15,000 were obtained. ImageJ 1.26t software (National Institute of Health, rsb.info.nih.gov/ij) was used to measure the length of the peripheral GBM and the number of slit pores overlying this GBM length was counted. The arithmetic mean of the foot process width (WFP) was calculated as the following:
(Σslits indicates the total number of slits counted, ΣGBM length indicates the total GBM length measured in one glomerulus, and is the correction factor for the random orientation by which the foot processes were sectioned) 35.
Sections stained with uranyl acetate and lead citrate were mounted on a copper grid and photographed under a JEOL 1011 transmission electron microscope using Gatan imaging software (Gatan Inc.). Quantification of glomerular basement membrane (GBM) thickness was performed as previously described 36. The thickness of multiple capillaries was measured in 6–8 glomeruli per mouse (n=3 per group). A mean of 114 measurements was taken per mouse (from podocyte to endothelial cell membrane) at random sites were GBM was displayed in the best cross-section.
Microarray gene expression and gene ontology analysis
Gene expression profiling using Illumina gene expression beadchips were performed at the Mount Sinai Institution Microarray Core Facility. The Illumina MouseWG-6 v2.0 was used to profile gene expression in the glomeruli from all four experimental groups: Wild-type mice, diabetic only mice, Tg26 only mice, and diabetic Tg26 mice. Briefly, the raw data was processed using a Python program in which quantile normalization was performed. Unpaired t-test was used to assess statistical significance between the groups. A list of differentially expressed genes was generated for each group using a cutoff of p<0.05 with the Benjamini-Hochberg correction. Enrichment analysis was performed using the Expression2Kinases software and the Fisher’s exact test was used to determine the terms that were overrepresented among the differentially expressed genes in each of the groups compared to untreated wild-type mice 24.
Isolation of glomeruli from mice for RNA extraction
Mouse glomeruli were isolated as described 37. Briefly, animals were perfused with Hank’s Buffered Salt Solution (HBSS) containing 2.5mg/ml iron oxide and 1% bovine serum albumin. At the end of perfusion, kidneys were removed, decapsulated, minced into 1-mm3 pieces, and digested in HBSS containing 1 mg/ml collagenase A and 100 U/ml deoxyribonuclease I. Digested tissue was then passed through 100 micron cell strainer and collected by centrifugation. The pellet was resuspended in 2 ml of HBSS and glomeruli were collected using a magnet. The purity of glomerular was verified under microscopy. Total RNA was isolated from kidney glomeruli of mice using TRIzol (Invitrogen).
Real-time PCR
Total RNA was extracted by using TRIzol (GIBCO Life Technology). First strand cDNA was prepared from total RNA (1.5ug) using the SuperScript™ III First-Strand Synthesis Kit (Invitrogen) and cDNA (1 ul) was amplified in triplicate using SYBR GreenER qPCR Supermix on an ABI PRISM 7900HT (Applied Biosystems, Foster City, CA, USA). Primers were designed using PrimerBlast (http://www.ncbi.nlm.nih.gov/tools/primer-blast/) and purchased through Sigma (Table 1), with the exception of previously published primers for nef and GAPDH 7, 38. Light cycler analysis software was used to determine crossing points using the second derivative method. Efficiency was calculated for all the designed primers using relative standard curve method. Data was normalized to housekeeping gene (GAPDH) and presented as fold increase compared to RNA isolated from wild-type animals using the Pfaffl method 39.
Measurement of Inflammation-related serum markers
Initially, 200μl of blood was collected from mice at the time of sacrifice. Blood samples were allowed to clot for 2 hours at room temperature before centrifuging for 20minutes at 2000xg. Serum was extracted and quantitative sandwich enzyme immunoassay was performed as per manufacturers’ protocol to quantify serum TNFR1, TNFR2, and IL-6 levels (#MRT10, #MRT20, #M6000B; R&D systems, Minneapolis, MN).
Immunofluorescence
Kidney sections from these mice were prepared in identical fashion. Immunostaining was performed using rabbit anti-collagen IV (Santa Cruz). After washing, sections were incubated with a fluorophore-linked secondary antibody (Alexa Fluor 488 anti-rabbit IgG from Invitrogen). After staining, slides were mounted in Aqua Poly/Mount (Polysciences Inc) and photographed under an AxioVision IIe microscope with a digital camera.
Quantification of Immunofluorescence
After sections were stained with anti-Collagen Type IV antibody, negatives were digitized, and images with a final magnitude of approximately X40 were obtained. ImageJ 1.26t software (National Institute of Health, rsb.info.nih.gov/ij) was used to measure the level of immunostaining in the glomeruli. First, the images were converted to 8-bit grayscale. Next, the glomerular region was selected for measurement of area and integrated density. Then, the background intensity was measured by selecting 3 distinct areas in the background with no staining. The corrected optical density (COD) was determined as the following:
(ID is the integrated density of the selected glomerular region, A is the area of the selected glomerular region, and MGV is the mean gray value of the background readings) 40.
Western Blot
Glomeruli were lysed with a buffer containing 1% Triton, a protease inhibitor cocktail and tyrosine and serine-threonine phosphorylation inhibitors. Lysates were subjected to immunoblot analysis using rabbit anti-phospho Smad3 (Cell Signaling), rabbit anti-total Smad3 (Cell Signaling), and mouse anti-β-actin antibodies (Abcam). Densitometry analysis for quantification was performed as previously described 41.
Statistical Analysis
Data was expressed as mean ± standard error of the mean (X±SEM). The unpaired t-test was used to analyze data between two groups. The ANOVA followed by Bonferroni correction was used when more than two groups were present. All experiments were repeated at least three times, and representative experiments are shown. Statistical significance will be considered when p<0.05.
Supplementary Material
Acknowledgments
We thank Dr A Gharavi for use of the backcrossed Tg26 mice. This work was supported by funds from the NIH/NIDDK (1R01DK078897-01 & 973 fund 2012CB517601 to JH, P01DK056492 to PK and JH, 5K08DK082760 to PYC, and T32 DK07757-12 & 1F32 DK094635-01 to SKM).
Footnotes
DISCLOSURES
All the authors declared no competing interests.
References
- 1.Rao TK, Filippone EJ, Nicastri AD, et al. Associated focal and segmental glomerulosclerosis in the acquired immunodeficiency syndrome. The New England journal of medicine. 1984;310:669–673. doi: 10.1056/NEJM198403153101101. [DOI] [PubMed] [Google Scholar]
- 2.Gardenswartz MH, Lerner CW, Seligson GR, et al. Renal disease in patients with AIDS: a clinicopathologic study. Clinical nephrology. 1984;21:197–204. [PubMed] [Google Scholar]
- 3.Pardo V, Aldana M, Colton RM, et al. Glomerular lesions in the acquired immunodeficiency syndrome. Annals of internal medicine. 1984;101:429–434. doi: 10.7326/0003-4819-101-4-429. [DOI] [PubMed] [Google Scholar]
- 4.Carbone L, D’Agati V, Cheng JT, et al. Course and prognosis of human immunodeficiency virus-associated nephropathy. The American journal of medicine. 1989;87:389–395. doi: 10.1016/s0002-9343(89)80819-8. [DOI] [PubMed] [Google Scholar]
- 5.Cantor KP, Weiss SH, Goedert JJ, et al. HTLV-I/II seroprevalence and HIV/HTLV coinfection among U.S. intravenous drug users. Journal of acquired immune deficiency syndromes. 1991;4:460–467. [PubMed] [Google Scholar]
- 6.Gupta SK, Eustace JA, Winston JA, et al. Guidelines for the management of chronic kidney disease in HIV-infected patients: recommendations of the HIV Medicine Association of the Infectious Diseases Society of America. Clinical infectious diseases: an official publication of the Infectious Diseases Society of America. 2005;40:1559–1585. doi: 10.1086/430257. [DOI] [PubMed] [Google Scholar]
- 7.Mallipattu SK, Wyatt CM, He JC. The New Epidemiology of HIV-related Kidney Disease. Journal of AIDS and Clinical Research. 2012 doi: 10.4172/2155-6113.S4-001. [DOI] [PMC free article] [PubMed] [Google Scholar]
- 8.Berliner AR, Fine DM, Lucas GM, et al. Observations on a cohort of HIV-infected patients undergoing native renal biopsy. American journal of nephrology. 2008;28:478–486. doi: 10.1159/000112851. [DOI] [PubMed] [Google Scholar]
- 9.Ross MJ, Klotman PE, Winston JA. HIV-associated nephropathy: case study and review of the literature. AIDS patient care and STDs. 2000;14:637–645. doi: 10.1089/10872910050206559. [DOI] [PubMed] [Google Scholar]
- 10.Fine DM, Perazella MA, Lucas GM, et al. Kidney biopsy in HIV: beyond HIV-associated nephropathy. American journal of kidney diseases: the official journal of the National Kidney Foundation. 2008;51:504–514. doi: 10.1053/j.ajkd.2007.12.005. [DOI] [PubMed] [Google Scholar]
- 11.Choi AI, Rodriguez RA, Bacchetti P, et al. Racial differences in end-stage renal disease rates in HIV infection versus diabetes. Journal of the American Society of Nephrology: JASN. 2007;18:2968–2974. doi: 10.1681/ASN.2007040402. [DOI] [PubMed] [Google Scholar]
- 12.Medapalli R, Parikh CR, Gordon K, et al. Comorbid diabetes and the risk of progressive chronic kidney disease in HIV-infected adults: Data from the Veterans Aging Cohort Study. Journal of acquired immune deficiency syndromes. 2012 doi: 10.1097/QAI.0b013e31825b70d9. [DOI] [PMC free article] [PubMed] [Google Scholar]
- 13.Dickie P, Felser J, Eckhaus M, et al. HIV-associated nephropathy in transgenic mice expressing HIV-1 genes. Virology. 1991;185:109–119. doi: 10.1016/0042-6822(91)90759-5. [DOI] [PubMed] [Google Scholar]
- 14.Fornoni A, Ijaz A, Tejada T, et al. Role of inflammation in diabetic nephropathy. Current diabetes reviews. 2008;4:10–17. doi: 10.2174/157339908783502361. [DOI] [PubMed] [Google Scholar]
- 15.Martinka S, Bruggeman LA. Persistent NF-kappaB activation in renal epithelial cells in a mouse model of HIV-associated nephropathy. American journal of physiology Renal physiology. 2006;290:F657–665. doi: 10.1152/ajprenal.00208.2005. [DOI] [PMC free article] [PubMed] [Google Scholar]
- 16.Brosius FC, 3rd, Alpers CE, Bottinger EP, et al. Mouse models of diabetic nephropathy. Journal of the American Society of Nephrology: JASN. 2009;20:2503–2512. doi: 10.1681/ASN.2009070721. [DOI] [PMC free article] [PubMed] [Google Scholar]
- 17.Zhong J, Zuo Y, Ma J, et al. Expression of HIV-1 genes in podocytes alone can lead to the full spectrum of HIV-1-associated nephropathy. Kidney international. 2005;68:1048–1060. doi: 10.1111/j.1523-1755.2005.00497.x. [DOI] [PubMed] [Google Scholar]
- 18.Gharavi AG, Ahmad T, Wong RD, et al. Mapping a locus for susceptibility to HIV-1-associated nephropathy to mouse chromosome 3. Proceedings of the National Academy of Sciences of the United States of America. 2004;101:2488–2493. doi: 10.1073/pnas.0308649100. [DOI] [PMC free article] [PubMed] [Google Scholar]
- 19.Susztak K, Bottinger E, Novetsky A, et al. Molecular profiling of diabetic mouse kidney reveals novel genes linked to glomerular disease. Diabetes. 2004;53:784–794. doi: 10.2337/diabetes.53.3.784. [DOI] [PubMed] [Google Scholar]
- 20.Butkowski RJ, Wieslander J, Kleppel M, et al. Basement membrane collagen in the kidney: regional localization of novel chains related to collagen IV. Kidney international. 1989;35:1195–1202. doi: 10.1038/ki.1989.110. [DOI] [PubMed] [Google Scholar]
- 21.He C, Esposito C, Phillips C, et al. Dissociation of glomerular hypertrophy, cell proliferation, and glomerulosclerosis in mouse strains heterozygous for a mutation (Os) which induces a 50% reduction in nephron number. The Journal of clinical investigation. 1996;97:1242–1249. doi: 10.1172/JCI118539. [DOI] [PMC free article] [PubMed] [Google Scholar]
- 22.Yabuki A, Tanaka S, Matsumoto M, et al. Morphometric study of gender differences with regard to age-related changes in the C57BL/6 mouse kidney. Experimental animals/Japanese Association for Laboratory Animal Science. 2006;55:399–404. doi: 10.1538/expanim.55.399. [DOI] [PubMed] [Google Scholar]
- 23.Yang HC, Zuo Y, Fogo AB. Models of chronic kidney disease. Drug discovery today Disease models. 2010;7:13–19. doi: 10.1016/j.ddmod.2010.08.002. [DOI] [PMC free article] [PubMed] [Google Scholar]
- 24.Chen EY, Xu H, Gordonov S, et al. Expression2Kinases: mRNA profiling linked to multiple upstream regulatory layers. Bioinformatics. 2012;28:105–111. doi: 10.1093/bioinformatics/btr625. [DOI] [PMC free article] [PubMed] [Google Scholar]
- 25.Deeks SG. HIV infection, inflammation, immunosenescence, and aging. Annual review of medicine. 2011;62:141–155. doi: 10.1146/annurev-med-042909-093756. [DOI] [PMC free article] [PubMed] [Google Scholar]
- 26.Robertson KR, Smurzynski M, Parsons TD, et al. The prevalence and incidence of neurocognitive impairment in the HAART era. AIDS. 2007;21:1915–1921. doi: 10.1097/QAD.0b013e32828e4e27. [DOI] [PubMed] [Google Scholar]
- 27.Shikano M, Sobajima H, Yoshikawa H, et al. Usefulness of a highly sensitive urinary and serum IL-6 assay in patients with diabetic nephropathy. Nephron. 2000;85:81–85. doi: 10.1159/000045634. [DOI] [PubMed] [Google Scholar]
- 28.Niewczas MA, Gohda T, Skupien J, et al. Circulating TNF receptors 1 and 2 predict ESRD in type 2 diabetes. Journal of the American Society of Nephrology: JASN. 2012;23:507–515. doi: 10.1681/ASN.2011060627. [DOI] [PMC free article] [PubMed] [Google Scholar]
- 29.Bruggeman LA, Dikman S, Meng C, et al. Nephropathy in human immunodeficiency virus-1 transgenic mice is due to renal transgene expression. The Journal of clinical investigation. 1997;100:84–92. doi: 10.1172/JCI119525. [DOI] [PMC free article] [PubMed] [Google Scholar]
- 30.Feng X, Lu TC, Chuang PY, et al. Reduction of Stat3 activity attenuates HIV-induced kidney injury. Journal of the American Society of Nephrology: JASN. 2009;20:2138–2146. doi: 10.1681/ASN.2008080879. [DOI] [PMC free article] [PubMed] [Google Scholar]
- 31.Wu KK, Huan Y. Streptozotocin-induced diabetic models in mice and rats. Curr Protoc Pharmacol. 2008;Chapter 5(Unit 5–47) doi: 10.1002/0471141755.ph0547s40. [DOI] [PubMed] [Google Scholar]
- 32.Sanden SK, Wiggins JE, Goyal M, et al. Evaluation of a thick and thin section method for estimation of podocyte number, glomerular volume, and glomerular volume per podocyte in rat kidney with Wilms’ tumor-1 protein used as a podocyte nuclear marker. Journal of the American Society of Nephrology: JASN. 2003;14:2484–2493. doi: 10.1097/01.asn.0000089829.45296.7c. [DOI] [PubMed] [Google Scholar]
- 33.Awazu M, Omori S, Ishikura K, et al. The lack of cyclin kinase inhibitor p27(Kip1) ameliorates progression of diabetic nephropathy. Journal of the American Society of Nephrology: JASN. 2003;14:699–708. doi: 10.1097/01.asn.0000051726.41601.c0. [DOI] [PubMed] [Google Scholar]
- 34.Schiffer M, Mundel P, Shaw AS, et al. A novel role for the adaptor molecule CD2-associated protein in transforming growth factor-beta-induced apoptosis. The Journal of biological chemistry. 2004;279:37004–37012. doi: 10.1074/jbc.M403534200. [DOI] [PubMed] [Google Scholar]
- 35.Koop K, Eikmans M, Baelde HJ, et al. Expression of podocyte-associated molecules in acquired human kidney diseases. Journal of the American Society of Nephrology: JASN. 2003;14:2063–2071. doi: 10.1097/01.asn.0000078803.53165.c9. [DOI] [PubMed] [Google Scholar]
- 36.Reiniger N, Lau K, McCalla D, et al. Deletion of the receptor for advanced glycation end products reduces glomerulosclerosis and preserves renal function in the diabetic OVE26 mouse. Diabetes. 2010;59:2043–2054. doi: 10.2337/db09-1766. [DOI] [PMC free article] [PubMed] [Google Scholar]
- 37.Takemoto M, Asker N, Gerhardt H, et al. A new method for large scale isolation of kidney glomeruli from mice. The American journal of pathology. 2002;161:799–805. doi: 10.1016/S0002-9440(10)64239-3. [DOI] [PMC free article] [PubMed] [Google Scholar]
- 38.Zuo Y, Matsusaka T, Zhong J, et al. HIV-1 genes vpr and nef synergistically damage podocytes, leading to glomerulosclerosis. Journal of the American Society of Nephrology: JASN. 2006;17:2832–2843. doi: 10.1681/ASN.2005080878. [DOI] [PubMed] [Google Scholar]
- 39.Pfaffl MW. A new mathematical model for relative quantification in real-time RT-PCR. Nucleic Acids Res. 2001;29:e45. doi: 10.1093/nar/29.9.e45. [DOI] [PMC free article] [PubMed] [Google Scholar]
- 40.Potapova TA, Sivakumar S, Flynn JN, et al. Mitotic progression becomes irreversible in prometaphase and collapses when Wee1 and Cdc25 are inhibited. Mol Biol Cell. 2011;22:1191–1206. doi: 10.1091/mbc.E10-07-0599. [DOI] [PMC free article] [PubMed] [Google Scholar]
- 41.Gassmann M, Grenacher B, Rohde B, et al. Quantifying Western blots: pitfalls of densitometry. Electrophoresis. 2009;30:1845–1855. doi: 10.1002/elps.200800720. [DOI] [PubMed] [Google Scholar]
Associated Data
This section collects any data citations, data availability statements, or supplementary materials included in this article.