Abstract
Previous studies of intracortical connections in mouse visual cortex have revealed two subnetworks that resemble the dorsal and ventral streams in primates. Although calcium imaging studies have shown that many areas of the ventral stream have high spatial acuity whereas areas of the dorsal stream are highly sensitive for transient visual stimuli, there are some functional inconsistencies that challenge a simple grouping into ‘what/perception’ and ‘where/action’ streams known in primates. The superior colliculus (SC) is a major center for processing of multimodal sensory information and the motor control of orienting the eyes, head and body. Visual processing is performed in superficial layers, whereas premotor activity is generated in deep layers of the SC. As the SC is known to receive input from visual cortex, we asked whether the projections from 10 visual areas of the dorsal and ventral streams terminate in differential depth profiles within the SC. We found that inputs from primary visual cortex (V1) are by far the strongest. Projections from the ventral stream were substantially weaker, whereas the sparsest input originated from areas of the dorsal stream. Importantly, we found that ventral stream inputs terminated in superficial layers, whereas dorsal stream inputs tended to be patchy and either projected equally to superficial and deep layers or strongly preferred deep layers. The results suggest that the anatomically defined ventral and dorsal streams contain areas which belong to distinct functional systems, specialized for the processing of visual information and visually guided action, respectively.
Keywords: Mice, extrastriate visual cortex, corticotectal projections
INTRODUCTION
Mice have an elaborate visual cortex in which the visual field is represented in multiple areas (Wang and Burkhalter, 2007). Optical recordings of calcium transients have shown that many of these areas are specialized for the processing of different spatiotemporal features of visual input (Andermann et al., 2011; Marshel et al., 2011). Network analyses of the connections of 10 visual areas have further revealed that areas are linked within interconnected streams (Wang et al., 2012). In the dorsal stream, outputs from medial/anterior extrastriate areas are strongly connected to parietal, motor and prelimbic cortex, whereas in the ventral stream outputs from lateral extrastriate cortex are preferentially connected to temporal cortex. Although these groupings resemble the dorsal, ‘where/action’, and ventral, ‘what/perception’, streams in primates (Ungerleider and Mishkin, 1982; Goodale and Milner, 1992), functional characterization of mouse extrastriate areas showed that responses not always segregate as expected from the network in primates (Andermann et al., 2011; Marshel et al., 2011; Wang et al., 2012). To provide further insight into stream-related characteristics, we studied the input from different cortical areas to the SC, which in monkey has stream-specific features (Abel et al., 1997). To assess the associations with streams we determined the inputs to superficial and deep layers, which are specialized for visual processing and sensory-motor transformations, respectively (May, 2006; Gandhi and Katnani, 2011).
In mice, retinal input to the contralateral SC terminates in the superficial layers, which includes the zona layer (Zo), the superficial gray (SuG) and the optic nerve layer (Op) (Godement et al., 1984; Kim et al., 2008; Huberman et al., 2009; Kay et al., 2011). Neurons in superficial layers are retinotopically organized and are tuned to direction, orientation, spatial and temporal frequency (Dräger and Hubel, 1975; Wang et al., 2010). SuG is further subdivided into an upper tier which receives input from direction selective on-off retinal ganglion cells (Huberman et al., 2009; Kay et al., 2011; Rivlin-Etzion et al., 2011) and a lower tier which receives input from large α/Y-like retinal ganglion cells (Hofbauer and Dräger, 1985; Hubermann et al., 2008; Kim et al., 2010). The more ventral intermediate gray (InG) and white (InWh) layers, receive inputs from the trigeminal nucleus (Huerta et al., 1983) and the inferior colliculus (Garcia el Caño et al., 2006). Neurons at these locations respond to somatosensory and auditory stimuli (Dräger and Hubel, 1976) and electrical stimulation produces ear and whisker movements (McHaffie and Stein, 1982; Hemelt and Keller, 2008). Outputs from these layers terminate in the thalamus, pretectum, brain stem and spinal cord (Mays, 2006) where they elicit premotor activity for eye movements and goal-directed movements (Sahibzada et al., 1986; Felsen and Mainen, 2008; Sakatani and Isa, 2008).
In rats, corticotectal inputs from different areas terminate in different layers of the SC (Harvey and Worthington, 1990; Coogan and Burkhalter, 1993). However, the depth profile of projections from distinct visual areas is not completely understood. Here, we show that laminar inputs to the SC are area-specific and support the existence of ventral and dorsal streams.
MATERIALS AND METHODS
Experiments were performed in 2–3 month old C57BL/6J mice of either sex. All procedures were approved by the Washington University Animal Studies Committee and agreed with NIH guidelines.
Tracer Injections
The procedure for tracer injection in mice has been described in detail by Wang et al., (2012). In brief, mice were anesthetized (86 mg/kg ketamine/13 mg/kg xylazine, i.p.) and secured in a stereotaxic apparatus. To label the corticotectal connections we used the predominantly anterograde tracer, biotinylated dextran amine (BDA; 10,000 molecular weight, 5% in H2O, Invitrogen). BDA was injected iontophoretically (3 μA, 7 s on /7 s off duty cycle, 10 min) through glass pipettes (15 μm tip diameter), 350 μm below the pial surface at different locations of the left visual cortex. The injection coordinates for different areas were measured from the midline and from the anterior margin of transverse sinus (lateral/ anterior in mm): primary visual cortex (V1, 2.8/1.1), lateromedial area (LM, 4.1/1.4), anterolateral area (AL, 3.7/2.4), posterior area (P, (4.2/1.0), laterointermediate area (LI, 4.2/1.45), postrhinal area (POR, 4.3/1.15), rostrolateral area (RL, 3.3/2.8), anterior area (A, 4.2/3.4), anteromedial area (AM, 1.7/3.0), posteromedial area (PM, 1.6/1.9). For post hoc identification of cortical areas we labeled callosal landmarks. The retrograde tracer, bisbenzimide (5% in H2O, Sigma) was pressure-injected (Picospritzer, III, Parker-Hannafin) through glass pipettes (20 μm tip diameter) at 30–40 sites (20–50 nl each) distributed across the right posterior cortical hemisphere. After the injections the bone flap was replaced, the wound was closed and mice were returned to a heated recovery chamber.
Histology and Imaging
Three to four days after surgery, mice were overdosed with ketamine/xylazine and perfused transcardially with phosphate buffered saline (pH 7.4), followed by 4% paraformaldehyde in 0.1 M phosphate buffer (PB, pH 7.4). The brain was removed from the skull, postfixed overnight (4°C) in the same fixative followed by cryoprotection in 30% sucrose. The next day, the hemisphere containing the bisbenzimide-labeled callosal connections and the BDA injection was imaged in situ with a CCD camera (CoolSnap EZ, Roper Scientific) attached to a fluorescence stereomicroscope (Leica MZ16F) equipped for UV fluorescence. The hemisphere was then sectioned on a cryostat at 50 μm in the coronal plane. Serial sections were wet mounted on glass slides and the callosal connections, including the BDA injection site, were imaged with a CCD camera (Optronics MagnaFire, Goleta, CA) attached to a compound microscope (Nikon Eclipse 80i) equipped for UV fluorescence. To determine the rostrocaudal location of each coronal section and its relation to the pattern of callosal connections, the sequence of slices was mapped onto the in situ image of the hemisphere. The injection site was assigned to a specific area by its location relative to callosal landmarks (Wang and Burkhalter, 2007). In addition, each section was imaged under darkfield illumination to reveal the myeloarchitecture of V1. The sections were then removed from the slides, treated with 0.3% Triton X-100 in PB and reacted in a solution containing avidin and biotinylated HRP (Vectastain ABC Elite) in the presence of diaminobenzidine (DAB; 0.005%) and H2O2 (0.01%). Stained sections were mounted on glass slides, dehydrated in ethanol, cleared in xylenes and the DAB reaction product was intensified with AgNO3 and HAuCl2 (Jiang et al., 1993). Sections were coverslipped with DPX (BDH Laboratory Supplies, Poole, United Kingdom). Digital images of anterogradely BDA labeled neuronal connections to the SC were taken under a microscope equipped with a CCD camera. Montages of darkfield images were produced using Photoshop CS5 (Adobe). To visualize the layers of the SC, alternate sections were counterstained with 0.5% cresyl violet. In a separate case, the Nissl stained lamination pattern of the SC was compared with the myeloarchitectonic pattern, using alternating sections stained with cresyl violet and AgNO3 for myelin (Gallyas, 1979). The dimensions of projections were expressed as mean ± SEM.
Optical density measurements
To determine the size of the injection site we used custom Matlab software to delineate the region that contained 80% of the optical density. The weight of corticotectal input was measured as the optical density of BDA labeled projections, which we have shown previously to be tightly correlated with bouton density (Wang et al., 2011). Using custom Matlab software, we determined the optical density in each layer by averaging across 3–4 sections through the center of the projection and subtracting the mean pixel value from the background. Sublaminae of the superficial gray layer (SuG) were defined as the upper and lower halves of the layer. The same procedure was used to determine the optical density at the injection site. The weight of projections from a given area across 2–4 mice was expressed as mean ± SEM percent of the optical density at the injection site. The relative weight of input to specific layers was expressed in percent of the total corticotectal input. The student’s t-test was used for statistical comparisons. Significance was P < 0.05.
RESULTS
We obtained results from 26 mice. The mean diameters of the BDA injection sites were similar in all areas and varied between 424 ± 55 and 493 ± 33 μm (mean ± SD). In all cases injections were confined to gray matter and extended from layer 1 to the middle of layer 6 (Fig 1, 3–11).
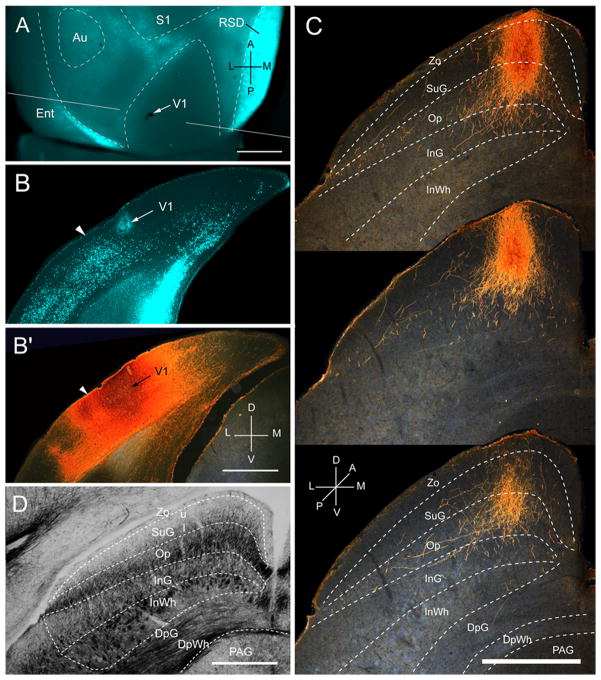
Figure 1.
Projections of primary visual cortex (V1) to the SC. A, In situ image of callosal connections retrogradely labeled with the fluorescent tracer, bisbenzimide (blue). BDA injection site is indicated by arrow. White lines indicate the rostrocaudal level of the coronal sections shown in B and B′. B, Coronal section showing bisbenzimide-labeled callosal connections and injection site (arrow) in acallosal V1 near the callosally connected band at the V1/LM border (arrowhead). B′, Darkfield image of injection site in section adjacent to B, showing that BDA is confined to gray matter. C, Darkfield images of BDA labeled terminal axonal branches in superficial layers of the SC at anterior (top), middle and posterior (bottom) levels of the projeciton. Superficial layers consist of the zona layer (Zo), the superficial gray layer (SuG) and the optic nerve layer (Op). Deep layers consist of the ventral intermediate gray layer (InG), the intermediate white layer (InWh), the deep gray layer (DpG), deep white layer (DpWh) and the periaqueductal gray (PAG). D, Myeloarchitecture of the SC. Abbreviations in A, B: S1 (primary somatosensory cortex), Au (auditory cortex), RSD (dorsal retrosplenial cortex), Ent (entorhinal cortex). Compass in A, B′ and C: anterior (A), medial (M), posterior (P), lateral (L), dorsal (D), ventral (V). Scale bar: 1mm (A, B, B′, D), 0.5mm (C).
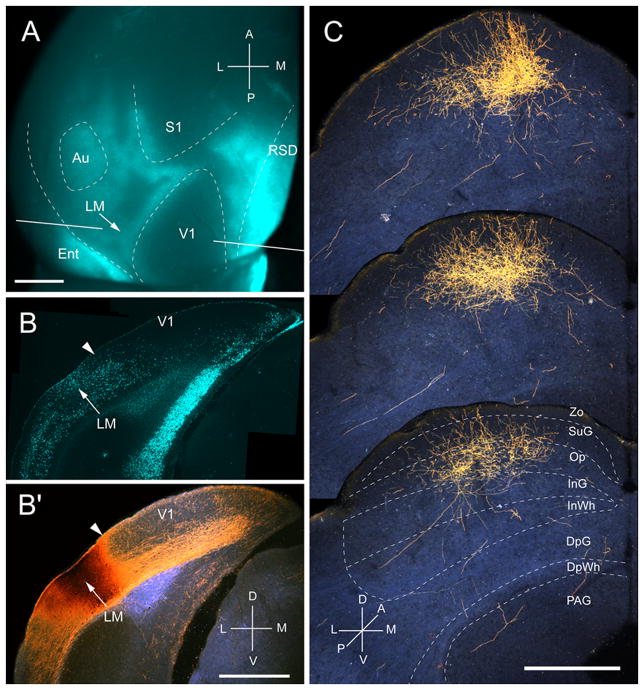
Figure 3.
Projections of lateromedial area (LM) to the SC. A, In situ image of callosal connections retrogradely labeled with the fluorescent tracer, bisbenzimide (blue). BDA injection site (arrow) at posterior/medial border of acallosal zone lateral to V1. White lines indicate the rostrocaudal level of the coronal sections shown in B and B′. B, Coronal section showing bisbenzimide-labeled callosal connections and injection site (arrow) on the lateral side of the callosal band near the V1/LM border (arrowhead). B′, Darkfield image of section adjacent to B, showing that BDA injection site is confined to gray matter. C, Darkfield images of BDA labeled axonal branches terminating mainly in superficial layers Zo, SuG and Op. Scale bar: 1mm (A, B, B′), 0.5mm (C). For abbreviations, see Fig. 1.
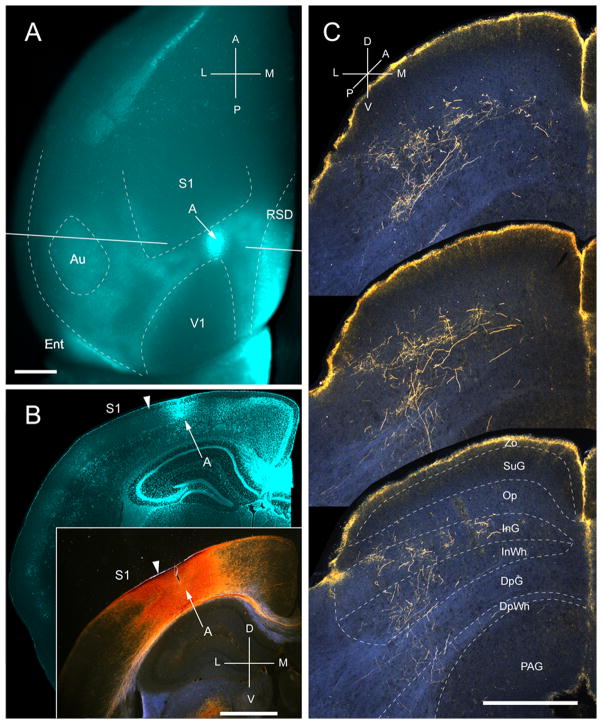
Figure 11.
Projections of anterior area (A) to the SC. A, In situ image of callosal connections retrogradely labeled with the fluorescent tracer, bisbenzimide (blue). BDA injection site (arrow) in acallosal cortex (blue staining due to tissue damage) rostral to the anterior tip of V1. White lines indicate the rostrocaudal level of the coronal sections shown in B and B′. B, Coronal section showing bisbenzimide-labeled callosal connections and injection site (arrow) in acallosal cortex between the tip of V1 and the posterior border of S1. Arrowhead marks the A/S1 border. B′, Darkfield image of section adjacent to B, showing that BDA injection is confined to gray matter. C, Darkfield images of BDA labeled axonal branches terminating in deep layers of the SC. Notice, that the yellow rim at the pial surface represents artifactual luminescence unrelated to axonal labeling. Scale bar: 1mm (A, B, B′), 0.5mm (C). For abbreviations, see Fig. 1.
Input from V1
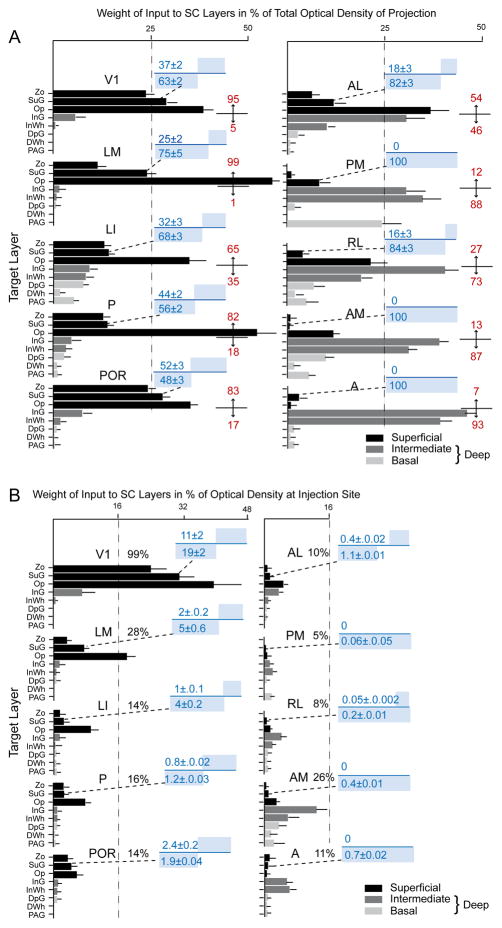
Three injections were found in the heavily myelinated, acallosal region identified as V1 (Fig. 1A, B; Wang et al., 2012). Each injection labeled a single dense cluster of axon terminals in the upper nasal representation of the ipsilateral SC (Fig. 1C; Mrsic-Flogel et al., 2005). The projections at these sites were twice as extensive in the rostrocaudal as the mediolateral axes (563 ± 9 vs 280 ± 11 μm). Optical density measurements showed that 95% of corticotectal inputs were confined to superficial layers (Zo, SuG, Op) whereas less than 5% of boutons were found in the deep, intermediate gray (InG) and intermediate white (InWh) layers (Fig. 2A). Of all layers, the optic nerve layer (Op) received the largest proportion (Fig. 2A) and heaviest V1 input (Fig. 2B). A significantly (P < 0.03) larger percentage of inputs to SuG terminated in lower (63 ± 2%) than the upper (37 ± 2) half of the layer (Fig. 2A). The sum of optical densities across layers was roughly equal (99%) to the total optical density measured at the injection site (Fig. 2B).
Figure 2.
Laminar distribution of the weight of projections of 10 visual cortical areas to the superior colliculus (SC). A, Mean ± SEM optical density of inputs from areas V1, LM, LI, P, POR, AL, PM, RL, AM and A to different layers of the SC, expressed in percent of the total projection. Superficial layers (black). Deep layers consist of intermediate InG, InWh (dark gray) and the basal DpG, DWh and PAG layers (light gray). Red numbers indicate percent of projections to superficial (top) and intermediate + basal (bottom) layers. Blue numbers indicate the percentage of inputs to superficial (top) and deep (bottom) sublaminae of the superficial gray layer (SuG). The blue bars above and blow the blue line represent the proportions of inputs to the two sublaminae. B, Mean ± SEM optical density of inputs from visual cortical areas to different SC layers, expressed in percent of the optical density at the center of the injection site. Black numbers indicate the sum total of the relative optical densities across layers. Blue numbers and bars above and below the blue line indicate the absolute strengths of inputs to superficial and deep sublaminae of SuG. For abbreviations, see Fig. 1.
Input from LM
Four injections were found in LM located in the acallosal region lateral to V1 (Wang and Burkhalter, 2007). In the example shown in Fig. 3A and B, the injection was near the callosal band at the posterior border of LM, which represents the upper peripheral visual field (Wang and Burkhalter, 2007). The corticotectal projection terminated in a single, non-uniform cluster in the center of the posterior ipsilateral SC (Fig. 3C). The mean size of projections from LM was more extensive (medio-lateral: 362 ± 11 μm, antero-posterior: 967 ± 15 μm) than from V1, owing to the fact that similar size injections fill a larger proportion of the smaller area, LM. 99% of labeled terminals were found in superficial layers, of which Op received the dominant (59%) input (Fig. 2A, 3C). Of the total input from LM, projections to Zo were significantly (P < 0.01) weaker than from V1, whereas inputs to Op were significantly (P < 0.01) stronger (Fig. 2A). Most of the inputs to SuG terminated in the lower tier (75%), whereas input to the upper tier was significantly (P < 0.01) sparser (25%) (Fig. 2A). The overall weight of corticotectal input from LM was 28% of the optical density measured at the injection site (Fig. 2B).
Input from LI
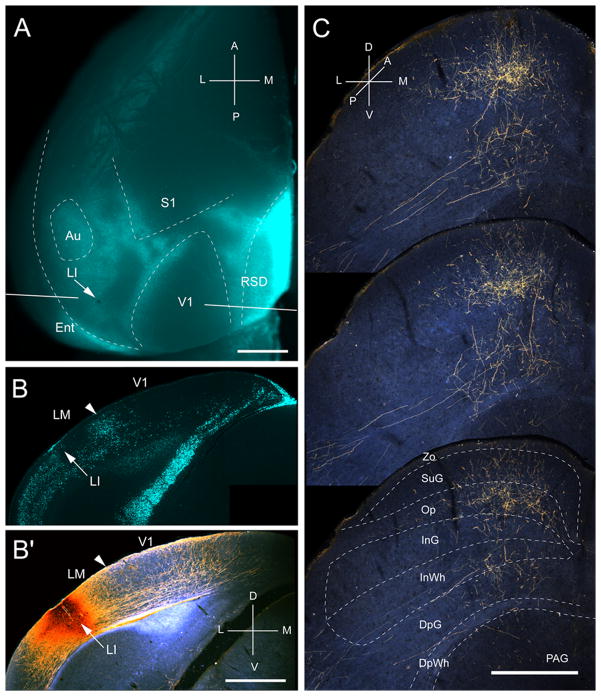
Three injections were found in LI (Wang and Burkhalter, 2007), located at the callosally connected lateral border of the large acallosal region adjacent to V1 (Fig. 4A, B). All of the injections labeled projections in the upper temporal visual field representation in the posteromedial quadrant of the SC (Fig. 4C). The corticotectal projection was relatively wide and highly elongated (medio-lateral: 472 ± 10 μm, antero-posterior: 1150 ± 13 μm), indicating that the injection site was large relative to the size of LI. Of the overall ipsilateral projection, 65% terminated in superficial layers, of which Op received twice (35.5%) as much input as Zo and SuG combined (Fig. 2A). The lower half of SuG received a significantly (P < 0.02) larger (68%) proportion of input than superficial half (32%) (Fig. 2A). Unlike V1 and LM, which essentially lack deep layer inputs, 35% of LI’s projections terminated in deep layers (Fig. 2A). The weight of the entire ipsilateral corticotectal projection was low (16%) (Fig. 2B). Interestingly, a few corticotectal fibers crossed the midline and terminated in the contralateral Op. How common crossed inputs are, we were unable to determine because in most cases we only preserved the ipsilateral SC. However, from the material posted by the Allen Institute, it appears that weak bilateral corticotectal connections are present throughout large parts of mouse visual cortex, including V1.
Figure 4.
Projections of laterointermediate area (LI) to the SC. A, In situ image of callosal connections retrogradely labeled with the fluorescent tracer, bisbenzimide (blue). BDA injection site (arrow) at posterior/lateral border of acallosal zone lateral to V1. White lines indicate the rostrocaudal level of the coronal sections shown in B and B′. B, Coronal section showing bisbenzimide-labeled callosal connections and injection site (arrow) at the lateral border of the large acallosal zone adjacent to V1. B′, Arrowhead marks V1/LM border. Darkfield image of section adjacent to B showing that BDA injection site is confined to gray matter. C, Darkfield images of BDA labeled axonal branches terminating mainly in superficial layers. Inputs to deep layers are sparse. Scale bar: 1mm (A, B, B′), 0.5mm (C). For abbreviations, see Fig. 1.
Input from P
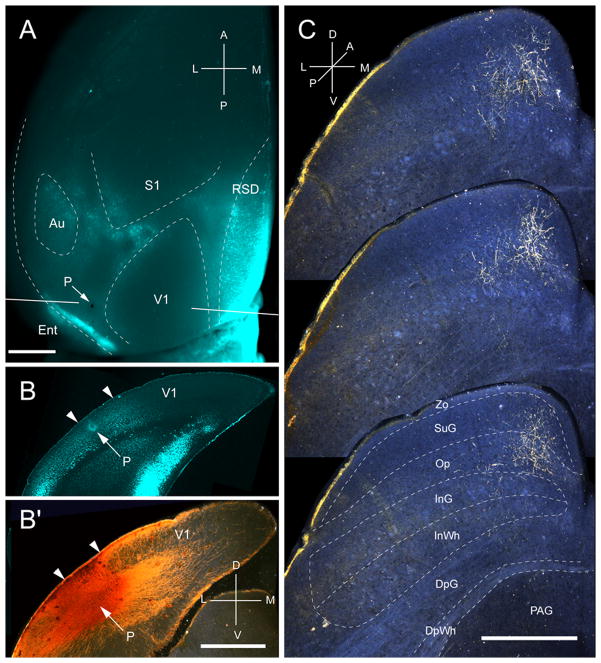
Two injections were made in area P, located in the most posterior acallosal ring lateral to V1 (Fig. 5A, B). Both injections labeled a single patch (medio-lateral: 259 ± 11μm; antero-posterior: 875 ± 26μm) at the medial corner in the posterior SC (Fig. 5C). 82% of the corticotectal input terminated in superficial layers, of which Op was the main (54%) recipient (Fig. 2A). Of the weak input to SuG, roughly equal proportions terminated in the superficial (44%) and deep halves of the layer (56%) (Fig. 2A, B). A small fraction of corticotectal projections was bilateral and terminated in the contralateral Op. The weight of the ipsilateral superficial layer input was less than 8%, and inputs to deep layers were barely detectable (Fig. 2B).
Figure 5.
Projections of posterior area (P) to the SC. A, In situ image of callosal connections retrogradely labeled with the fluorescent tracer, bisbenzimide (blue). BDA injection site (arrow) in small acallosal region behind the large acallosal zone on the lateral side of V1. Blue staining at injection site is due to tissue damage. White lines indicate the rostrocaudal level of the coronal sections shown in B and B′. B, Coronal section showing bisbenzimide-labeled callosal connections and injections site (arrow) in acallosal zone between the V1/P (left arrowhead) and P/POR (right arrowhead) borders. B′, Darkfield image of section adjacent to B, showing that BDA injection site is confined to gray matter. C, Darkfield images of BDA labeled axonal branches terminating mainly in the superficial layer, Op. Scale bar: 1mm (A, B, B′), 0.5mm (C). For abbreviations, see Fig. 1.
Input from POR
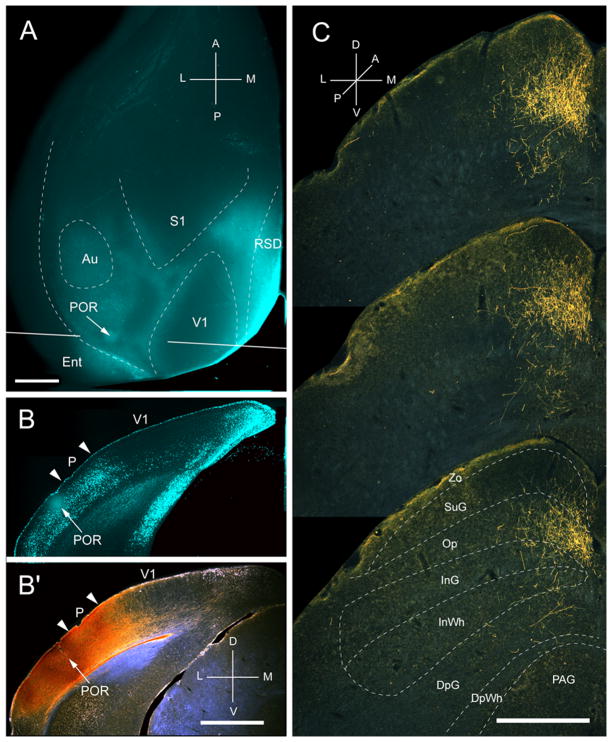
Two injections were made into the parahippocampal area, POR, located in callosally connected cortex posterior and lateral to the large acallosal ring on the lateral side of V1 (Fig. 6A, B). Both injections labeled a single cluster (medio-lateral: 378 ± 11μm; antero-posterior: 825 ± 16μm) of inputs in the upper nasal field representation in the posterior-medial part of the ipsilateral SC (Fig. 6C). 83% of the corticotectal inputs projected to superficial layers (Fig. 2A) of which 34% terminated in Op. Projections to SuG were sparse and distributed equally to upper and lower sublaminae (Fig. 2A, B). Inputs to deep layers were extremely weak (Fig. 2A), and so was the overall weight (14%) of the entire corticotectal projection (Fig. 2B).
Figure 6.
Projections of postrhinal area (POR) to the SC. A, In situ image of callosal connections retrogradely labeled with the fluorescent tracer, bisbenzimide (blue). BDA injection site (arrow) in callosally connected cortex lateral to the acallosal field containing area P. White lines indicate the rostrocaudal level of the coronal sections shown in B and B′. B, Coronal section showing bisbenzimide-labeled callosal connections and injection site (arrow) in callosally connected cortex lateral to the P/POR border (left arrowhead). Right arrowhead marks V1/P border. B′, Darkfield image of section adjacent to B, showing that BDA injection site (arrow) is confined to gray matter. C, Darkfield images of BDA labeled axonal branches terminating mainly in the superficial layer, Op. Scale bar: 1mm (A, B, B′), 0.5mm (C). For abbreviations, see Fig. 1.
Input from AL
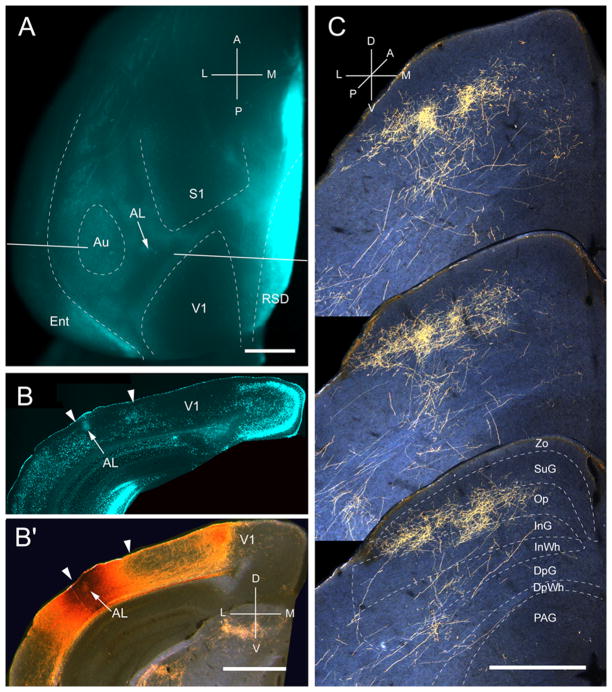
Three injections were found in area AL, located in the anterior third of the acallosal region lateral to V1 (Fig. 7A, B). All injections were located at the lateral border of the acallosal region in the representation of the lower temporal visual field (Wang and Burkhalter, 2007). Accordingly, the corticotectal projections occupied central and lateral parts of the ipsilateral SC (Fig. 7C). In sharp contrast to projections from V1, LM, P, LI and POR, inputs from AL terminated in repeating clusters with a center-to-center spacing in the coronal plane of ~200 μm (Fig. 7C). The mean width and length of the overall projection was 650 ± 12 μm and 926 ± 6 μm, respectively. Unlike the projections from V1 LM, LI, P and POR, which were strongly biased to superficial layers, inputs from AL were distributed in roughly equal percentages to superficial (54%) and deep (46%) layers (Fig. 2A). The largest percentage of superficial input terminated in Op (39%), whereas deep layer input projected mostly (32%) to InG. Input to SuG terminated mostly in the lower sublamina (82%) and differed significantly (p< 0.001) from the much sparser (18%) projection to the superficial tier (Fig. 2A). The overall weight (9.8%) of the corticotectal projection was low (Fig. 2B). Crossed projections were extremely weak.
Figure 7.
Projections of anterolateral area (AL) to the SC. A, In situ image of callosal connections retrogradely labeled with the fluorescent tracer, bisbenzimide (blue). BDA injection site (arrow) in the anterior/lateral border of the large acallosal zone lateral to V1. Blue staining at the injection site is due to tissue damage. White lines indicate the rostrocaudal level of the coronal sections shown in B and B′. B, Coronal section showing bisbenzimide-labeled callosal connections and injection site (arrow) in anterior part of acallosal zone. Right arrowhead marks V1/AL border, left arrowhead indicates lateral border of acallosal zone. B′, Darkfield image of section adjacent to B, showing that BDA injection is confined to gray matter. C, Darkfield images of BDA labeled patchy axonal branches terminating mainly in superficial layer (Op) and deep layer (InG). Scale bar: 1mm (A, B, B′), 0.5mm (C). For abbreviations, see Fig. 1.
Input from PM
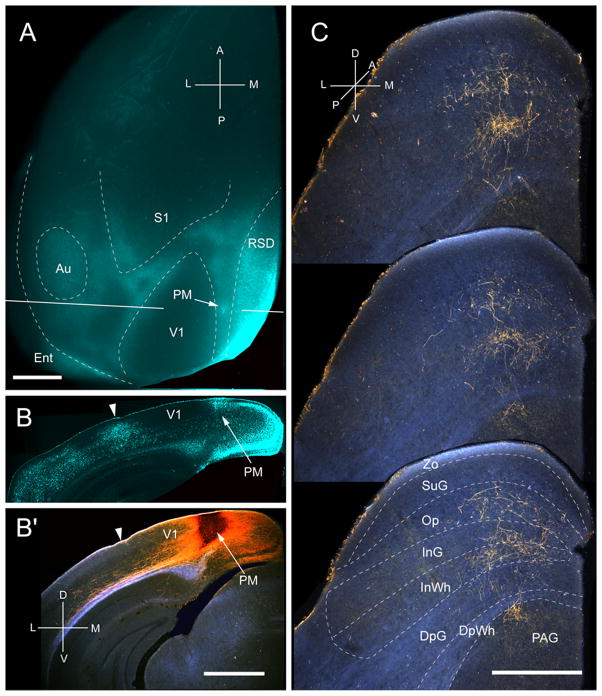
Three injections were found in PM, located at the medial edge of the acallosal region at the medial side of V1 (Fig. 8A, B). All of the injections were centered in posterior PM and labeled projections in the upper temporal representation in the posterior medial quadrant of the SC (Fig. 8C). The projections were weak and dispersed across a relatively wide region (medio-lateral: 418 ± 7 μm; antero-posterior: 700 ± 8 μm) of the SC. 88% of the corticotectal projection terminated in deep layers, with large contributions to the intermediate layers (64%) and the PAG (21%) (Fig. 2A). All inputs to SuG terminated in the deep portion of the layer (Fig. 2A). The overall weight (5 %) of the corticotectal projection was very light (Fig. 2B)
Figure 8.
Projections of posteromedial area (PM) to the SC. A, In situ image of callosal connections retrogradely labeled with the fluorescent tracer, bisbenzimide (blue). BDA injection site (arrow) in callosally connected cortex medial to V1. White lines indicate the rostrocaudal level of the coronal sections shown in B and B′. B, Coronal section showing bisbenzimide-labeled callosal connections and injection site (arrow) in callosally connected cortex medial to V1. Arrowhead marks V1/AL border. B′, Darkfield image of section adjacent to B, showing that BDA injection is confined to gray matter. C, Darkfield images of BDA labeled axonal branches terminating in deep layers of the SC. Scale bar: 1mm (A, B, B′), 0.5mm (C). For abbreviations, see Fig. 1.
Input from RL
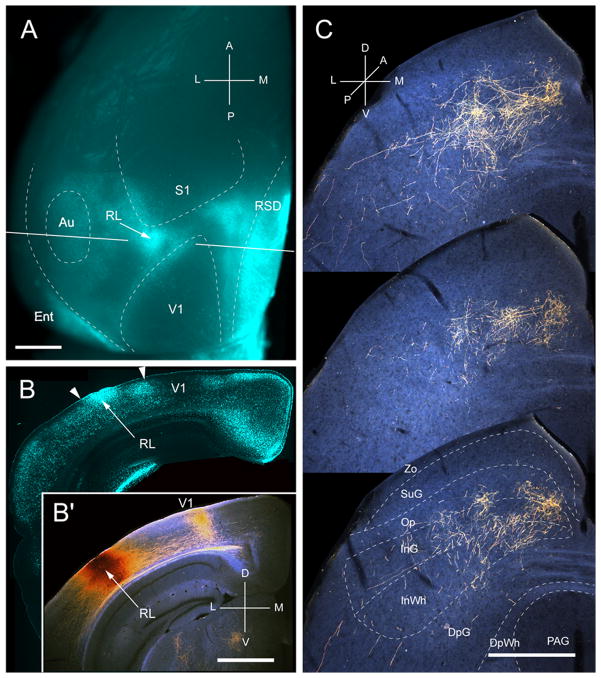
Three injections were found in area RL, located in the small acallosal ring lateral to the tip of V1 (Fig. 9A, B). In each case the corticotectal projection was targeted to slightly different locations, supporting the topographic map within RL (Wang and Burkhalter, 2007). The example illustrated in Fig. 9C shows inputs from the upper peripheral quadrant. Similar to the corticotectal inputs from AL, the projections from RL were nonuniform and widespread (medio-lateral: 581 ± 4 μm; antero-posterior: 933 ± 5 μm). In contrast to the projections from areas of lateral-posterior extrastriate cortex, 73% of the input from RL terminated in deep layers, predominantly in InG (44%) (Fig. 2A). Input to SuG accounted for merely 0.25% of the total projection (Fig. 2B). Of the few fibers found in SuG, 84% terminated in the lower sublamina (Fig. 2A). The overall weight (8%) of corticotectal input was light (Fig. 2B).
Figure 9.
Projections of rostrolateral area (RL) to the SC. A, In situ image of callosal connections retrogradely labeled with the fluorescent tracer, bisbenzimide (blue). BDA injection site (arrow) in the small callosal ring on the lateral side of V1. White lines indicate the rostrocaudal level of the coronal sections shown in B and B′. B, Coronal section showing bisbenzimide-labeled callosal connections and injection site (arrow). Right arrowhead marks V1/RL border. Left arrowhead indicates RL/AL border. B′, Darkfield image of section adjacent to B, showing that BDA injection is confined to gray matter. C, Darkfield images of BDA labeled axonal branches terminating in deep layers of the SC. Scale bar: 1mm (A, B, B′), 0.5mm (C). For abbreviations, see Fig. 1.
Input from AM
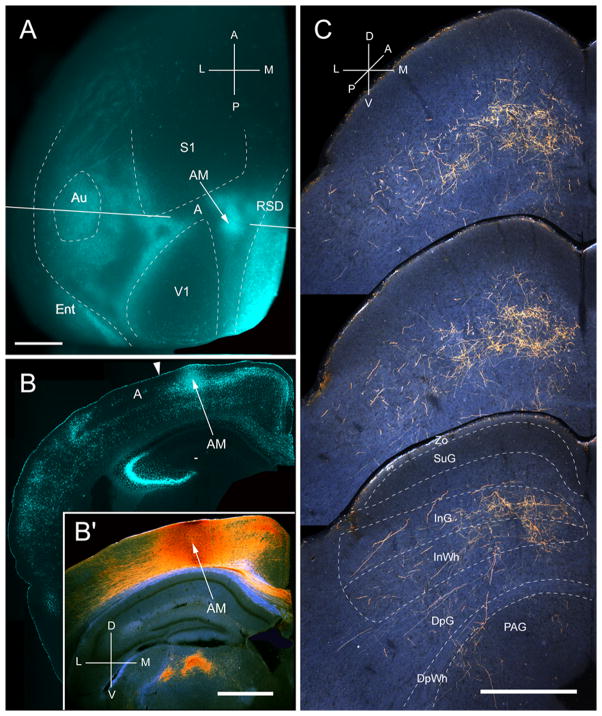
Two injections were found in AM, located at the border of callosally connected cortex medial to the tip of V1 (Fig. 10A, B). Both injections labeled corticotectal projections across large parts of the upper temporal and nasal quadrants of the ipsilateral SC (Fig. 10C). The widely dispersed projections (medio-lateral: 676 ± 8 μm; antero-posterior: 950 ± 8 μm) were nonuniform and 87% terminated in deep layers (Fig. 2A). 71% of the input was found in intermediate layers (Fig. 2A). Input to SuG was extremely sparse and confined to the lower tier of the layer (Fig. 2A). The overall weight (26%) of input from AM was comparable to that of LM (Fig. 2B).
Figure 10.
Projections of anteromedial area (AM) to the SC. A, In situ image of callosal connections retrogradely labeled with the fluorescent tracer, bisbenzimide (blue). BDA injection site (arrow) in callosally connected cortex, medial to the tip of V1. White lines indicate the rostrocaudal level of the coronal sections shown in B and B′. B, Coronal section showing bisbenzimide-labeled callosal connections and injection site (arrow) in callosally connected cortex medial to V1. Arrowhead marks AM/A border. B′, Darkfield image of section adjacent to B, showing that BDA injection is confined to gray matter. C, Darkfield images of BDA labeled axonal branches terminating in deep layers of the SC. Scale bar: 1mm (A, B, B′), 0.5mm (C). For abbreviations, see Fig. 1.
Input from A
Three injections were found in area A, located in acallosal cortex between V1 and primary somatosensory cortex (S1) (Fig. 11A, B). In all three cases the corticotectal projections were non-uniform and confined to the ipsilateral side. Terminal branches were distributed across large parts (medio-lateral: 652 ± 5 μm; antero-posterior: 675 ± 6 μm) of the upper nasal and temporal representations of the SC (Fig. 11C), indicating that the injections were located at the anterior-medial border of area A (Wang and Burkhalter, 2007). 93% of the projections terminated in the intermediate layers, InG and InWh (Fig. 2A). Input to SuG terminated exclusively within the lower sublamina (Fig. 2A). The overall weight (11 %) of inputs was light (Fig. 2B).
DISCUSSION
The results show a striking preference in the corticotectal connections of mouse visual cortex, in which 65–99% of inputs from the ventral areas (LM, LI, P, POR) terminate in superficial layers, whereas 73–93% of projections from dorsal areas (RL, A, AM, PM) project to deep layers. The preference for superficial (95%) over deep (5%) layers also exists in the projections from V1. The only exception is area AL, whose inputs to superficial (54%) and deep (46%) layers are of roughly equal strength.
In most mammals, superficial layers of the SC, are the principal midbrain targets of retinal input (Hofbauer and Dräger, 1985; May, 2006). The neurons in these layers respond mainly to visual inputs and selectively respond to the size, orientation, and direction of drifting high spatial frequency gratings (Girman and Lund, 2007; Prévost et al., 2007; Wang et al., 2010). Deep layers project to the saccade- and gaze-control centers in the brain stem (Murray and Coulter, 1982; Dean et al., 1986; Dean et al., 1988; Redgrave et al., 1990), where neurons are sensitive to somatosensory, auditory and visual inputs (Dräger and Hubel, 1975). Thus, the patterns of corticotectal input suggest that ventral stream areas contribute to the detection of visual objects, whereas dorsal stream areas provide sensory inputs to premotor neurons for guiding gaze, orienting and navigation (Felsen and Mainen, 2008; Sakatani and Isa, 2008).
Connectivity profiles
The corticotectal projection from V1 is the strongest and resembles that of primates (Fries, 1984; Lock et al., 2003; Collins et al., 2005; Baldwin and Kaas, 2012). Input from the early extrastriate area, LM, is weaker (28%), even though the injection sites extended across larger parts of the map than in V1. The paucity of corticotectal input from LM resembled that of V2 in primates (Fries, 1984; Lock et al., 2003; Collins et al., 2005; Baldwin and Kaas, 2012). Corticotectal inputs from other areas of occipital (LI, P) and temporal cortex (POR) are even sparser (14–16%), resembling the weak inputs from V3, V3a, V4, DL, TEO and TE in primates (Fries, 1984; Baizer et al., 1993; Collins et al., 2005; Baldwin and Kaas, 2012). Weak (10%) input also originates from AL, an area that was likened to primate MT (Montero and Jian, 1995). Corticotectal inputs from MT are strong in simian (Fries, 1984; Lock et al., 2003; Collins et al, 2005), but sparser in prosimian monkeys (Baldwin and Kaas, 2012) which resemble AL projections in mice. Corticotectal input from posterior parietal cortex is weak for RL and A (8–11%) but stronger for AM (26%), supporting the areal subdivisions within this region (Wang and Burkhalter, 2007). The weak corticotectal input from these areas is consistent with findings in primates (Baizer et al., 1993; Lui et al., 1995; Collins et al., 2005; Baldwin and Kaas, 2012). In rodents, posterior partial cortex is involved in the processing of multimodal information, guiding self-motion and navigation (Torrealba and Valdés, 2008; Marshel et al., 2011; Harvey et al., 2012). The weakest projections originate from PM, which resembles area, DL in New World monkeys (Collins et al., 2005). PM contains head direction cells (Chen et al., 1994) and may be involved in object tracking during navigation.
Topography
We found that the corticotectal projections of all 10 visual areas are topographically organized (Olavarria and Montero, 1989; Mrsic-Flogel et al., 2005). The projections from all areas, except P and A, are more widespread along axes of azimuth than elevation. The extent and anisotropy is greater for inputs from areas in which the representation of azimuth is compressed (Wang and Burkhalter, 2007). This indicates that the tracer uptake at the injection site labeled a larger proportion of the azimuthal than elevation map in the SC. Although this may explain the anisotropy of inputs from LM, LI and PM, it is inconsistent with the projections from POR, AL, RL and AM, whose maps are more symmetrical (Wang and Burkhalter, 2007). Thus, corticotectal projections from areas POR, AL, RL and AM strongly diverge along the naso-temporal axis for body, head and eye movements. The connections from POR may provide influences on receptive field centers from the surround (Girman and Lund, 2007). Corticotectal projections from AL may contact wide-field neurons, boost responses to transient stimuli (Isa and Hall, 2009) and through connections with the lateral geniculate nucleus enhance the detection of horizontally moving objects (Mooney et al., 1988). In monkey this indirect colliculo-thalamo-cortical pathways exist to MT and V3 but not to V2 and V4 (Lyon et al., 2010). Widespread corticotectal input from the posterior parietal areas, RL and AM, to deep layers, may play a role in remapping visual receptive fields to neurons that will represent that location after a change of gaze (Dunn et al., 2010).
Lamination
Studies in rat have shown that inputs from lateral posterior extrastriate cortex to the SC terminate more superficially than inputs from anterior, medial and prefrontal areas (Beckstead, 1979; Harvey and Worthington, 1990; Coogan and Burkhalter, 1993). Our results in mice show that these depth profiles are diagnostic for 9 visual areas. Area-specific laminar distributions of corticotectal projections are known in cats and primates in which all early and some higher visual areas (cat: 17, 18 19; macaque: V2, V3, V3A, V4, MT, TEO, TE) terminate in superficial layers (Fries, 1984; Ungerleider et al., 1984; Baizer et al., 1993; Webster et al., 1993; Lock et al., 2003; Collins et al., 2005; Baldwin and Kaas, 2012). By contrast, deep layers, receive inputs from posterior parietal (VIP, LIP OAa, POa, area 7) and prefrontal cortex (FEF) (Stanton et al., 1988; Harting et al., 1992; Baizer et al., 1993; Webster et al., 1993; Lui et al., 1995; Leichnetz 2001; Collins et al., 2005; Baldwin and Kaas, 2012). Thus, unlike in cats and monkeys, V1 in mice is surrounded by areas with superficial and deep corticotectal projections. This suggests that only the ventral areas are comparable to early areas of primates, whereas the dorsal and medial areas are related to primate posterior parietal and posterior medial cortex. This may be a simplification, as lateral areas (LI, AL) include projections to deep layers which are absent from early areas in primates. Among lateral areas, deep layer inputs are strongest from AL, suggesting that AL plays a role in aligning visual coordinates with body coordinates. Inputs to PAG originate from many areas, but are particularly strong from PM, suggesting that it belongs to a network for defensive behavior (Schenberg et al., 2005; Zhang et al., 2012)
In addition to area-specific input to superficial and deep SC layers, we found differential inputs to upper and lower sublaminae of SuG. Inputs from all areas, except P and POR, are strongly biased to the lower half of SuG. The bias for the deep sublamina is stronger for projections from dorsal than ventral areas. The paucity of inputs to the superficial SuG shows that this central target of many different types of off and on-off direction selective retinal ganglion cells (Huberman et al., 2009; Kim et al., 2010; Kay et al., 2011; Rivlin-Etzion et al., 2011), whose somata are small and axons are slow-conducting (Fukuda et al., 1978; Sachs and Schneider, 1984; Hofbauer and Dräger, 1985; Hong et al., 2011), receives only weak cortical feedback. Thus, corticotectal inputs may have little effect on orientation tuning in upper SuG and on downstream image-forming signals in the geniculocortical system (Harting et al. 1991). In contrast, corticotectal input to the lower half of SuG may interact with input from motion-sensitive alpha retinal ganglion cells, which have large receptive fields and fast-conducting axons (Huberman et al., 2008; Kim et al., 2010). The outputs from deep layers may flow through the lateral posterior nucleus into a network for directed attention (Kamishina et al., 2009) and/or to gaze-control centers in the brain stem (Dean et al., 1986; Dean et al., 1988). This suggests that the strong corticotectal input from dorsal areas is important for decision making and visuomotor actions.
Streams
The laminar patterns of corticotectal inputs show groupings of areas which resemble the community structure of ventral and dorsal subnetworks (Wang et al 2012). The distinctions match the groupings into dorsal and ventral streams in primates, except that projections from MT are confined to superficial layers of the SC (Ungerleider et al., 1984). Moreover, the scheme does not fit perfectly the functional distinctions of high spatial acuity ventral areas and high temporal sensitivity dorsal areas, in that LM exhibits response properties of dorsal and PM characteristics of ventral areas (Andermann et al., 2011; Marshel et al., 2011). Although we are intrigued by the mismatch, the patterns of corticotectal projections demonstrate that LM is associated with V1, LI, P and POR of the ventral stream, whereas PM belongs together with AL, RL, A and AM to the dorsal stream. The high spatial acuity of neurons in PM (Andermann et al., 2011; Marshel et al., 2011) suggests that the pathway through medial extrastriate cortex represents a distinct branch of the dorsal stream specialized for encoding landmarks during navigation (Karvitz et al., 2011).
Acknowledgments
This work was supported by grants from the National Eye Institute grants R01EY05935, R01EY016184, the Human Frontier Science Program 2000-B and the McDonnell Center for Systems Neuroscience.
Many thanks to Justin Horowitz for developing the Matlab software and Katia Valkova for excellent technical assistance.
Footnotes
Author contributions: Q.W. and A.B. designed research, analyzed the data, and wrote the paper.
References
- Abel PL, O’Brien BJ, Lia B, Olavarria JF. Distribution of neurons projecting to the superior colliculus correlates with thick cytochrome oxidase stripes in macaque visual area V2. J Comp Neurol. 1997;377:3131–323. doi: 10.1002/(sici)1096-9861(19970120)377:3<313::aid-cne1>3.0.co;2-5. [DOI] [PubMed] [Google Scholar]
- Andermann ML, Kerlin AM, Roumis DK, Glickfeld LL, Reid RC. Functional specialization of mouse higher visual cortical areas. Neuron. 2011;72:1025–1039. doi: 10.1016/j.neuron.2011.11.013. [DOI] [PMC free article] [PubMed] [Google Scholar]
- Baizer JS, Desimone R, Ungerleider LG. Comparison of subcortical connections of inferior temporal and posterior parietal cortex in monkeys. Vis Neurosci. 1993;10:59–72. doi: 10.1017/s0952523800003229. [DOI] [PubMed] [Google Scholar]
- Baldwin MKL, Kaas JH. Cortical projections to the superior colliculus in prosimian galagos (Otolemur garnetti) J Comp Neurol. 2012;520:2002–2020. doi: 10.1002/cne.23025. [DOI] [PMC free article] [PubMed] [Google Scholar]
- Beckstead RM. An autoradiographic examination of corticocortical and subcortical projections of the medio-dorsal-projections (prefrontal) cortex of the rat. J Comp Neurol. 1979;184:43–62. doi: 10.1002/cne.901840104. [DOI] [PubMed] [Google Scholar]
- Chen LL, Lin LH, Barnes CA, McNaughton BL. Head-direction cells in the rat posterior cortex. II. Contributions of visual and ideothetic information to the directional firing. Exp Brain Res. 1994;101:24–34. doi: 10.1007/BF00243213. [DOI] [PubMed] [Google Scholar]
- Collins CE, Lyon DC, Kass JH. Distribution across cortical areas of neurons projection to the superior colliculus in new world monkeys. Anat Record. 2005;285A:619–627. doi: 10.1002/ar.a.20207. [DOI] [PubMed] [Google Scholar]
- Coogan TA, Burkhalter A. Hierarchical organization of areas in rat visual cortex. Neurosci. 1993;13:3749–3772. doi: 10.1523/JNEUROSCI.13-09-03749.1993. [DOI] [PMC free article] [PubMed] [Google Scholar]
- Dean P, Redgrave P, Sahibzada N, Tsuji K. Head and body movements produced by electrical stimulation of superior colliculus in rats: effects of interruption of crossed tectoreticulospinal pathway. Neuroscience. 1986;19:367–380. doi: 10.1016/0306-4522(86)90267-8. [DOI] [PubMed] [Google Scholar]
- Dean P, Redgrave P, Mitchell IJ. Organization of efferent projections form superior colliculus to brain stem in rat: evidence for functional output channels. Prog Brain Res. 1988;75:27–36. doi: 10.1016/s0079-6123(08)60463-x. [DOI] [PubMed] [Google Scholar]
- Dräger UC, Hubel DH. Response to visual stimulation and relationship between visual, auditory and somatosensory inputs in mouse superior colliculus. J Neurophysiol. 1975;38:690–713. doi: 10.1152/jn.1975.38.3.690. [DOI] [PubMed] [Google Scholar]
- Dräger UC, Hubel DH. Topography of visual and somatosensory projections to mouse superior colliculus. J Neurophysiol. 1976;39:91–101. doi: 10.1152/jn.1976.39.1.91. [DOI] [PubMed] [Google Scholar]
- Dunn CA, Hall NJ, Colbey CL. Spatial updating in monkey superior colliculus in the absence of forebrain commissures: dissociation between superficial and intermediate layers. J Neurophysiol. 2010;104:1267–1285. doi: 10.1152/jn.00675.2009. [DOI] [PMC free article] [PubMed] [Google Scholar]
- Felsen G, Mainen Z. Neuronal substrates of sensory-guided locomotor decisions in the rat superior colliculus. Neuron. 2008;60:137–148. doi: 10.1016/j.neuron.2008.09.019. [DOI] [PMC free article] [PubMed] [Google Scholar]
- Fries W. Cortical projections to the superior colliculus in the macaque monkey: a retrograde study using horseradish peroxidase. J Comp Neurol. 1984;230:55–76. doi: 10.1002/cne.902300106. [DOI] [PubMed] [Google Scholar]
- Fukuda Y, Suzuki DA, Iwama K. Characteristics of optic nerve innervation in the rat superior colliculus as revealed by field potentials. Jpn J Physiol. 1978;28:347–365. doi: 10.2170/jjphysiol.28.347. [DOI] [PubMed] [Google Scholar]
- Gallyas F. Silver staining of myelin by means of physical development. Neurol Res. 1979;1:203–209. doi: 10.1080/01616412.1979.11739553. [DOI] [PubMed] [Google Scholar]
- Gandhi NJ, Katnani HA. Motor functions of the superior colliculus. Annu Rev Neurosci. 2011;34:205–231. doi: 10.1146/annurev-neuro-061010-113728. [DOI] [PMC free article] [PubMed] [Google Scholar]
- Garcia Del Caño G, Gerrikaqoitia I, Alonso-Cabria A, Martinez-Millàn L. Organization and origin of the connection from the inferior colliculus to the superior colliculus in the rat. J Comp Neurol. 2006;499:716–731. doi: 10.1002/cne.21107. [DOI] [PubMed] [Google Scholar]
- Girman SV, Lund RD. Most superficial sublamina of rat superior colliculus: neuronal response properties and correlates with figure-ground segregation. J Neurophysiol. 2007;98:161–177. doi: 10.1152/jn.00059.2007. [DOI] [PubMed] [Google Scholar]
- Godement P, Salaün J, Imbert M. Prenatal and postnatal development of retinogeniculate and retinocollicular projections in the mouse. J Comp Neurol. 1984;230:552–575. doi: 10.1002/cne.902300406. [DOI] [PubMed] [Google Scholar]
- Goodale MA, Milner AD. Separate visual pathways for perception and action. Trend in Neurosci. 1992;15:20–25. doi: 10.1016/0166-2236(92)90344-8. [DOI] [PubMed] [Google Scholar]
- Harting JK, Huearta MF, Hashikawa T, van Lieshout DP. Projections of the mammalian superior colliculus upon the dorsal lateral geniculate nucleus: organization of the tectogeniculate pathways in nineteen species. J Comp Neurol. 1991;304:275–306. doi: 10.1002/cne.903040210. [DOI] [PubMed] [Google Scholar]
- Harting JK, Updyke BV, Van Lieshout DP. Corticotectal projections in the cat: anterograde transport studies of twenty-five cortical areas. J Comp Neurol. 1992;324:379–414. doi: 10.1002/cne.903240308. [DOI] [PubMed] [Google Scholar]
- Harvey AR, Worthington DR. The projection from different visual cortical areas to the rat superior colliculus. J Comp Neurol. 1990;298:281–292. doi: 10.1002/cne.902980303. [DOI] [PubMed] [Google Scholar]
- Harvey CD, Coen P, Tank DW. Choice specific sequences in parietal cortex during a virtual-navigation decision task. Nature. 2012;484:62–68. doi: 10.1038/nature10918. [DOI] [PMC free article] [PubMed] [Google Scholar]
- Hemelt ME, Keller A. Superior colliculus control of vibrissa movements. J Neurophysiol. 2008;100:1245–1054. doi: 10.1152/jn.90478.2008. [DOI] [PMC free article] [PubMed] [Google Scholar]
- Hofbauer A, Dräger UC. Depth segregation of retinal ganglion cells projecting to mouse superior colliculus. J Comp Neurol. 1985;234:465–474. doi: 10.1002/cne.902340405. [DOI] [PubMed] [Google Scholar]
- Hong YK, Kim I-J, Sanes JR. Stereotyped axonal arbors of retinal ganglion cell subsets in the mouse superior colliculus (2011) J Comp Neurol. 2011;519:1691–1711. doi: 10.1002/cne.22595. [DOI] [PMC free article] [PubMed] [Google Scholar]
- Huberman AD, Manu M, Koch SM, Susman MW, Lutz AB, Ullian EM, Baccus SA, Barres BA. Architectures and activity-mediated refinement of axonal projections from a mosaic of genetically identified retinal ganglion cells. Neuron. 2008;59:425–438. doi: 10.1016/j.neuron.2008.07.018. [DOI] [PMC free article] [PubMed] [Google Scholar]
- Huberman AD, Wei W, Elstrott J, Stafford BK, Feller MB, Barres BA. Genetic identification of an on-off direction-selective retinal ganglion cell subtype reveals layer-specific subcortical map of posterior motion. Neuron. 2009;62:327–334. doi: 10.1016/j.neuron.2009.04.014. [DOI] [PMC free article] [PubMed] [Google Scholar]
- Huerta MF, Frankfurter A, Harting JK. Studies of the principal sensory and spinal trigeminal nuclei of the rat: projections to he superior colliculus, inferior olive, and cerebellum. J Comp Neuron. 1983;220:147–167. doi: 10.1002/cne.902200204. [DOI] [PubMed] [Google Scholar]
- Isa T, Hall WC. Exploring the superior colliculus. J Neurophysiol. 2009;102:2581–2593. doi: 10.1152/jn.00498.2009. [DOI] [PMC free article] [PubMed] [Google Scholar]
- Jiang X, Johnson RR, Burkhalter A. Visualization of dendritic morphology of cortical projection neurons by retrograde axonal tracing. J Neurosci Methods. 1993;50:45–60. doi: 10.1016/0165-0270(93)90055-v. [DOI] [PubMed] [Google Scholar]
- Kamishina H, Conte WL, Patel SS, Tai RJ, Corwin JV, Reep RL. Cortical connections of the rat lateral posterior nucleus. Brain Res. 2009;1264:39–56. doi: 10.1016/j.brainres.2009.01.024. [DOI] [PubMed] [Google Scholar]
- Kay JN, De la Huerta I, Kim I-J, Zhnag Y, Yamagata M, Chu MW, Meister M, Sanes JR. Retinal ganglion cells with distinct directional preferences differ in molecular identity, structure, and central projections. J Neurosci. 2011;31:7753–7762. doi: 10.1523/JNEUROSCI.0907-11.2011. [DOI] [PMC free article] [PubMed] [Google Scholar]
- Kim I-J, Zhang Y, Yamagata M, Meister M, Sanes JR. Molecular identification of a retinal cell types that responds to upward motion. Nature. 2008;452:478–482. doi: 10.1038/nature06739. [DOI] [PubMed] [Google Scholar]
- Kim I-J, Zhand Y, Meister M, Sanes JR. Laminar restriction of retinal ganglion cell dendrites and axons: subtype-specific developmental patterns revealed by transgenic markers. J Neurosci. 2010;30:1452–1462. doi: 10.1523/JNEUROSCI.4779-09.2010. [DOI] [PMC free article] [PubMed] [Google Scholar]
- Kravitz DJ, Saleem KS, Baker CI, Mishkin M. A new neural framework for visuospatial processing. Nat Rev Neurosci. 2011;12:217–30. doi: 10.1038/nrn3008. [DOI] [PMC free article] [PubMed] [Google Scholar]
- Leichnetz G. Connections of the medial posterior parietal cortex (Area 7m) in the monkey. Anat Record. 2001;263:215–236. doi: 10.1002/ar.1082. [DOI] [PubMed] [Google Scholar]
- Lock TM, Baizer JS, Bender DB. Distribution of corticotectal cells in macaque. Exp Brain Res. 2003;151:455–470. doi: 10.1007/s00221-003-1500-y. [DOI] [PubMed] [Google Scholar]
- Lui F, Gregory KM, Blanks RH, Giolli RA. Projections from visual areas of the cerebral cortex to pretectal nuclear complex, terminal accessory optic nuclei, and superior colliculus in macaque monkey. J Comp Neurol. 1995;363:439–60. doi: 10.1002/cne.903630308. [DOI] [PubMed] [Google Scholar]
- Lyon DC, Nassi JJ, Callaway EM. A disynaptic replay from superior colliculus to dorsal stream visual cortex in macaque monkey. Neuron. 2010;65:270–279. doi: 10.1016/j.neuron.2010.01.003. [DOI] [PMC free article] [PubMed] [Google Scholar]
- Marshel JH, Garrett ME, Nauhaus I, Callaway EM. Functional specialization of seven mouse visual cortical areas. Neuron. 2011;72:1040–1054. doi: 10.1016/j.neuron.2011.12.004. [DOI] [PMC free article] [PubMed] [Google Scholar]
- May PJ. The mammalian superior colliculus: laminar structure and connections. Progress in Brain Research. 2006;151:321–378. doi: 10.1016/S0079-6123(05)51011-2. [DOI] [PubMed] [Google Scholar]
- McHaffie JG, Stein BE. Eye movements evoked by electrical stimulation in the superior colliculus of rats and hamsters. Brain Res. 1982;247:243–253. doi: 10.1016/0006-8993(82)91249-5. [DOI] [PubMed] [Google Scholar]
- Montero VM, Jian S. Induction of c-fos protein by patterned visual stimulation in central visual pathways of the rat. Brain Res. 1995;690:189–199. doi: 10.1016/0006-8993(95)00620-6. [DOI] [PubMed] [Google Scholar]
- Mooney RD, Nikoletseas MM, Ruiz SA, Rhoades RW. Receptive field properties and morphological characteristics of the superior colliculus neurons that project to the lateral posterior and lateral geniculate nuclei in the hamster. J Neurophysiol. 1988;59:1333–1351. doi: 10.1152/jn.1988.59.5.1333. [DOI] [PubMed] [Google Scholar]
- Mrsic-Flogel TD, Hofer SB, Creutzfeldt C, Cloëz-Tayarni I, Changeux J-P, Bonhoeffer TT, Hübener M. Altered map of visual space in the superior colliculus of mice lacking early retinal waves. J Neurosci. 2005;25:6921–6928. doi: 10.1523/JNEUROSCI.1555-05.2005. [DOI] [PMC free article] [PubMed] [Google Scholar]
- Murray EA, Coulter JD. Organization of tectospinal neurons in the cat and rat superior colliculus. Brain Res. 1982;243:9–26. doi: 10.1016/0006-8993(82)90243-8. [DOI] [PubMed] [Google Scholar]
- Olavarria J, Mignano LR, Van Sluyters RC. Pattern of extrastriate visual areas connecting reciprocally with striate cortex in mouse. Exp Neurol. 1982;78:775–779. doi: 10.1016/0014-4886(82)90090-5. [DOI] [PubMed] [Google Scholar]
- Olavarria J, Montero MV. Organization of visual cortex in the mouse revealed by correlating callosal and striate-extrastriate connections. Vis Neurosci. 1989;3:59–69. doi: 10.1017/s0952523800012517. [DOI] [PubMed] [Google Scholar]
- Prévost F, Lepore F, Guillemont J-P. Spatio-temporal receptive fields properties of cells in the rat superior colliculus. Brain Res. 2007;1142:80–91. doi: 10.1016/j.brainres.2007.01.041. [DOI] [PubMed] [Google Scholar]
- Redgrave P, Dean P, Westby GWM. organization of the crossed tecto-reticulo-spinal projection in rat. I. Anatomical evidence for separate output channels to the perabducens area and caudal medulla. Neuroscience. 1990;37:571–584. doi: 10.1016/0306-4522(90)90092-i. [DOI] [PubMed] [Google Scholar]
- Rivlin-Etzion M, Zhou K, Wei W, Elstrott J, Nguyen PL, Barres BA, Huberman AD, Feller MG. Transgenic mice reveal unexpected diversity of On-Off direction-selective retinal ganglion cell subtypes and brain structures in motion processing. J Neurosci. 2011;31:8760–8769. doi: 10.1523/JNEUROSCI.0564-11.2011. [DOI] [PMC free article] [PubMed] [Google Scholar]
- Sachs GM, Schneider GE. The morphology of optic tract axons arborizing in the superior colliculus of the hamster. J Comp Neurol. 1984;230:155–167. doi: 10.1002/cne.902300202. [DOI] [PubMed] [Google Scholar]
- Sahibzada N, Dean P, Redgrave P. Movements resembling orientation or avoidance elicited by electrical stimulation of the superior colliculus in rats. J Neurosci. 1986;6:723–733. doi: 10.1523/JNEUROSCI.06-03-00723.1986. [DOI] [PMC free article] [PubMed] [Google Scholar]
- Sakatani T, Isa T. Superior colliculus and saccade generation in mice. In: Chalupa LM, Williams RW, editors. Eye, Retina, and Visual System of the Mouse. MIT Press; Cambridge, MA: 2008. pp. 233–244. [Google Scholar]
- Schenberg LC, Póvoa RM, Costa AL, Caldellas AV, Tufik S, Bittencourt AS. Functional specializations within the tectum defense systems of the rat. Neurosci Biobehav Rev. 2005;29:1279–98. doi: 10.1016/j.neubiorev.2005.05.006. [DOI] [PubMed] [Google Scholar]
- Stanton GB, Goldberg ME, Bruce CJ. Frontal eye fields efferents on the macaque monkey: II. Topography of terminal fields in midbrain and pons. J Comp Neurol. 1988;271:493–506. doi: 10.1002/cne.902710403. [DOI] [PubMed] [Google Scholar]
- Torrealba F, Valdés JL. The parietal association cortex of the rat. Biol Res. 2008;41:369–377. [PubMed] [Google Scholar]
- Ungerleider LG, Mishkin M. Two cortical visual system. In: Ingle DJ, Goodale MA, Mansfield RJW, editors. Analysis of Visual Behavior. MIT Press; Cambridge MA: 1982. pp. 549–586. [Google Scholar]
- Ungerleider LG, Desimone R, Galkin TW, Mishkin M. Subcortical projections of area MT in the macaque. J Comp Neurol. 1984;223:368–386. doi: 10.1002/cne.902230304. [DOI] [PubMed] [Google Scholar]
- Wang L, Sarnaik R, Rangarajan K, Liu X, Cang J. Visual receptive field properties of neurons in the superficial superior colliculus of the mouse. J Neurosci. 2010;30:16573–16584. doi: 10.1523/JNEUROSCI.3305-10.2010. [DOI] [PMC free article] [PubMed] [Google Scholar]
- Wang Q, Burkhalter A. Area map of mouse visual cortex. J Comp Neurol. 2007;502:339–357. doi: 10.1002/cne.21286. [DOI] [PubMed] [Google Scholar]
- Wang Q, Gao E, Burkhalter A. Gateways of ventral and dorsal streams in mouse visual cortex. J Neurosci. 2011;31:1905–1918. doi: 10.1523/JNEUROSCI.3488-10.2011. [DOI] [PMC free article] [PubMed] [Google Scholar]
- Wang Q, Sporns O, Burkhalter A. Network analysis of corticocortical connections reveals ventral and dorsal processing streams in mouse visual cortex. J Neurosci. 2012;32:4386–4399. doi: 10.1523/JNEUROSCI.6063-11.2012. [DOI] [PMC free article] [PubMed] [Google Scholar]
- Webster MJ, Bachevalier J, Ungerleider LG. Subcortical connections of inferior temporal areas TE and TEO in macaque monkeys. J Comp Neurol. 1993;335:73–91. doi: 10.1002/cne.903350106. [DOI] [PubMed] [Google Scholar]
- Zhang Y, Kim I-J, Sanes JR, Meister M. The most numerous ganglion cell type of the mouse retina is a selective feature detector. Proc Natl Acad Sci USA. 2012;109:E2391–E2398. doi: 10.1073/pnas.1211547109. [DOI] [PMC free article] [PubMed] [Google Scholar]


