

Abstract
The dorsal anterior cingulate cortex (dACC) has been implicated in a variety of cognitive control functions, among them the monitoring of conflict, error, and volatility, error anticipation, reward learning, and reward prediction errors. In this work, we used a Bayesian ideal observer model, which predicts trial-by-trial probabilistic expectation of stop trials and response errors in the stop signal task, to differentiate these proposed functions quantitatively. We found that dACC hemodynamic response, as measured by functional magnetic resonance imaging, encodes both the absolute prediction error between stimulus expectation and outcome, and the signed prediction error related to response outcome. After accounting for these factors, dACC has no residual correlation with conflict or error likelihood in the stop-signal task. Consistent with recent monkey neural recording studies, and in contrast with other neuroimaging studies, our work demonstrates that dACC reports at least two different types of prediction errors, and beyond contexts that are limited to reward processing.
Keywords: cognitive control, Bayesian surprise, prediction error, fMRI, ACC
Introduction
Inhibitory control, the ability to withhold or modify actions in response to dynamically changing task demands, is a critical executive function. Whether biting our tongue to stop an inappropriate comment, or resisting the temptation of an extra piece of dessert, the brain employs inhibitory control regularly to negotiate competing objectives in life. The neural underpinnings of cognitive control remains poorly understood, but dorsal anterior cingulate cortex (dACC) has been repeatedly implicated. A plethora of cognitive functions have been proposed for dACC: conflict monitoring (Botvinick et al., 2001), error monitoring (Holroyd et al., 2004) and anticipation (Brown and Braver, 2005; Jessup et al., 2010), volatility monitoring (Behrens et al., 2007), action outcome learning (Rushworth et al., 2004), reward (Seo and Lee, 2007; Alexander and Brown, 2010), and the coding of signed or unsigned reward prediction errors (Seo and Lee, 2007; Martin et al., 2009; Hayden et al., 2011). In this work, we use a Bayesian prediction model to differentiate these proposed functions quantitatively, by comparing model prediction with trial-by-trial behavior as well as fMRI activation in dACC in the stop signal task, a classic inhibitory control paradigm.
In the stop signal task, subjects typically respond to a prepotent go signal, and withhold response when presented with an infrequent stop signal subsequent to the go signal (Figure 1A). We previously proposed a Bayes-optimal rational decision-making model for the stop-signal task (Shenoy et al., 2011; Shenoy and Yu, 2011), positing that subjects choose whether to go or not rationally based on accumulating sensory evidence (Figure 1B). We showed (Shenoy et al., 2011; Shenoy and Yu, 2011) that this rational strategy explains classic stopping behavior, such as the increase in stop error rate with increasing stop-signal delay and faster stop error responses than correct go responses (Logan et al., 1984), as well as more subtle contextual effects such as the decrease in stop error rate and stop-signal reaction time when stop errors are penalized more (Leotti and Wager, 2009), and the decrease in stop error rate and increase in go reaction time when more stop trials are expected (Emeric et al., 2007). By augmenting this decision-making model with trial-by-trial learning (Dynamic Belief Model, (Yu and Cohen, 2009)), we were also able to account for sequential effects in the stop-signal task (Shenoy et al., 2011): go reaction time (RT) slowing down after a run of stop trials and speeding up after a preponderance of go trials (Emeric et al., 2007; Li et al., 2008a).
Figure 1. Stop signal-paradigm and Bayesian sequential prediction.
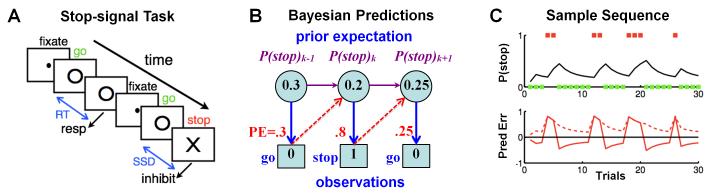
(A) In the stop signal task, subjects begin each trial by fixating a dot, which, after a randomized fore-period (FP), is replaced by a go signal (○); subjects are instructed to press a button at the go signal, unless a stop signal (×) appears after a stop-signal delay (SSD). Depicted is a go trial followed by a stop trial. (B) We use a Bayesian hidden Markov model, specifically a version of the Dynamic Belief Model (Yu and Cohen, 2009), to compute trial-by-trial sequential predictions about stop signal frequency. The prior probability of a stop signal on trial k, P(stop)k , is compared with the actual outcome (stop=1, go=0), to produce a prediction error ΔP, which is then combined with the prior to produce a new prior for the next trial k+1. (C) Top: for a sample sequence of go (green square) and stop (red square) trials, Bayesian prior belief about encountering a stop trial (P(stop), black line) increments for each stop trial, and decrements for each go trial. Bottom: The corresponding signed prediction error (solid), stimulus outcome – P(stop), and absolute prediction error (dashed), ∣stimulus outcome – P(stop)∣, as predicted by the Bayesian model, are shown.
In this work, we use the Dynamic Belief Model to compute graded estimates of subjects’ expectations about trial type (go or stop) and response outcome (correct or error) on each trial, and investigate the role of dACC. The model yields three estimates (Figure 1C): (1) probabilistic expectation of encountering a stop trial, P(stop), and of making an error, P(error), (2) signed prediction error (SPE) related to those expectations, stim–P(stop) and resp–P(error) (where stim=1/0 for stop/go trials, resp=1/0 for error/correct trials), and (3) unsigned prediction error (UPE) related to those expectations, ∣stim–P(stop)∣ and ∣resp–P(error)∣. SPE is an important quantity for experiential learning about stimulus-action-outcome contingencies in the behavioral environment (Schultz et al., 1997; O’Doherty et al., 2003; Behrens et al., 2007; Yu and Cohen, 2009), while UPE is an important Bayesian surprise signal that is important for detecting and adapting to drastic, unexpected changes in environmental contingencies (Yu and Dayan, 2005; Behrens et al., 2007; Nassar et al., 2012). This approach gives us model-based, trial-by-trial estimate of neural encoding of probabilistic anticipation of stimulus outcome and response error, as well as prediction errors signals (Figure 1C).
Material and Methods
Behavioral task
We employed a simple reaction time task in this stop-signal paradigm (Logan et al., 1984; Li et al., 2006; Li et al., 2009; Ide and Li, 2011). There were two trial types: “go” and “stop,” randomly intermixed, with an inter-trial interval of 2s. A small dot appears on the screen to engage attention at the beginning of a go trial. After a randomized time interval (fore-period) between 1 and 5 s, drawn from a uniform distribution, the dot turns into a circle (the “go” signal), which serves as an imperative stimulus, prompting the subjects to quickly press a button. The circle vanishes at a button press or after 1 s had elapsed, whichever coming first, and the trial terminates. A premature button press prior to the appearance of the circle also terminates the trial. There are two types of go trial errors: omission error (no response) and premature response. Approximately three quarters of all trials are go trials. The remaining one quarter are stop trials. On a stop trial, an additional “X,” the “stop” signal, appears after and replaces the go signal. Subjects were told to withhold their response upon seeing the stop signal. Similar to go trials, a stop trial terminates at button press or 1 s after the appearance of the stop signal. Failure to withhold the go response for the 1 s constitutes a stop error. The stop signal delay (SSD) – the time interval between go and stop signals – starts at 200 ms and is adjusted according to a staircase procedure: if the subject succeeds in withholding the go response, SSD increases by 67 ms; conversely, if he fails, SSD decreases by 67 ms (Levitt, 1971). Subjects were instructed to respond to the go signal quickly while keeping in mind that a stop signal could come up in a small number of trials. Prior to the fMRI study, each subject had a practice session outside the scanner. In the scanner, each subject completed four 10-min runs of the task. Depending on the actual stimulus timing (trials varied in fore-period duration) and speed of response, the total number of trials varied slightly across subjects in an experiment. The staircase procedure ensures that subjects would succeed in withholding their response in approximately half of the stop trials.
Subjects and MR imaging
Sixty-six healthy subjects (18-58 years of age, mean=30, 33 female) were paid to participate in the study. All participants signed a written consent, after details of the study were explained, in accordance to guidelines and procedures approved by Yale University Human Investigation Committee.
MR imaging data were acquired with a Siemens 3-Tesla scanner. Anatomical images of the functional slice locations were obtained with spin echo imaging in the axial plane parallel to the AC-PC line with TR = 300 ms, TE = 2.5 ms, bandwidth = 300 Hz/pixel, flip angle = 60°, field of view = 220 × 220 mm, matrix = 256 × 256, 32 slices with slice thickness = 4mm and no gap. Functional, blood oxygenation level dependent (BOLD) signals were then acquired with a single-shot gradient echo planar imaging (EPI) sequence. Thirty-two axial slices parallel to the AC-PC line covering the whole brain were acquired with TR = 2,000ms, TE = 25 ms, bandwidth = 2004 Hz/pixel, flip angle = 85°, field of view = 220 × 220 mm, matrix = 64 × 64, 32 slices with slice thickness = 4mm and no gap. Three hundred images were acquired in each session. Additional details of the behavioral task and imaging routines can be found in our previous work (Li et al., 2006; Li et al., 2008b).
Spatial preprocessing of brain images
The data were analyzed with Statistical Parametric Mapping 8 (Wellcome Department of Imaging Neuroscience, University College London, U.K.). Images from the first five TRs at the beginning of each session were discarded to enable the signal to achieve steady-state equilibrium between RF pulsing and relaxation. Images of each individual subject were first corrected for slice timing, realigned (motion-corrected) and unwarped (Andersson et al., 2001; Hutton et al., 2002). A mean functional image volume was constructed for each subject for each run from the realigned image volumes. The anatomical images (T1-weighted) were co-registered to the mean functional image, and normalized to an MNI (Montreal Neurological Institute) template with affine registration followed by nonlinear transformation using a unified segmentation and registration framework (Ashburner and Friston, 2005). The normalization parameters determined for the anatomical volume were then applied to the corresponding functional image volumes for each subject. Finally, images were smoothed with a Gaussian kernel of 6 mm at Full Width at Half Maximum.
Bayesian Model Probabilistic Prediction and Evaluation
Bayesian probabilistic models have been successfully applied to explain perception (e.g. (Ernst and Banks, 2002; Battaglia et al., 2003), attention (e.g. (Dayan et al., 2000; Yu and Dayan, 2002)), sensorimotor learning (e.g. (Kording and Wolpert, 2004)), decision making and contingency learning (Daw et al., 2006; Behrens et al., 2007; Dayan and Daw, 2008). In this work, we implement a Bayesian model that has a fine-timescale within-trial inference and decision-making component (see (Shenoy and Yu, 2011), for more details), and a slower-timescale across-trial learning component (see (Shenoy et al., 2011), for more details).
a) Within-trial Bayesian inference and decision-making model predicts linear increase in Go RT versus P(stop)
In the stop signal task, the fraction of trials containing a stop signal is of critical importance in human and animal performance at the task (Emeric et al., 2007). Previously, we proposed a rational decision-making model, suggesting that experimentally observed patterns of inhibitory behavior in the stop-signal task are direct consequences of optimal statistical inference and decision-making (Shenoy et al., 2011). In particular, when we simulate the model for different expected probabilities of observing a stop signal, and obtain the mean go reaction time (RT) for each setting, the relationship between the two can be seen to be very well approximated by a linear function (Figure 2A). Intuitively, as the expected prevalence of stop signal trials becomes higher, (1) the stronger prior expectation allows the stop signal to be detected faster on stop trials, and (2) the optimal decision policy slows down the go response in order to minimize the overall probability of making a stop error.
Figure 2. Bayesian model prediction and behavioral data.

(A) Bayes-optimal decision-making in the stop-signal task predicts a positive linear relationship between go RT and P(stop) (red squares and line fit). Subjects’ go RT positively and linearly correlates with the model estimate of P (stop) on each trial, confirming the prediction. Black circles: mean go RT averaged across subjects for each small bin of P(stop) values, error bars = SEM (n=66), line is best linear regression fit to mean go RT (R2=0.83, p<10–15 ). Histogram: empirical distribution of model-estimated P(stop). (B) Model predicts a decrease in the stop error (SE) rate as P(stop) increases, as shown by red squares and line fit. Behavioral data, shown in black, also demonstrate a negative linear relationship between SE rate and model-estimated P(stop). Black circles, error bars and histogram as in panel (A). Black line is best linear regression fit to SE rate (R2=0.88, p<10−5).
b) Across-trial Bayesian modeling of sequential effects
Humans and animals are known to be sensitive to sequences of stimuli in behavioral tasks, even when the stimuli are drawn randomly (Laming, 1979; Soetens et al., 1985; Cho et al., 2002). Previously, we used a Bayesian model, termed the Dynamic Belief Model (Yu and Cohen, 2009), a particular hidden Markov model, to show that such behavior may arise from subjects tracking the frequencies of relative stimuli under an assumption of non-stationarity in the environmental statistics -- consequently tracking local, transient patterns in stimulus sequences. In the stop signal task, the estimated fraction of stop trials is critical for selecting the appropriate action policy, and we propose that subjects continually estimate the fraction of stop trials using a dynamic model similar to our previous work (Yu and Cohen, 2009). In particular, we assume subjects believe that the stop signal frequency rk on trial k has probability α of being the same as rk-1 and probability 1-α of being re-sampled from a prior distribution p0(r), chosen in our simulations to be a beta distribution with a bias toward small r (infrequent stop trials). We have shown in previous work that such an assumption is essentially equivalent to using a causal, exponential, linear filter to estimate the current rate of stop trials (Yu and Cohen, 2009), where the exponential decay constant is monotonically related to the assumed volatility in the environment in the Bayesian model. The probability of trial k being a stop trial, P(sk=1 | sk-1), where sk:={s1, …, sk}, is:
In other words, the predictive probability of seeing a stop trial is just the mean of the predictive distribution p(rk|sk-1). The predictive distribution is a mixture of the previous posterior distribution and a fixed prior distribution, with α and 1–α acting as the mixing coefficients, respectively:
and the posterior distribution is updated according to Bayes’ Rule:
Given a sequence of observed stop/go trials and the settings for p0(r) and α, we can compute the corresponding sequence of subjective P(stop) probabilities for the stream of stimuli each subject actually experiences. We assume p0(r) to be a Beta distribution, Beta(3.5,7.5), and α = 0.8, kept constant across all subjects. The trial-by-trial estimation of P(stop) = <rk> was then used as a parametric regressor in fMRI analysis. These parameters are chosen as representative of subjects’ expectations in the task: the mean of the prior distribution is set to the empirical mean (0.25), and the rate of change is similar to the value estimated in previous work, 0.77 (Yu and Cohen, 2009). A priori, we expected that model predictions would be highly sensitive to the parameters α and the prior distribution over r; however, this turned out to not be the case, as the P(stop) values are highly correlated (R2>0.85) with those produced by a large range of parameter settings we tested around the chosen setting.
Specifically, we tested the following parameter ranges: α = [0.6, 0.95]. For the Beta distribution we reparameterized it using the values m = a/(a+b) and s = (a+b), corresponding to the prior mean and a “scale” parameter respectively. For these parameters we explored the range m = [0.1, 0.35], and s = [5, 15]. In this range of parameters, as reported, the correlation coefficient between the model predictions and P(stop) calculated using “default” model settings was > 0.85.
To model sequential expectation related to P(error), we used a very similar DBM Bayesian model, but with a different prior distribution that is consistent with empirical error rate. Through staircasing of the stop signal delay, the stop error rate was constrained to be roughly half of all stop trials. Since the go error rate was a small fraction of go trials, the overall error rate was roughly 0.5 × 0.25 = 0.125. Accordingly, we used the DBM parametrization α = 0.8, prior mean = 0.125, and prior scale = 10, with the only difference being the mean of the prior distribution p0(error). A DBM with this parametrization was run on each individual’s sequence of (success/error) trials to calculate P(error) on each trial.
Statistical Analysis of fMRI Data
A statistical analytical design was constructed for each individual subject, using a general linear model (GLM) that convolves predictive variables with a canonical hemodynamic response function (HRF) and its temporal derivative (Friston et al., 1995). In the first GLM, four categorical types of trials were distinguished according to trial type and outcome: go success (GS), go error (GE), stop success (SS), and stop error (SE) trials. The probability of stop and error trials as estimated by the Bayesian model, or P(stop) and P(error) respectively, were entered as parametric modulators in the GLM (Buchel et al., 1998) for each one of the event-related regressors. For go success trials, we also included go RT as a third parametric modulator to account for potential motor response confounds. Thus, in this GLM1, there were four event-related main regressors, and a total of nine parametric modulators. For each type of trial, the parametric modulator P(stop) was orthogonalized with respect to the main regressor, and the subsequent parametric modulator P(error) was orthogonalized with respect to the previous one P(stop). Realignment parameters in all six dimensions were also entered in the model to account for head motions. The data were high-pass filtered (128 s cutoff) to remove low-frequency signal drifts. Serial autocorrelation was corrected by a first-degree autoregressive or AR[1] model. The GLM estimates the component of variance explained by each of the regressors, with the coefficient of each regressor constituting a beta image. The beta image reflects the height of average activation across trials for a particular event, while the beta image of the parametric modulator regressor informs how well the residual fluctuations in the BOLD signal co-vary with the parametric modulator for the event (Glascher, 2009). In this first GLM, we computed for each individual subject the contrast StopP(stop)>GoP(stop), to isolate stop as compared to go trial activations modulated by P(stop). In StopP(stop), we have the parametric modulation components of P(stop) during SS and SE, while in GoP(stop), we have the modulation component of P(stop) during GS trials. This contrast was used to localize the conflict-related activations of the task modulated by the Bayesian prediction of conflicts. GE trials were not included in the contrasts, since there were not a sufficient number of these trials. In the second-level analysis, the contrast images (con) of the first-level analysis were used for random-effect analysis to obtain group T-maps on the basis of one-sample t-tests. Brain regions were identified using an atlas (Duvernoy, 2003; Mai et al., 2008) and the peak activations were reported in MNI coordinates. We also constructed a variant of GLM1 (which we call GLM1*), identical to GLM1 except for reversing the order of P(stop) and P(error), and created an identical set of contrasts as for GLM1.
In the second GLM, instead of directly using P(stop) as parametric modulator, we categorized go and stop trials into two groups according to their P(stop): low and high (median split of estimated P(stop) over all trials). Thus, in this model, we have four event-related regressors (2 conditions times 2 groups each), their corresponding first derivatives, and the six realignment parameters as covariates of no interest.
In the third GLM, we employed a single categorical regressor comprising stimulus onset on all trials. We associated this main regressor with four parametric modulators: Bayesian surprise or unsigned prediction error (UPE) of stop (∣stimulus outcome – P(stop)∣), signed prediction error (SPE) of error (response outcome – P(error)), stimulus outcome/conflict (stop=1, go=0), and response outcome (error=1, correct=0), with subsequent modulators orthogonalized with respect to previous ones. Importantly, all these four parametric modulators are highly correlated among them (considering the presented parametric modulator ordering, the average correlation coefficient matrix between modulators across subjects is [1.0000 0.5394 0.9745 0.5784; 0.5394 1.0000 0.5497 0.9748; 0.9745 0.5497 1.0000 0.5726; 0.5784 0.9748 0.5726 1.0000], with p<10−4 for all comparisons). With this ordering, we aimed to isolate the stimulus and response outcome modulations after regressing out the Bayesian surprise, as well the SPE of error components. On the whole, this GLM has a single main regressor with four parametric modulators, their first derivatives, and the six realignment parameters as covariates of no interest. We also created a variant of GLM3 (which we call GLM3*), identical except for reversing the order of UPE of stop and SPE of error.
Altogether, we constructed a total of five models, which we called GLM1, GLM1*, GLM2, GLM3, and GLM3*, respectively.
ROI Analysis with Cross-Validation
In the group analysis, from the contrast StopP(stop)>GoP(stop) of GLM1, we defined a cluster in the dorsal anterior cingulated cortex (dACC) as the region of interest, at p<0.0001, uncorrected. To perform a robust ROI analysis, free from spurious correlations, we employed a leave-six-out cross-validation approach (Poldrack and Mumford, 2009): always holding six subjects out of the group analysis (without repetition), we found a dACC cluster for each group of sixty subjects. Therefore, we obtained eleven different dACC clusters (66/6 = 11). We carefully examined each one of the eleven dACC clusters to guarantee their localization. Finally, for each subject, we computed (using MarsBaR (Brett, 2002); http://marsbar.sourceforge.net/) the regressor’s effect size or the percent signal change (PSC) inside the corresponding dACC (the cluster obtained when the subject is left-out).
To test the Bayesian model predictions, we computed the effect size of P(stop) parametric regressor inside the dACC masks using GLM1, for go and stop trials separately. The same predictions, but in an alternative construct, were tested in the GLM2 by computing the PSC of dACC for each one of the four conditions (i.e., low and high P(stop) each for go and stop trials).
Results
Behavioral Performance, Modulation of RT and accuracy by probabilistic expectations
We collected behavioral and fMRI BOLD data while subjects performed the stop-signal task. Across subjects, the mean (and standard deviation) of stop signal reaction time (SSRT), median go reaction time, stop success rate, and go success rate are 201(±32) s, 556(±104) s, 0.50(±0.02), and 0.97(±0.03), respectively.
We first examined the behavioral data to see whether subjects indeed make Bayesian predictions about stop trial frequency based on actual trial history (by inverting a hidden Markov model, see Material and Methods), and utilize it to optimize the decision whether to go or stop (by minimizing a Bayesian risk function penalizing a linear combination of go errors, stop errors, and response delay, see Material and Methods). As shown in Figures 2A and 2B, our model predicts that go RT should linearly increase, and stop error rate linearly decrease, as P(stop) increases. We found that, averaged across subjects (n=66), go RT indeed has strong positive, linear correlation with model-estimated P(stop) (Figure 2A; R2=0.83, p<10−15). More impressively, all 66 subjects’ go RT is individually positively correlated with model-estimated P(stop) (p<0.001 in 49 subjects, p<0.05 in all subjects), implying that stop signal expectancy accounts for a significant amount of trial-to-trial variability in go RT in individual subjects. The slopes of linear regression fits between go RT and model-estimated P(stop) are significantly positive across subjects (p <10−10, one-tailed t-test). The mean correlation coefficient between go RT and P(stop) across subjects is 0.24 ± 0.01.
Similarly, stop error rate, averaged across subjects, decrease linearly as a function of model-estimated P(stop) (R2=0.88, p<10−5, Figure 2B), as predicted by the Bayesian model. These results imply that as subjects’ expectation of a stop signal increases, driven by an accumulation of stop trials in recent trial history, they strategically slow down on the following trial in anticipation of the stop trial, which allows them to make fewer stop errors but at the expenses of longer go RT. Moreover, the amount of go RT slowdown and stop error decrease are consistent with employing a learning/prediction process that assumes the experimental stop signal frequency to be undergoing occasional, unsigned changes, as is assumed by the Dynamic Belief Model.
Previous work has suggested that response times slow down after subjects commit an error. Since, in our task, the stop signal is highly correlated with error, we also examined whether the observed RT adjustments are caused by error expectancy in part, along with expectation of the stop signal itself. To do this, we computed the expectation associated with an error trial, P(error), using the experienced sequence of error trials and a sequential estimation procedure identical to the one used to estimate P(stop). Although go RT is significantly correlated with P(error), we found that after accounting for the effect of P(stop) on RT, no significant correlation between residual RT and P(error) remains (p=0.17, Figure 4B). In contrast, after regressing out the effects of P(error), a highly significant correlation remains between average residual RT and P(stop) (Figure 4A, R2=0.70, p<10−10). In a per-subject basis analysis, there was significant residual correlation between RT and P(stop) after regressing out P(error) (45 out of 66 subjects, p<0.05, average correlation coefficient of 0.15). However, only 8 (out of 66) subjects showed a significant correlation between P(error) and RT after P(stop) was regressed out (average correlation coefficient of 0.01, and t-test on the individual subject correlation coefficients showed no significant difference from zero).
Figure 4. Effect of stop signal and error expectancy on RT.

(A) Go RT is significantly correlated with P(stop) after regressing out the effect of P(error). Black dots show residual go RT for each bin of estimated P(stop) values, averaged across all 66 subjects; error bars = SEM, histogram shows fraction of trials in each P(stop) bin. Black line shows best fitting linear regression line (R2=0.70, p<10−10). (B) RT is not significantly affected by P(error) after regressing out the effect of P(stop). Black dots show residual go RT for each bin of estimated P(error) values, averaged across all 66 subjects; error bars = SEM, histogram shows number of trials in each P(error) bin. Black line is best-fitting linear regression (R2=0.03, p=0.17).
dACC encoding of Bayesian surprise
The reaction time and accuracy data suggest that Bayes-optimal sequential estimation of stop trial occurrence captures trial-to-trial probabilistic computations in human subjects -- thus providing a powerful tool for identifying brain regions performing probabilistic computations. In the first general linear model (GLM1), we separately modeled go (go success, go error) and stop (stop success, stop error) trials, using P(stop) as a parametric modulator (orthogonalized with respect to the categorical regressors). As expected, dACC, along with a number of other areas, was more active for stop than go trials (Figure 3A, hot color; p<0.05, FWE corrected). An important question then is whether there is a neural correlate of P(stop) or evaluation of P(stop) compared to actual stimulus outcome, in the dACC region. Note that an area encoding Bayesian surprise, or UPE related to stimulus outcome, should be positively correlated with P(stop) on go trials, and negatively correlated with P(stop) on stop trials (see Fig. 1C). This is because ∣stimulus outcome – P(stop)∣ = ∣0 – P(stop)∣ = P(stop) on go trials, and ∣stimulus outcome – P(stop)∣ = ∣1 – P(stop)∣ = 1 – P(stop) on stop trials. When we looked for brain regions that have more positive correlation with P(stop) on go trials than on stop trials, we found a single cluster in the dACC, bordering SMA (Figure 3A, violet color; p<0.0001, uncorrected; see Table 1 for more detailed description). Using the dACC cluster as a mask, we performed the ROI analysis with leave-six-out cross-validation. The results showed an average beta coefficient for the P(stop) parametric regressor (effect size) that is significantly positive for go trials (p<0.0078) and significantly negative for stop trials (p<0.0041) (Figure 3B). This result suggests that dACC does not signal predicted likelihood of stop trials per se, but instead encodes the amount of surprise associated with a stimulus based on predictions.
Figure 3. Model-based fMRI data analysis: coding of Bayesian surprise in the dACC.

(A) Hot color: medial prefrontal cortex, including dACC and pre-SMA, as well as a cluster that includes the thalamus, epithalamus and regions in the midbrain, are more activated during stop trials than go trials (p < 0.05, corrected for multiple comparisons, FWE). Violet color: the contrast of parametric modulators P (stop) of go trials – P (stop) of stop trials identifies a small cluster in the dACC (675 mm3, peak MNI coordinates [−3 14 40], Z-score=4.67), bordering SMA, to be more positively modulated by P(stop) in go trials than in stop trials. T-value maps contrasts are overlaid on structural images in sagittal section, and color bar represents voxel T-values (n=66). (B) Effect size of the parametric modulators P(stop) of dACC masks across 66 subjects (constructed using the first GLM), based on leave-six-out cross-validation. The dACC activity is positively modulated by P(stop) during go trials and negatively modulated during stop trials (p<0.0078 and p<0.0041, respectively). (C) Top: Bayesian model simulation of surprise, ∣outcome – P(stop)∣, for trials with low and high prior P(stop), each for go (positive correlation) and stop (negative correlation) trials. Bottom: average percentage signal change (PSC) of dACC activity for go and stop trials across subjects for the second general linear model. The dACC masks are obtained using the first GLM, followed by a ROI analysis with leave-six-out cross-validation. There is significant increase of dACC activity for different bins across subject in go trials (paired t-test, T = 2.004, p = 0.049); there is a significant decrease in stop trials (paired t-test, T = 2.662, p = 0.010). We use MarsBaR to compute the PSC in the regions of interest (ROI): http://marsbar.sourceforge.net/.
Table 1.
Brain regions significantly modulated by Bayesian predictions of P(stop) during go as compared to stop trials (p<0.0001, uncorrected, extent > 12 voxels).
| Cluster size (mm3) |
Z- Value |
MNI coordinate (mm) | Side | Identified brain region | ||
|---|---|---|---|---|---|---|
| x | y | z | ||||
| 3,726 | 5.60 | −54 | −40 | 37 | L | Inferior parietal lobule |
| 675 | 4.52 | −3 | 14 | 40 | L | Dorsal anterior cingulate cortex (dACC) |
| 1,269 | 4.45 | 60 | −31 | 37 | R | Inferior parietal lobule |
To better visualize the close relation between our model predictions of Bayesian surprise and dACC fMRI response, we constructed GLM2, where, instead of directly using P(stop) as parametric modulator, we divided the go and stop trials into two bins according to P(stop): low and high. We computed the regressor’s coefficients and performed the ROI analysis with leave-six out cross validations. This analysis shows that the dACC cluster (Figure 3A) correlates positively with P(stop) on go trials, and negatively with P(stop) on stop trial, just as predicted by the Bayesian model (Figure 3C). Note that dACC activation is not correlated with SPE related to P(stop), which would be negatively correlated with P(stop) on both go trials (0 – P(stop)) and stop trials (1 – P(stop)).
dACC encoding of signed prediction error related to error likelihood
We next examined whether, in addition to encoding Bayesian surprise related to stimulus outcome, dACC serves some role related to error processing, as previously it has been implicated in error monitoring (Holroyd et al., 2004) and error anticipation (Botvinick et al., 2001; Brown and Braver, 2005; Alexander and Brown, 2010), and post-error slowing of go RT is often found in the stop-signal task (Li et al., 2008a). Our optimal-Bayes decision model (Shenoy and Yu, 2011) offers no normative reason why there ought to be post-error slowing (slowing does not help with doing better in the task, beyond post-stop slowing), instead predicting it as an indirect consequence of errors being more common on stop trials, and stop trials having the immediate effect of elevating anticipated P(stop), which causes slowing (Figure 2A). As expected, once we regressed out the effect of P(stop), there was no direct effect of anticipated error likelihood, P(error), on go RT (R2=0.03, p=0.17, Figure 4B). However, in case this null result is due to our model being mis-specified, or the brain implementing essentially non-Bayesian processes, we also regressed go RT directly against error/correct on last trial (1: error, 0: correct), and found no significant correlation (R2<0.01, p>0.05 for all) after regressing out the effects of P(stop). In contrast, there is significant residual correlation between go RT and P(stop), after go RT is first regressed against P(error) (R2=0.70, p<10−10, Figure 4A). Go RT also significantly depends on P(stop), after regressing out error on previous trial (mean R2=0.19, p<0.05 for all subjects). This model-free analysis excludes the possibility of pure error-driven slowing, beyond an indirect effect of post-stop slowing, as the result does not depend on our particular model parameterization for generating P(error). These results indicate that that post-error slowing in the stop-signal tasks are due to subjects’ strategically slowing down after stop trials, and not due to errors per se. Of course, this finding does not preclude errors directly effecting slowing in other cognitive tasks.
Analogous to the behavioral results, we found that dACC was not positively correlated with P(error) (p>0.05, uncorrected) or with Bayesian surprise (UPE) related to P(error) (contrast SuccessP(error)>ErrorP(error)) in GLM1. These results directly contradict the error likelihood hypothesis (Brown and Braver, 2005). The lack of dACC activation in response to the UPE related to P(error) suggests that dACC encoding of Bayesian surprise is specific to stimulus uncertainty.
However, we did find that the small dACC ROI (Figure 5A, magenta) resides in a large cluster that is robustly anti-correlated with P(error) (contrast (Stop+Go)P(error)<0, MNI coordinates [−3 14 40], T-value=4.53, p<0.0001, uncorrected, Figure 5A, yellow) and shows a main effect of response outcome (contrast SE>SS, Figure 5A, green). These results suggest the hypothesis that dACC specifically encodes SPE related to P(error), as the SPE is anti-correlated for both error (1 – P(error)) and correct (0 – P(error)) trials, and should have a main effect of error over correct trials.
Figure 5. Association of the Bayesian surprise in the dACC with expectation of response and stimulus outcomes.

Statistical probability maps are obtained with p<0.0001, uncorrected, and are overlaid on structural images in sagittal, coronal, and axial sections. (A) GLM1 was used to model Bayesian surprise or unsigned prediction error (UPE) related to P(stop); four categorical types of trials were distinguished according to trial type and outcome: go success (GS), go error (GE), stop success (SS), and stop error (SE) trials. The probability of stop and error trials as estimated by the Bayesian model, or P(stop) and P(error), respectively, and the RT of GS trials were entered as parametric modulators in the model. (B) GLM3 was used to isolate activations related to prediction errors associated with response and stimulus outcomes (please see Material and Methods for details); a single categorical regressor comprised stimulus onset on all trials. Associated with this main regressor were four parametric modulators: Bayesian surprise or UPE of stop (∣stimulus outcome – P(stop)∣), signed prediction error (SPE) of error (response outcome – P(error)), stimulus outcome/conflict (stop=1, go=0), and response outcome (error=1, correct=0), with subsequent modulators orthogonalized with respect to previous ones. Clusters from GLM3 (magenta, blue and yellow colors) are mostly significant at p<0.05, corrected.
To examine whether dACC still responds to Bayesian surprise related to P(stop) after accounting for the negative correlation with P(error), we constructed GLM1*, identical to GLM1 except for switching the order of P(stop) and P(error). We found that there was still significant response of the dACC cluster to both SPE related to P(error) and UPE related to P(stop) (p<0.001), and still no significant dACC response to error-related UPE (p>0.05).
Response to conflict and errors
While our data are highly suggestive of dACC encoding Bayesian surprise of stop, and SPE of error, it may still serves additional functions related to conflict situations that sometimes, but not always, correlate with Bayesian surprise and SPE of error -- e.g., sensory, motor, affective, learning, and other processes that may differ between stop and go trials, and between error and correct trials. We therefore constructed GLM3 that uses all trial onsets as a categorical regressor, and four parametric modulators in the following order -- Bayesian surprise related to stimulus outcome ∣stimulus outcome – P(stop)∣, SPE related to P(error) (response outcome – P(error)), stimulus outcome (stop=1, go=0), and response outcome (error=1, correct=0) -- with each regressor orthogonalized with respect to those that come before. We found that the dACC cluster encoding Bayesian surprise (Figure 5B, magenta line, from GLM1) has no residual correlation with stop trial/conflict occurrence (Figure 5B, blue), nor with response outcome (error/correct) (p<0.01, uncorrected). Instead, as expected, there is a robust response in this dACC cluster, along with a broader medial frontal cortical area (Figure 5B, magenta) that responds to UPE (Bayesian surprise) of stop (stimulus outcome). Also as expected, there is a large medial superior frontal cortical area (Figure 5B, yellow) that encodes SPE of error (response outcome), which includes the dACC cluster. Note that due to the order of the regressors, these contrasts activate not only those areas encoding UPE of stop and SPE of error, but also areas with strong response to stimulus (Figure 3A, hot) or response (Figure 5A, green) outcome, as they are correlated quantities. The purpose of GLM3 was to examine whether there is any additional dACC response to stop trials or error responses after accounting for the prediction errors. There was not. Recall that in contrast, dACC robustly responds to these prediction errors even after regressing out the effects of error and stop (GLM1 and GLM1*).
Discussion
Overall, there are four main findings of the model-based fMRI data analysis: (1) dACC encodes Bayesian surprise (UPE) specifically related to stimulus outcome, but not related to errors, (2) dACC encodes SPE related to response outcome, but not related to stimulus type, (3) once accounting for these factors, dACC does not explicitly respond to conflict, as predicted by the conflict monitoring hypothesis (Botvinick et al., 2001), or to error likelihood, as predicted by the error likelihood hypothesis (Brown and Braver, 2005), (4) dACC performs the comparator operations but does not directly encode probabilistic expectations of either stimulus type or response outcome, which is probably done elsewhere in the medial frontal cortex. Intriguingly, our results suggest that dACC specifically encodes UPE related to stimulus uncertainty and SPE related to response outcome (and implicitly, reward-related) uncertainty. This may explain results elsewhere implicating dACC in UPE and SPE encoding in different contexts. For instance, in the cued Stroop study of Aarts et al. (Aarts et al., 2008), an explicit cue was given before each trial indicating whether the stimulus will be low, high, neutral conflict, or random (uninformative). dACC responds to the predictive cues, but after the informative cues, dACC activities did not distinguish the actual conflict level of those trials (Kennerley et al., 2006). One possible interpretation of the dual role of dACC in reporting UPE and SPE is that the fMRI BOLD response is mixing signals from functionally distinct subpopulations of neurons. Indeed, neural recording studies have shown different sub-populations of dACC neurons to be encoding history-dependent reward expectations and prediction errors (Seo and Lee, 2007; Kennerley et al., 2011), and not in post-error adjustments. Enhanced macaque dACC response have also been found in tasks when the outcome was surprising, for both large and small rewards, regardless of the prediction error valence (Hayden et al., 2011). Future work is needed to disentangle the precise functional role of different subpopulations of dACC neurons.
We reconcile our results with previous findings implicating dACC in conflict monitoring and error anticipation with the interpretation that high-conflict or error events, by construction or design, tend to be relatively rare, resulting in a high level of unsigned prediction error and therefore dACC activity. A common way of inducing conflict is to “surprise” subjects with an unusual event or task, whether by first establishing a frequently-occurring primary task (e.g. go stimulus processing in the stop-signal task) and then imposing a rare conflict event (e.g. stop signal), or presenting an unusual stimulus that violates natural scene statistics (e.g. Eriksen task, see (Yu et al., 2009)), or requiring the subject to perform an unusual task on a common stimulus typically processed in a different way (e.g. Stroop task). In particular, for the Eriksen task, our previous computational model (Yu et al., 2009) showed that the influence of compatibility on choice behavior is consistent with a persistent prior bias in believing in the compatibility of stimulus and flankers. This surprisal reinterpretation of conflict is supported by recent neuronal recordings in the monkey ACC that find neurons that encode various kinds of prediction errors, and none that specifically cares about conflict (Ito et al., 2003; Mansouri et al., 2009).
It has also been proposed that dACC participates in predicting action outcomes (Rushworth et al., 2004; Ullsperger et al., 2007; Alexander and Brown, 2010). For example, Alexander and Brown (Alexander and Brown, 2010) suggested a reinforcement-based model to explain the medial prefrontal cortex (including the dACC) as an action-outcome predictor, whether good or bad. However, our results indicate that dACC is not only involved in action outcome prediction, since the probability of encountering a stop trial in the stop signal task is not contingent on subjects’ actions. Our results are consistent with the more general interpretation that dACC participates in strategic behavioral adjustments, based on a Bayesian environment expectation updating procedure, not only restricted to representing or learning action-outcome contingencies.
Along a somewhat different line, it has been suggested that dACC encodes a volatility signal that correlates with how rapidly statistical contingencies in the external world change over time (Behrens et al., 2007). Note that this result is also consistent with the Bayesian surprise hypothesis, since in a highly volatile environment, the observer is likely to encounter many unexpected changes and therefore the dACC should on average be more active in this context than in a less volatile environment. Due to sluggishness of the BOLD signal, animal neural recording studies may be necessary to tease apart the faster-timescale state prediction error signal and the slower-timescale volatility variable.
In this study, due to the nature of the stop-signal task, we examined dACC encoding of what are essentially state prediction errors, or violations of prediction related to stimulus or abstract states, and not rewards, which are important for Bayesian learning or model-based reinforcement learning; it contrasts with reward prediction error, important for model-free reinforcement learning and putatively encoded in the striatal dopaminergic system (O’Doherty et al., 2004; Seymour et al., 2004). A recent study (Glascher et al., 2010) found correlates of SPE in the intraparietal sulcus and dorsolateral prefrontal cortex, but not in the dACC, in contrast to our findings. However, that study also did not report reward prediction error in dACC, in contrast to other studies (Ito et al., 2003; Hayden et al., 2011). This raises the possibility that the task or data analysis in Glascher et al. (Glascher et al., 2010) may not be optimized for examining dACC contributions.
In summary, we conclude that the dACC encodes a Bayesian surprise signal associated with behaviorally critical events, as well as a signed prediction error related to response outcome. This ability of the dACC to signal discrepancies between expectations and actual outcomes allow it to play a powerful role in behavioral adaptation, as it allows the brain to dynamically and flexibly update internal expectations of behaviorally relevant events and outcomes; it may also play an important computational role in the allocation of selective attention in learning and perception. Understanding exactly how these functions of the dACC interact, and subserve broader cognitive processes, remains an important challenge for future work.
Acknowledgements
We thank P. Dayan, J. O’Doherty and E. Vul for critical feedbacks during the manuscript preparation. This study was supported by NIH grants R01DA023248, K02DA026990, R21AA018004 to C.-S.L., Young Researcher Award (Sao Paulo Research Foundation FAPESP 2011/08573-4) to J.S.I.; it was supported by a Hellman Fellowship to A.J.Y. and an ARL CAN CTA grant to a consortium including A.J.Y.
References
- Aarts E, Roelofs A, van Turennout M. Anticipatory activity in anterior cingulate cortex can be independent of conflict and error likelihood. J Neurosci. 2008;28:4671–4678. doi: 10.1523/JNEUROSCI.4400-07.2008. [DOI] [PMC free article] [PubMed] [Google Scholar]
- Alexander WH, Brown JW. Competition between learned reward and error outcome predictions in anterior cingulate cortex. Neuroimage. 2010;49:3210–3218. doi: 10.1016/j.neuroimage.2009.11.065. [DOI] [PMC free article] [PubMed] [Google Scholar]
- Andersson JL, Hutton C, Ashburner J, Turner R, Friston K. Modeling geometric deformations in EPI time series. Neuroimage. 2001;13:903–919. doi: 10.1006/nimg.2001.0746. [DOI] [PubMed] [Google Scholar]
- Ashburner J, Friston KJ. Unified segmentation. Neuroimage. 2005;26:839–851. doi: 10.1016/j.neuroimage.2005.02.018. [DOI] [PubMed] [Google Scholar]
- Battaglia PW, Jacobs RA, Aslin RN. Bayesian integration of visual and auditory signals for spatial localization. J Opt Soc Am A Opt Image Sci Vis. 2003;20:1391–1397. doi: 10.1364/josaa.20.001391. [DOI] [PubMed] [Google Scholar]
- Behrens TE, Woolrich MW, Walton ME, Rushworth MF. Learning the value of information in an uncertain world. Nat Neurosci. 2007;10:1214–1221. doi: 10.1038/nn1954. [DOI] [PubMed] [Google Scholar]
- Botvinick MM, Braver TS, Barch DM, Carter CS, Cohen JD. Conflict monitoring and cognitive control. Psychol Rev. 2001;108:624–652. doi: 10.1037/0033-295x.108.3.624. [DOI] [PubMed] [Google Scholar]
- Brett M, Anton JL, Valabregue R, Poline JB. Region of interest analysis using an SPM toolbox (abstract). 8th International Conference on Functional Mapping of the Human Brain; Sendai, Japan. 2002. [Google Scholar]
- Brown JW, Braver TS. Learned predictions of error likelihood in the anterior cingulate cortex. Science. 2005;307:1118–1121. doi: 10.1126/science.1105783. [DOI] [PubMed] [Google Scholar]
- Buchel C, Holmes AP, Rees G, Friston KJ. Characterizing stimulus-response functions using nonlinear regressors in parametric fMRI experiments. Neuroimage. 1998;8:140–148. doi: 10.1006/nimg.1998.0351. [DOI] [PubMed] [Google Scholar]
- Cho RY, Nystrom LE, Brown ET, Jones AD, Braver TS, Holmes PJ, Cohen JD. Mechanisms underlying dependencies of performance on stimulus history in a two-alternative forced-choice task. Cogn Affect Behav Neurosci. 2002;2:283–299. doi: 10.3758/cabn.2.4.283. [DOI] [PubMed] [Google Scholar]
- Daw ND, O’Doherty JP, Dayan P, Seymour B, Dolan RJ. Cortical substrates for exploratory decisions in humans. Nature. 2006;441:876. doi: 10.1038/nature04766. [DOI] [PMC free article] [PubMed] [Google Scholar]
- Dayan P, Daw ND. Connections between computational and neurobiological perspectives on decision making. Cognitive Affective Behavioral Neuroscience. 2008;8:429–453. doi: 10.3758/CABN.8.4.429. [DOI] [PubMed] [Google Scholar]
- Dayan P, Kakade S, Montague PR. Learning and selective attention. Nat Neurosci. 2000;3(Suppl):1218–1223. doi: 10.1038/81504. [DOI] [PubMed] [Google Scholar]
- Duvernoy HM. The human brain. 2nd Edition Springer-Verlag; Wien, Austria: 2003. [Google Scholar]
- Emeric EE, Brown JW, Boucher L, Carpenter RH, Hanes DP, Harris R, Logan GD, Mashru RN, Pare M, Pouget P, Stuphorn V, Taylor TL, Schall JD. Influence of history on saccade countermanding performance in humans and macaque monkeys. Vision Res. 2007;47:35–49. doi: 10.1016/j.visres.2006.08.03. [DOI] [PMC free article] [PubMed] [Google Scholar]
- Ernst MO, Banks MS. Humans integrate visual and haptic information in a statistically optimal fashion. Nature. 2002;415:429–433. doi: 10.1038/415429a. [DOI] [PubMed] [Google Scholar]
- Friston KJ, Ashburner J, Frith CD, Poline JB, Heather JD, Frackowiak RSJ. Spatial registration and normalization of images. Human Brain Mapping. 1995;3:165–189. [Google Scholar]
- Glascher J. Visualization of group inference data in functional neuroimaging. Neuroinformatics. 2009;7:73–82. doi: 10.1007/s12021-008-9042-x. [DOI] [PubMed] [Google Scholar]
- Glascher J, Daw N, Dayan P, O’Doherty JP. States versus rewards: dissociable neural prediction error signals underlying model-based and model-free reinforcement learning. Neuron. 2010;66:585–595. doi: 10.1016/j.neuron.2010.04.016. [DOI] [PMC free article] [PubMed] [Google Scholar]
- Hayden BY, Heilbronner SR, Pearson JM, Platt ML. Surprise signals in anterior cingulate cortex: neuronal encoding of unsigned reward prediction errors driving adjustment in behavior. J Neurosci. 2011;31:4178–4187. doi: 10.1523/JNEUROSCI.4652-10.2011. [DOI] [PMC free article] [PubMed] [Google Scholar]
- Holroyd CB, Nieuwenhuis S, Yeung N, Nystrom L, Mars RB, Coles MG, Cohen JD. Dorsal anterior cingulate cortex shows fMRI response to internal and external error signals. Nat Neurosci. 2004;7:497–498. doi: 10.1038/nn1238. [DOI] [PubMed] [Google Scholar]
- Hutton C, Bork A, Josephs O, Deichmann R, Ashburner J, Turner R. Image distortion correction in fMRI: A quantitative evaluation. Neuroimage. 2002;16:217–240. doi: 10.1006/nimg.2001.1054. [DOI] [PubMed] [Google Scholar]
- Ide JS, Li CS. A cerebellar thalamic cortical circuit for error-related cognitive control. NeuroImage. 2011;54:455–464. doi: 10.1016/j.neuroimage.2010.07.042. [DOI] [PMC free article] [PubMed] [Google Scholar]
- Ito S, Stuphorn V, Brown JW, Schall JD. Performance monitoring by the anterior cingulate cortex during saccade countermanding. Science. 2003;302:120–122. doi: 10.1126/science.1087847. [DOI] [PubMed] [Google Scholar]
- Jessup RK, Busemeyer JR, Brown JW. Error effects in anterior cingulate cortex reverse when error likelihood is high. J Neurosci. 2010;30:3467–3472. doi: 10.1523/JNEUROSCI.4130-09.2010. [DOI] [PMC free article] [PubMed] [Google Scholar]
- Kennerley SW, Behrens TE, Wallis JD. Double dissociation of value computations in orbitofrontal and anterior cingulate neurons. Nat Neurosci. 2011;14:1581–1589. doi: 10.1038/nn.2961. [DOI] [PMC free article] [PubMed] [Google Scholar]
- Kennerley SW, Walton ME, Behrens TE, Buckley MJ, Rushworth MF. Optimal decision making and the anterior cingulate cortex. Nat Neurosci. 2006;9:940–947. doi: 10.1038/nn1724. [DOI] [PubMed] [Google Scholar]
- Kording KP, Wolpert DM. Bayesian integration in sensorimotor learning. Nature. 2004;427:244–247. doi: 10.1038/nature02169. [DOI] [PubMed] [Google Scholar]
- Laming D. Autocorrelation of choice-reaction times. Acta Psychol (Amst) 1979;43:381–412. doi: 10.1016/0001-6918(79)90032-5. [DOI] [PubMed] [Google Scholar]
- Leotti LA, Wager TD. Motivational influences on response inhibition measures. J Exp Psychol Hum Percept Perform. 2009;36:430–447. doi: 10.1037/a0016802. [DOI] [PMC free article] [PubMed] [Google Scholar]
- Levitt H. Transformed up-down methods in psychoacoustics. J Acoust Soc Am. 1971;49(Suppl 2):467+. [PubMed] [Google Scholar]
- Li CS, Chao HH, Lee TW. Neural correlates of speeded as compared with delayed responses in a stop signal task: An indirect analog of risk taking and association with an anxiety trait. Cereb Cortex. 2009:839–848. doi: 10.1093/cercor/bhn132. [DOI] [PMC free article] [PubMed] [Google Scholar]
- Li CS, Huang C, Constable RT, Sinha R. Imaging response inhibition in a stop-signal task: neural correlates independent of signal monitoring and post-response processing. J Neurosci. 2006;26:186–192. doi: 10.1523/JNEUROSCI.3741-05.2006. [DOI] [PMC free article] [PubMed] [Google Scholar]
- Li CS, Huang C, Yan P, Paliwal P, Constable RT, Sinha R. Neural correlates of post-error slowing during a stop signal task: a functional magnetic resonance imaging study. J Cogn Neurosci. 2008a;20:1021–1029. doi: 10.1162/jocn.2008.20071. [DOI] [PMC free article] [PubMed] [Google Scholar]
- Li CS, Yan P, Chao HH, Sinha R, Paliwal P, Constable RT, Zhang S, Lee TW. Error-specific medial cortical and subcortical activity during the stop signal task: a functional magnetic resonance imaging study. Neuroscience. 2008b;155:1142–1151. doi: 10.1016/j.neuroscience.2008.06.062. [DOI] [PMC free article] [PubMed] [Google Scholar]
- Logan GD, Cowan WB, Davis KA. On the ability to inhibit simple and choice reaction time responses: a model and a method. J Exp Psychol Hum Percept Perform. 1984;10:276–291. doi: 10.1037//0096-1523.10.2.276. [DOI] [PubMed] [Google Scholar]
- Mai JK, Paxinos G, Voss T. Atlas of the human brain. 3rd Edition Academic Press; New York: 2008. [Google Scholar]
- Mansouri FA, Tanaka K, Buckley MJ. Conflict-induced behavioural adjustment: a clue to the executive functions of the prefrontal cortex. Nat Rev Neurosci. 2009;10:141–152. doi: 10.1038/nrn2538. [DOI] [PubMed] [Google Scholar]
- Martin LE, Potts GF, Burton PC, Montague PR. Electrophysiological and hemodynamic responses to reward prediction violation. Neuroreport. 2009;20:1140–1143. doi: 10.1097/WNR.0b013e32832f0dca. [DOI] [PMC free article] [PubMed] [Google Scholar]
- Nassar MR, Rumsey KM, Wilson RC, Parikh K, Heasly B, Gold JI. Rational regulation of learning dynamics by pupil-linked arousal systems. Nat Neurosci. 2012;15:1040–1046. doi: 10.1038/nn.3130. [DOI] [PMC free article] [PubMed] [Google Scholar]
- O’Doherty J, Dayan P, Schultz J, Deichmann R, Friston K, Dolan RJ. Dissociable roles of ventral and dorsal striatum in instrumental conditioning. Science. 2004;304:452–454. doi: 10.1126/science.1094285. [DOI] [PubMed] [Google Scholar]
- O’Doherty JP, Dayan P, Friston K, Critchley H, Dolan RJ. Temporal difference models and reward-related learning in the human brain. Neuron. 2003;38:329–337. doi: 10.1016/s0896-6273(03)00169-7. [DOI] [PubMed] [Google Scholar]
- Poldrack RA, Mumford JA. Independence in ROI analysis: where is the voodoo? Soc Cogn Affect Neurosci. 2009;4:208–213. doi: 10.1093/scan/nsp011. [DOI] [PMC free article] [PubMed] [Google Scholar]
- Rushworth MF, Walton ME, Kennerley SW, Bannerman DM. Action sets and decisions in the medial frontal cortex. Trends Cogn Sci. 2004;8:410–417. doi: 10.1016/j.tics.2004.07.009. [DOI] [PubMed] [Google Scholar]
- Schultz W, Dayan P, Montague PR. A neural substrate of prediction and reward. Science. 1997;275:1593–1599. doi: 10.1126/science.275.5306.1593. [DOI] [PubMed] [Google Scholar]
- Seo H, Lee D. Temporal filtering of reward signals in the dorsal anterior cingulate cortex during a mixed-strategy game. J Neurosci. 2007;27:8366–8377. doi: 10.1523/JNEUROSCI.2369-07.2007. [DOI] [PMC free article] [PubMed] [Google Scholar]
- Seymour B, O’Doherty JP, Dayan P, Koltzenburg M, Jones AK, Dolan RJ, Friston KJ, Frackowiak RS. Temporal difference models describe higher-order learning in humans. Nature. 2004;429:664–667. doi: 10.1038/nature02581. [DOI] [PubMed] [Google Scholar]
- Shenoy P, Yu AJ. Rational decision-making in inhibitory control. Front Hum Neurosci. 2011;5:48. doi: 10.3389/fnhum.2011.00048. [DOI] [PMC free article] [PubMed] [Google Scholar]
- Shenoy P, Rao R, Yu A. A rational decision making framework for inhibitory control. In: Lafferty CKIW J, Shawe-Taylor J, Zemel RS, Culotta A, editors. Advances in Neural Information Processing Systems (NIPS), Advances in Neural Information Processing Systems. 21 Edition MIT Press; 2011. pp. 2146–2154. [Google Scholar]
- Soetens E, Boer LC, Hueting JE. Expectancy or Automatic Facilitation? Separating Sequential Effects in Two-Choice Reaction Time. Journal of Experimental Psychology: Human Perception and Performance. 1985;11:598. [Google Scholar]
- Ullsperger M, Nittono H, von Cramon DY. When goals are missed: dealing with self-generated and externally induced failure. Neuroimage. 2007;35:1356–1364. doi: 10.1016/j.neuroimage.2007.01.026. [DOI] [PubMed] [Google Scholar]
- Yu A, Cohen J. Sequential effects: Superstition or rational behavior? In: Koller D, Schuurmans D, Bengio Y, Bottou L, editors. NIPS 2008, Advances in Neural Information Processing Systems. 21 Edition. MIT Press; Vancouver, British Columbia, Canada: 2009. pp. 1873–1880. [PMC free article] [PubMed] [Google Scholar]
- Yu AJ, Dayan P. Acetylcholine in cortical inference. Neural Netw. 2002;15:719–730. doi: 10.1016/s0893-6080(02)00058-8. [DOI] [PubMed] [Google Scholar]
- Yu AJ, Dayan P. Uncertainty, neuromodulation, and attention. Neuron. 2005;46:681–692. doi: 10.1016/j.neuron.2005.04.026. [DOI] [PubMed] [Google Scholar]
- Yu AJ, Dayan P, Cohen JD. Dynamics of attentional selection under conflict: toward a rational Bayesian account. J Exp Psychol Hum Percept Perform. 2009;35:700–717. doi: 10.1037/a0013553. [DOI] [PMC free article] [PubMed] [Google Scholar]