

Abstract
Presurgical language mapping for patients with lesions close to language areas is critical to neurosurgical decision-making for preservation of language function. As a clinical noninvasive imaging technique, functional MRI (fMRI) is used to identify language areas by measuring blood-oxygen-level dependent (BOLD) signal change while patients perform carefully timed language vs. control tasks. This task-based fMRI critically depends on task performance, excluding many patients who have difficulty performing language tasks due to neurologic deficits. On the basis of recent discovery of resting-state fMRI (rs-fMRI), we propose a “task-free” paradigm acquiring fMRI data when patients simply are at rest. This paradigm is less demanding for patients to perform and easier for technologists to administer. We investigated the feasibility of this approach in right-handed healthy control subjects. First, group independent component analysis (ICA) was applied on the training group (14 subjects) to identify group level language components based on expert rating results. Then, four empirically and structurally defined language network templates were assessed for their ability to identify language components from individuals’ ICA output of the testing group (18 subjects) based on spatial similarity analysis. Results suggest that it is feasible to extract language activations from rs-fMRI at the individual subject level, and two empirically defined templates (that focuses on frontal language areas and that incorporates both frontal and temporal language areas) demonstrated the best performance. We propose a semi-automated language component identification procedure and discuss the practical concerns and suggestions for this approach to be used in clinical fMRI language mapping.
Keywords: language mapping, independent component analysis (ICA), functional connectivity, “task-free” paradigm, task-based fMRI, resting-state networks (RSNs)
INTRODUCTION
Human language function is uniquely complex and critical for quality of life. Thus, surgical approaches to brain lesions within or close to the language functional areas must strongly weigh the risk of causing permanent language deficits against the potential benefits of resection. Pre or intraoperative language mapping techniques have been utilized to help guide surgical planning and intraoperative decision-making [Sanai et al., 2008]. The clinical gold-standard tests for language lateralization (intracarotid amytal or Wada test) and localization [electrocortical stimulation (ECS)] are now complemented by newer and less invasive techniques, such as functional magnetic resonance imaging (fMRI). With relatively new clinical acceptance, fMRI is rapidly being adopted as a presurgical brain mapping technique. Conventional language fMRI requires the patient to perform a series of language tasks (e.g., object naming, word generation and categorization, etc.) implemented as blocked or event-related paradigms. Task-based fMRI measures cerebral blood flow as a surrogate for neuronal activity by comparing blood-oxygen-level dependent (BOLD) signal changes between the task state and a control or baseline state. This BOLD signal change is very small, on the order of 0.5% to 5% [Bandettini et al., 1992], therefore, many (dozens) of trials must be performed by the patient and then subjected to statistical analysis to obtain an acceptable signal-to-noise ratio. It has been shown that task-based language fMRI is concordant with the gold-standard tests [Binder et al., 1996; Roux et al., 2003; Stippich et al., 2007; Suarez et al., 2009], however, there remain concerns regarding its effectiveness compared with ECS [Giussani et al., 2010]. In addition, because the tasks are relatively demanding for patients to perform and the output is highly dependent on adequate task performance, fMRI in its present form is suboptimal for neurosurgical planning applications [Bookheimer, 2007]. Patients who cannot perform the task due to aphasias or cognitive deficits are usually excluded from the test, while these are often the patients for whom localization of language areas is most critical for surgical planning. Furthermore, task-based fMRI requires specially trained personnel for designing and administering task paradigms; and due to high variability in the behavioral task design and scanning parameters, it is difficult to standardize, evaluate, and validate this technique across institutions [Bookheimer, 2007; Tharin and Golby, 2007].
To overcome the limitations of task-based language fMRI, we propose a “task-free” paradigm acquiring fMRI data while patients are at rest while awake and lying still in the scanner. This idea is based on the recent discovery that the low frequency (<0.1 Hz) BOLD signal acquired during resting condition indicates coherent activities within distinct functional networks [Auer, 2008; Biswal et al., 2010; Fox and Raichle, 2007], including language system [Binder et al., 1999; Cordes et al., 2000; Hampson et al., 2002]. This spontaneous low-frequency fluctuation (LFF) of BOLD signal is hypothesized to reflect unconstrained cognitive processes during rest [Buckner et al., 2008; Rosazza and Minati, 2011]. In addition, since the resting-state networks (RSNs) are largely independent of the level of consciousness [Horovitz et al., 2008; Kiviniemi et al., 2005], it is speculated that its functional role is to maintain and coordinate neuronal activities across regions that commonly work together throughout daily tasks [Fox and Raichle 2007; Rosazza and Minati 2011]. This leads to our hypothesis that the LFF of individuals’ language networks is highly correlated during resting condition, and thus could be revealed from resting-state fMRI (rs-fMRI) by applying functional connectivity analysis techniques. Compared with task-based fMRI, rs-fMRI is less-demanding, and could be used in those patients who cannot satisfactorily perform language tasks due to neurologic deficits. It also makes paradigm design, implementation, and test administration much easier potentially enabling more wide clinical deployment. In addition, such an approach could potentially identify more regions of the language network while removing the effects of task selection which usually constrain fMRI interpretation [Bookheimer, 2007].
In this study, our first goal is to explore the feasibility of extracting language network from rs-fMRI using a data-driven functional connectivity analysis technique, independent component analysis (ICA), at the individual subject level, in order to build the theoretical basis for our proposed task-free language mapping fMRI paradigm. Our second goal is to assess the effectiveness of a series of “language network templates” that can be used for identification of language components from individual subjects’ ICA output.
MATERIAL AND METHODS
Subjects and Image Acquisition
Thirty-four healthy subjects were enrolled in this study. All subjects were native English speakers, and strongly right-handed as determined by the Edinburgh Handiness Inventory [EHI score = 87 ± 14 (mean ± SD)] [Oldfield, 1971]. All subjects had no history of neurologic or cognitive disorders, nor any speech, hearing, or vision deficits. The first 16 subjects were assigned to a training group, however, two subjects were excluded from the study due to large head motion (> 2 mm in any direction of translation) during resting-state fMRI acquisition, leaving 14 subjects in the training group (six males, mean age = 26.9 years, range: 20–36 years). The remaining 18 subjects were assigned to a testing group (10 males, mean age = 26.1 years, range: 19–39 years). The study protocol was approved by the Partners Institutional Review Board, and all subjects provided written informed consent.
MR images were obtained using a 3.0 Tesla GE Signa system (General Electric, Milwaukee, WI, USA). BOLD functional images were acquired from 27 axial slices using single-shot gradient-echo echo-planar imaging (EPI) and a standard quadrature head coil (TR/TE = 2,000/40 ms, flip angle = 90°, slice gap = 0 mm, FOV = 25.6 cm, acquisition matrix = 80 × 80, reconstruction matrix = 128 × 128, voxel size = 2 × 2 × 4 mm3, ascending interleaved sequence). Whole brain T1-weighted axial 3D spoiled gradient recalled (SPGR) structural images were acquired using array spatial sensitivity encoding technique (ASSET, i.e., parallel imaging) and an eight-channel head coil (TR/TE = 7.8/3.0 ms, flip angle = 20°, acquisition matrix = 256 × 256, reconstruction matrix = 512 × 512, voxel size = 0.5 × 0.5 × 1 mm3, 176 slices).
Behavioral Paradigm
Subjects of different groups (training or testing groups) underwent different set of functional runs during one scanning session. The training group performed two functional runs: a 7 min 10 sec resting-state fMRI (rs-fMRI) with eyes-closed condition and a 5 min 20 sec rapid event-related conventional task-based language fMRI (vocalized antonym-generation task, as reported in our previous studies [Suarez et al., 2008; Tie et al., 2009]). The testing group performed six functional runs, two of which were used in the current study: a 7 min 10 sec eyes-closed rs-fMRI, and a 7 min 10 sec blocked design language fMRI. The language fMRI consisted of seven 20 sec blocks of vocalized antonym-generation (“AG”, five words/block, each word presented for 2 sec with an interstimulus-interval of 2 sec) and seven 20 sec blocks of case-categorization (“CC”, five letter strings/block), during which the subject was asked to press a button to indicate if an orthographically irregular string (such as “VJFQG” or “vjfqg”) was composed of upper or lower case letters. The CC task was used as a high-level control condition to the AG task [Petersen et al., 1990; Price et al., 1996]. The AG and CC task blocks were interleaved with blocks of 10 sec fixation condition. The rs-fMRI was always administered before the task-based language fMRI to avoid possible task-induced changes to the resting-state network activities [Waites et al., 2005].
The stimulus paradigm was implemented using the Presentation software (Version 9.70, Neurobehavioral Systems Inc., Davis, CA, USA), and the visual stimuli were presented through MR-compatible video goggles (Resonance Technology, Los Angeles, CA, USA).
Data Preprocessing
After reconstruction of the raw functional data, the first five images (10 sec) of each run were discarded to allow stabilization of the BOLD signal. The functional data were preprocessed with rigid body motion correction by realigning to the session’s first functional image, and spatial smoothing using a 6 mm full-width half-maximum (FWHM) Gaussian kernel. For the purpose of group analysis, the training group data was further spatially normalized into the Montreal Neurological Institute (MNI) space, and resampled to 2 × 2 × 2 mm3 voxel size. The preprocessing procedure was performed using the Statistical Parametric Mapping software (SPM5, Wellcome Department of Cognitive Neurology, London, UK).
Group ICA Analysis of the Training Group Resting-State fMRI Data
A group ICA analysis procedure was applied to the training group rs-fMRI data using the Group ICA of fMRI Toolbox software (GIFT, Olin Neuropsychiatry Research Center, Hartford, CT, USA), in an effort to empirically construct spatial templates that can be used in identifying language components from individual subjects’ rs-fMRI ICA output. The number of independent components was estimated as 44 based on the minimum description length (MDL) criterion [Li et al., 2007], and a two-step dimension reduction based on principal component analysis (PCA) was performed. First, each subject’s data was reduced from 210 to 44 dimensions; then, the reduced data of all 14 subjects were concatenated and further reduced from 616 (44 × 14) to 44 dimensions. Then 44 group components were estimated from the reduced data using the Infomax algorithm of ICA [Bell and Sejnowski, 1995]. To derive reliable components, the ICA algorithm was run 20 times with random initial conditions using the Icasso toolbox [Himberg et al., 2004], and the centrotype estimate (i.e., the estimate close to the centroid of the estimate-cluster) was used as the final results. Finally, the components’ spatial maps were converted into z-score maps, and thresholded at z ≥ 1.
To identify the group components that represent language network activations, five clinical neuroscience experts (three neurosurgeons and two neuroradiologists) visually inspected the 44 component maps independently, and decided which functional or structural areas each component represented by assigning it into one of the following categories: language-related, visual, auditory, motor areas, default mode network (DMN), white matter, ventricles (or CSF), artifact (e.g., head motion, vascular effect, etc.), and other areas. The experts were also asked to indicate the confidence level of their rating based on a 1–5 Likert scale [Likert, 1932] [(1) “most confident”; (2) “confident”; (3) “unsure”; (4) “questionable”; (5) “not confident at all”]. The expert rating results revealed two group components that were unanimously rated as representative of language network activations, with median confidence level of 1 and 2, respectively, and therefore were selected as “group language components” (Fig. 1). The first component (“frontal component, ” shown in red) indicated dominant activations in putative language areas in the left frontal cortex, with minor activations in their right-hemisphere homologues and left temporal areas. The second component (“temporal component, ” shown in yellow) indicated dominant activations in putative language areas in the left temporal/parietal regions, with minor activations in their right-hemisphere homologues. Table I details the activated clusters, including cluster size, brain regions, Brodmann Areas (BAs), and MNI coordinate of the peak voxel.
Figure 1.
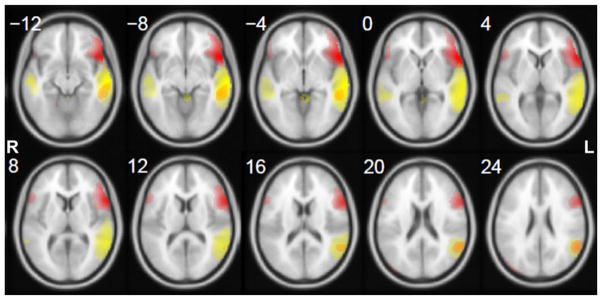
Spatial maps of the two group language components derived from training group rs-fMRI. Red: “frontal component”; yellow: “temporal component. ” Component z-maps are thresholded at z ≥ 1, and all images are in radiological convention.
TABLE I.
Two expert-selected group language components derived from training group rs-fMRI ICA analysis
| L/R | Cluster size | Brain region | Brodmann area (BA) | Peak MNI coordinate |
|---|---|---|---|---|
| Language component 1: “frontal component” | ||||
| L | 5277 | Inferior/middle/superior frontal gyrus, superior/middle temporal gyrus, precentral gyrus, insula | 47/6/45/44/9/38/46/22/13/10/11/8/21 | −36, 20, −32 |
| 1302 | Superior/medial/middle frontal gyrus | 6/8 | −8, 34, 54 | |
| 536 | Superior temporal gyrus, supramarginal gyrus, inferior parietal lobule | 40/22/39 | −60, −56, 12 | |
| 514 | Middle temporal gyrus | 21 | −64, −28, −18 | |
| 335 | Superior/middle frontal gyrus | 9/10 | −28, 44, 26 | |
| R | 604 | Inferior/middle frontal gyrus, precentral gyrus, superior temporal gyrus | 45/47/44/38 | 46, 20, −18 |
| 337 | Superior/middle occipital gyrus, middle temporal gyrus, angular gyrus, cuneus, precuneus | 19/39 | 36, −92, 16 | |
| 41 | middle temporal gyrus | 21/20 | 44, −2, −32 | |
| Language component 2: “temporal component” | ||||
| L | 7048 | Middle/superior/inferior temporal gyrus, supramarginal gyrus, inferior parietal lobule, fusiform gyrus, insula, middle occipital gyrus | 21/22/39/40/37/38/20/42/19/13/41 | −46, 6, −40 |
| 203 | Parahippocampal gyrus | 30 | −2, −44, −12 | |
| 45 | Parahippocampal gyrus, hippocampus, amygdala | −28, −10, −26 | ||
| R | 1461 | Middle/superior/inferior temporal gyrus | 21/22 | 52, −18, −22 |
Generation of Language Network Templates
In an effort to find an optimal template for identification of language components from individual subjects’ ICA output, we constructed four “language network templates” (LNTs). The first three LNTs were defined as the binary mask images of the two training group-derived “group language components” (hence named as “frontal LNT” and “temporal LNT, ” respectively) as well as their union (“union LNT”). The fourth template (“structural LNT”) was created by selecting the anatomical regions of Broca’s and Wernicke’s areas that are commonly regarded as putative language areas of the right-handed control population [Binder et al., 1997]. We used the union of pars opercularis, pars triangularis, and pars orbitalis of the left inferior frontal gyrus (IFG) as Broca’s area, and the union of angular gyrus (AG), supramarginal gyrus (SMG), and the posterior half of superior temporal gyrus (post-STG) of the left temporal/parietal cortex as Wernicke’s area. These anatomical regions were constructed based on the Talairach Daemon database [Talairach and Tournoux, 1988], using the WFU Pick Atlas software (Version 1.04, Department of Radiology, Wake Forest University, Winston-Salem, NC, USA) [Lancaster et al., 1997, 2000; Maldjian et al., 2003, 2004].
Single Subject ICA Analysis of the Testing Group Resting-State fMRI Data
For each subject of the testing group, single subject ICA analysis was performed on the rs-fMRI data to reveal functionally connected networks. The MDL-estimated number of components ranged from 20 to 46 across the 18 subjects; 40 was selected as a fixed number for all subjects for consistency and also to avoid under- or over-fitting of the ICA procedure [Franco et al., 2009; Tie et al., 2008b]. After data reduction from 210 to 40 dimensions using PCA, 40 independent components were estimated using the Infomax algorithm [Bell and Sejnowski, 1995] with the Icasso toolbox [Himberg et al., 2004] (algorithm was run five times with random initial conditions, and the centrotype estimate was chosen as the final results). Then the components’ spatial maps were converted into z-score maps, and thresholded at z ≥ 2.
Sorting of Individual Subjects’ ICA Output Based on Similarity with LNTs
For each of the 40 estimated components of a testing subject, a goodness-of-fit (GOF) score was calculated using Eq. (1) to assess its spatial similarity with the subject-specific LNT:
| (1) |
where z̄in is the average z-score of the voxels within the LNT, z̄out is the average z-score of the voxels outside the LNT, and the difference between them is scaled by the maximum z-score in the component map (zmax). Since the more similar the component map to the LNT the higher the difference (z̄in − z̄out) would be, the GOF score represents the component’s similarity with the LNT. Note that the subject-specific LNTs were generated by reverse normalization on the training group-derived LNTs in the MNI space into the corresponding subject’s brain space [Tie et al., 2009]. Finally, to sort the components by their similarity with each LNT, their GOF scores were converted into z-scores and sorted in descending order.
Manual Selection of Individual Subjects’ Language Components by Experts
Manual selection of language components from each testing subject’s rs-fMRI ICA output was performed by the same group of five experts. To reduce the time and labor for visual inspection of a total of 720 components (40 components × 18 subjects), we first identified a series of “candidate language components” from each subject’s ICA output that satisfied the following criteria: (1) its GOF z-score with at least one LNT was higher than two, (2) more than half of its time course power was in the range of less than 0.1 Hz, consistent with the low-frequency characteristics of the RSNs [Auer, 2008], and (3) its Icasso-derived stability index was higher than 0.9, indicating high reliability of the component. For the 18 testing subjects, a total of 84 candidate language components were identified (range: 3–6 per subject), for which the experts visually inspected and indicated whether they felt it demonstrated language network activations (“yes’ or “no”), with a confidence level (1–5 Likert scale) of their rating indicated as well. There was no constraint on the number of language components that the expert could choose from a single subject’s ICA output. Statistical analyses were performed using the STATA software (StataCorp LP, College Station, TX, USA).
RESULTS
In this section, we first report the results from the training group data analyses, including reliability of the expert rating on the group components and comparison of language networks revealed from different paradigms at the group level. Then, we report the results from the testing group data analyses, including expert rating on the individual subjects’ candidate language components, comparison of the four LNTs for their effectiveness in identification of language components, and comparison of language networks revealed from different paradigms at the individual subject level.
Interrater Reliability of Expert Rating on Training Group ICA Output
To assess the interrater reliability of the expert rating on the training group ICA output, the free-marginal multi-rater kappa coefficient (κfree) was calculated [Brennan and Prediger, 1981; Randolph, 2005]. κfree is an alternative to Fleiss’ multirater kappa [Fleiss, 1971] and was used because the number of components assigned into each category was not restricted. A moderate agreement was achieved (κfree = 0.4170). As shown in Figure 1, two group components were unanimously rated as representative of the language network activations by the experts. The back-reconstructed individual subjects’ time courses of these two components were significantly correlated [Pearson’s r = 0.437 ± 0.049 (mean ± SD), 95% confidence interval: 0.331–0.543, P < 0.001]. These two group components were used as the basis for constructing LNTs for identification of language components from individual subjects’ ICA output.
Comparison of Language Networks Revealed From Resting-State and Task-Based Language fMRIs at the Group Level
Group level results from different paradigms in the training group were compared. For the event-related antonym generation language fMRI, a second-level random-effects analysis (RFX) was performed by one-sample t-test on the first-level single subject general linear model (GLM) results. Visual inspection of the resulting t-maps (Fig. 2) indicated that compared with the group language components revealed from resting-state fMRI (Fig. 1) the task-based language fMRI indicated more bilateral activation patterns in the frontal and temporal/parietal regions, as well as bilateral activations in the cingulate gyrus, thalamus, basal ganglia, and occipital visual areas.
Figure 2.
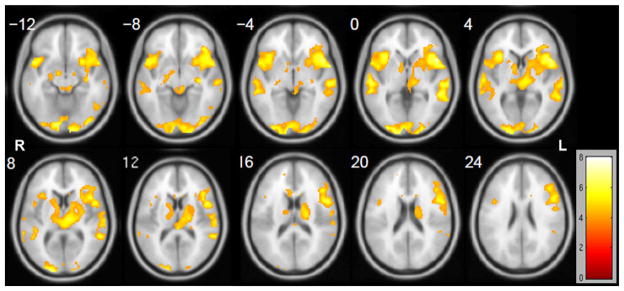
Results of training group second-level random effects analysis (RFX) of task-based language fMRI. One sample t-test results were thresholded at t ≥ 3.85 (P < 0.001, uncorrected), and all images are in radiological convention.
Expert Rating on Testing Group Individual Subjects’ ICA Output
The purpose of expert rating on the testing group individual subjects’ “candidate language components” was threefold. First, to investigate the interrater reliability of manually choosing language components by human raters; second, to explore the feasibility of extracting language network activity from single subjects’ rs-fMRI using ICA; and third, to establish a benchmark component for assessing the effectiveness of automated language component identification based on similarity with LNTs.
The overall interrater reliability of expert rating on the 84 candidate language components achieved moderate agreement (κfree = 0.4476). Figure 3 shows the expert rating results. From each subject’s ICA output, we identified a series of “consensus language components” (ConLCs) defined as the components that were rated as “language-related” by at least three of the five experts (i.e., the combination of red, green, and blue columns in Fig. 3), with a positive degree of confidence (i.e., median confidence level of 1–3). There were a total of 32 ConLCs across the 18 subjects (range: 1–4 per subject), with only one subject (#7) who had no ConLC and was therefore excluded from further analyses.
Figure 3.
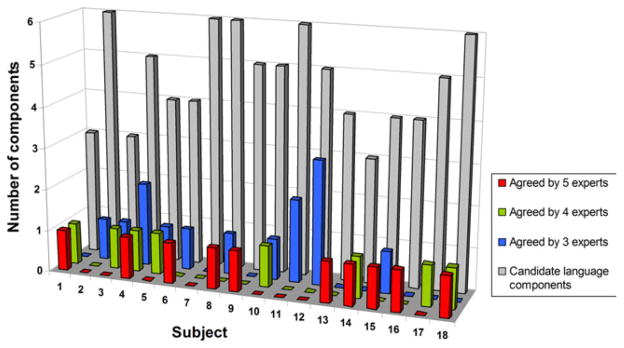
Expert rating results on 84 candidate language components of the 18 subjects in the testing group. For each subject, gray column indicates the number of candidate language components. Red, green, and blue columns represent the number of language components agreed upon by five, four, and three experts, respectively (i.e., “consensus language components”).
For each of the remaining 17 subjects, we defined a single expert-selected “reference language component” (RefLC) as a benchmark to assess the effectiveness of automated language component identification using LNTs. The ConLC that had the highest expert agreement or the one that was rated most confidently if there were multiple components agreed upon by the same number of experts was chosen as the RefLC. Results indicated that the RefLC of 10 subjects were unanimously agreed upon by the 5 experts with an average median confidence level of 1.55, the RefLC of four subjects were agreed upon by 4 out of 5 experts with an average median confidence level of 1.88, and the RefLC of three subjects were agreed upon by 3 out of 5 experts with an average median confidence level of 2.33.
Effectiveness of Automated Language Component Identification Based on Similarity with LNTs
To assess a LNT’s performance of automated identification of language components, the component that was highest ranked (i.e., having the highest GOF score with the LNT) was chosen as the template-selected language component. Then for each LNT, intermethod reliability was calculated by comparing the template-selected component with the expert-selected RefLC using Cohen’s Kappa coefficient [Cohen, 1960] (Table II). Results indicated that automated language component identification using the “frontal” and “union” templates highly agreed with expert rating results (κ = 0.6983 and 0.7587, respectively, P < 0.0001). On the other hand, automated identification using the “structural” (κ = 0.4570) and “temporal” (κ = 0.2760) templates only moderately and fairly agreed with expert rating results respectively.
TABLE II.
Results of intermethod agreement reliability (Cohen’s Kappa coefficient, κ) between template-selected and expert-selected language components
| Language network template (LNT) | κ coefficient (95% CI) | Agreement with expert rating |
|---|---|---|
| Frontal | 0.6983 (0.5007–0.8315) | 12/17 cases |
| Temporal | 0.2760 (0.1178–0.4753) | 5/17 cases |
| Union | 0.7587 (0.5674–0.8750) | 13/17 cases |
| Structural | 0.4570 (0.2636–0.6382) | 8/17 cases |
When the template-selected component was not in agreement with the expert-selected benchmark RefLC, we checked if the RefLC was among the top five components ranked by the corresponding LNT. Results indicated that for the “frontal, ” “union, ” and “structural” LNTs, the RefLC was among the top five components in 16 out of 17 cases. However, the “temporal” LNT performed the worst where the RefLC was not ranked among the top five components in 6 cases.
Performance of automated language component identification by each LNT was further assessed based on the percentage of an individual subject’s ConLCs identified among the top five ranked components, defined as per-ConLC using Eq. (2):
| (2) |
where ntop5 is the number of ConLCs among the top five ranked components and NtotalConLC is the total number of ConLCs, indicating the LNT’s ability of identifying the potential language components from individual subjects’ ICA output. Results of repeated-measures ANOVA of per-ConLC showed significant difference among the four LNTs [F(3,48) = 9.29, P = 0.0001]. Follow-up paired t-test indicated that the “temporal” LNT identified the least ConLCs among the top five ranked components [perConLC= 53.4 ± 9.2% (mean ± SE)] compared with the “frontal” LNT (perConLC = 97.1 ± 2.9%, t = 4.14, P = 0.0008), the “union” LNT (per-ConLC = 89.2 ± 6.5%, t = 3.94, P = 0.0012), and the “structural” LNT (perConLC = 90.7 ± 6.1%, t = 2.98, P = 0.0088). There was no significant difference between each pair of the perConLC results of the “frontal, ” “union, ” and “structural” LNTs (all P > 0.05).
We further compared the four LNTs based on the GOF scores of the expert-selected RefLC to the LNTs. Results of repeated-measures ANOVA indicated that there was no significant difference among the GOF scores at P < 0.05 level [F(3,48) = 2.73, P = 0.0541], although the RefLC demonstrated the highest mean GOF score with the “frontal” LNT.
Comparison of Language Networks Revealed From Resting-State and Task-based Language fMRIs at the Individual Subject Level
For each testing subject, quantitative comparison between the language networks revealed from different paradigms was performed based on the following three language maps: (1) the ICA-derived RefLC map from rs-fMRI (“RefLC map”), (2) a union map consisting of the activated voxels from all ConLCs maps from rs-fMRI (“ConLC map”), and (3) the GLM-derived t-map from the task-based language fMRI [“task t-map, ” contrast: AG vs. CC tasks, leniently thresholded at t ≥ 2.345 (P < 0.01, uncorrected)]. Figure 4 shows the language maps of an example subject (#5 in Fig. 3) who had two consensus language components.
Figure 4.
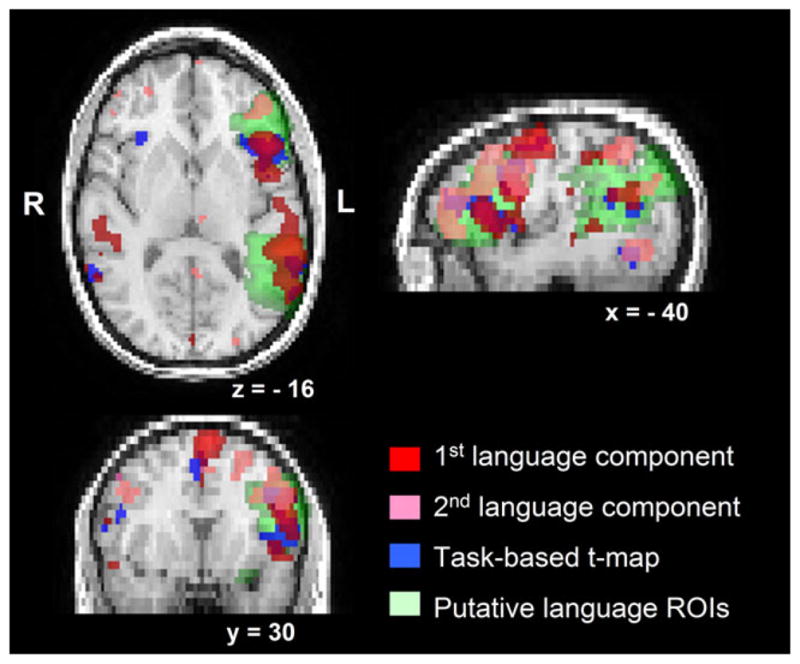
An example subject’s language maps derived from resting-state and task-based language fMRIs, overlaid on the structural images. This subject had two consensus language components (first and second language components shown in red and pink respectively). The “RefLC map” is the red map, the “ConLC map” is the union of the red and pink maps.
First, Dice coefficient (i.e., percentage overlap) [Fernandez et al., 2003] was calculated using Eq. (3) to assess spatial similarity between the language maps derived from different fMRI paradigms:
| (3) |
where VrsfMRImap and VtaskfMRImap are the number of the activated voxels in the rs-fMRI ICA map (“RefLC map” or “ConLC map”) and the language fMRI “task t-map” respectively, and Voverlap is the number of the activated voxels common to both maps. Dice coefficient was calculated in two ways: (1) using whole brain voxels, and (2) focusing on the voxels within putative language regions of interest (ROIs) only. The language ROIs were defined as anatomical regions consisting of Broca’s and Wernicke’s areas (same as individual subjects’ “structural” LNT). Figure 5 shows the results. For the whole brain Dice coefficient, results indicated a fair overlap between the language networks revealed from the two paradigms (Dice = 0.193 ± 0.107 (mean ± SD) between “RefLC map” and “task t-map”, Dice = 0.232 ± 0.105 between “ConLC map” and “task t-map”), without significant difference between the two Dice measurements (P > 0.05, paired t-test). For the language ROIs Dice coefficient, results indicated significantly increased overlap (Dice = 0.298 ± 0.158 between “RefLC map” and “task t-map”, Dice = 0.379 ± 0.149 between “ConLC map” and “task t-map”), compared to the whole brain results (t = 4.62, P < 0.001, and t = 8.26, P < 0.0001, paired t-test, respectively). Furthermore, compared with “RefLC map”, “ConLC map” had a significantly higher overlap with “task t-map” within language ROIs (t = 2.86, P < 0.05).
Figure 5.

Dice coefficient results calculated between language maps derived from resting-state and task-based language fMRIs. Results of paired t-test indicate that compared to the whole brain measurement, the putative language ROIs Dice measurement indicates higher overlap between resting-state language component maps and “task t-map” (P < 0.001 and P < 0.0001 for “RefLC” and “ConLC” respectively). Compared to “RefLC”, “ConLC” has higher Dice coefficient (within language ROI) with “task t-map” (P < 0.05).
Further, we quantitatively compared the language maps based on the number and percentage of the activated voxels located within putative language ROIs as an indication of their sensitivity and specificity to language area activations. The putative language ROIs were used as the ground truth. Table III indicates the comparison results. Results of repeated-measures ANOVA on the number of the activated voxels within language ROIs demonstrated significant difference among the three maps [F(2,32) = 10.09, P = 0.0004]. Follow-up paired t-tests indicated that “ConLC map” identified more activated voxels within language ROIs (mean = 2014) than “RefLC map” (mean = 1226, t = 5.40, P = 0.0001) and “task t-map” (mean = 1231, t = 3.42, P = 0.0035), while there was no significant difference between “RefLC map” and “task t-map” (t = 0.02, P = 0.9828). Results of repeated-measures ANOVA on the percentage of the activated voxels within language ROIs showed no significant difference among the three maps [F(2,32) = 0.14, P = 0.8688].
TABLE III.
Quantitative comparison of the sensitivity and specificity of the language maps derived from resting-state and task-based language fMRIs
| Language maps | Sensitivity (number of activated voxels within language ROIs) (mean ± SD) | Specificity (% of activated voxels within language ROIs) (mean ± SD) |
|---|---|---|
| RefLC map | 1226 ± 471 | 32.2 ± 8.9 |
| ConLC map | 2014 ± 698a | 31.1 ± 6.5 |
| task t-map | 1231 ± 611 | 30.9 ± 12.9 |
RefLC map: the ICA-derived “reference language component” map from the resting-state fMRI; ConLC map: the union map consisting of the activated voxels from all “consensus language components” from resting-state fMRI; task t-map: the GLM-derived t-map from the task-based language fMRI.
ConLC map reveals more voxels within putative language ROIs compared to RefLC map (t = 5.40, P = 0.0001, paired t-test) and task t-map (t = 3.42, P = 0.0035).
DISCUSSION
Recently, resting-state fMRI (rs-fMRI) has gained significant attention for the study of spontaneous brain activity, and its application to neurological diseases is emerging [Rosazza and Minati, 2011]. Compared with conventional task-based fMRI, rs-fMRI provides ease in paradigm design and administration, and is less-demanding for subjects to perform. The “task-free” nature of rs-fMRI is very attractive for presurgical mapping of functional brain areas, in which patients may have difficulties in understanding and performing behavioral tasks. There have been studies mapping sensory-motor systems using rs-fMRI [Liu et al., 2009; Shimony et al., 2009; Zhang et al., 2009], however, there has been no study on the potential application of rs-fMRI in mapping language networks. In this study, we explore the feasibility of extracting language networks from rs-fMRI in individual subjects using a data-driven ICA technique, and further assess effectiveness of automated identification of language components from ICA output based on similarity with the empirically and structurally defined language network templates (LNTs).
Feasibility of Mapping Individuals’ Language Networks using rs-fMRI
The challenge of our proposed approach of mapping individuals’ language networks using rs-fMRI lies in the complexity of human language function, which is demonstrated by the high variability of its functional region locations across individuals [Binder et al., 2009; FitzGerald et al., 1997; Ojemann, 1993]. Although Broca’s and Wernicke’s areas are regarded as putative language areas, there exists no consistent structural landmark for language networks [Rolls et al., 2007]. In particular, patients with brain pathology (tumor or epilepsy) may have unique lesion-induced rearrangements of functional cortical architecture [Carpentier et al., 2001; Duffau, 2005; Goldmann and Golby, 2005]. Therefore, an approach used in resting-state network definition for motor or sensory functions, placing a seed based on known landmarks and applying temporal correlation analysis [Biswal et al., 1995; Buckner et al., 2008; Vincent et al., 2006; Zhang et al., 2009], is not straightforward for language network definition.
Unlike temporal correlation-based approaches, ICA does not require any a priori information of the estimated signal and allows exploration of functionally connected brain networks by separating fMRI signal into spatially independent components, represented by spatial maps and corresponding time courses, using various algorithms [Hyvarinen and Oja, 2000; McKeown et al., 1998]. Brain areas in a specific component are regarded as belonging to a functionally connected network. ICA has been successfully applied to extract spatially independent features from task-based fMRI [Calhoun et al., 2001; McKeown et al., 1998; Seifritz et al., 2002; Tie et al., 2008a, b], as well as resting-state and natural-viewing fMRIs [Bartels and Zeki, 2005; Beckmann et al., 2005; Damoiseaux et al., 2006; De Luca et al., 2006; Greicius et al., 2009; van de Ven et al., 2004]. In this study, the data-driven nature of ICA makes it well suited for extracting the complex language networks from rs-fMRI data.
In this study, we used clinical neuroscience experts’ judgment on the ICA output as a ground truth for investigating the feasibility of mapping language networks using rs-fMRI. Interrater reliability analysis achieved a moderate agreement for both group and individual subjects’ components rating. At the group level, two left-lateralized components were rated as representative of language network activations by all five experts with high confidence, and therefore were used as basis for constructing LNTs. The “frontal component” indicates dominant activations in the left frontal and temporal putative language areas, including inferior/middle frontal gyrus, superior/middle temporal gyrus, supramarginal gyrus, and precentral gyrus. The “temporal component” indicates activations in more extensive regions in the left temporal/parietal cortex encompassing traditional Wernicke’s territory, as well as parahippocampal gyrus, hippocampus and amygdala. Similar components have been previously reported [Biswal et al., 2010; De Luca et al., 2006; Rosazza et al., 2011] but our findings are more lateralized to the left hemisphere (consistent with findings of [Smith et al., 2009]), which may explain the unanimous rating by the experts due to the leftward asymmetry of language activation patterns in a right-handed control population [Binder et al., 1997].
At the individual subject level, except for one subject, all subjects in the testing group had at least one component that was rated as “language-related” by most experts with high confidence [i.e., consensus language component (ConLC)]. For 10 of the remaining 17 testing subjects one component was unanimously chosen as the language component by the experts. Visual inspection of the ConLCs showed a preference towards left-lateralized components with the main activations in the frontal and/or temporal/parietal cortex. The less consistently rated ConLCs (i.e., agreed by three or four experts) included some nontrivial activations in areas not traditionally attributed to language networks. Although these ConLCs might express less language-specific activation patterns, we leniently accepted them as language components because sensitivity is more important in surgical planning to avoid harming critical language areas during surgery [Loring et al., 2002; Tie et al., 2008b]. Because language is a complex function and ICA is a data-driven technique, more than one component may be associated with language network activities. Our results supported this hypothesis since the mode of the number of ConLCs was two across the 17 subjects (10 subjects had two ConLCs, five subjects had one ConLC, one subject had three ConLCs, and one subject had four ConLCs, see Fig. 3). These results suggest that it is feasible to apply the ICA technique to separate the components representing language network activation patterns from individuals’ rs-fMRI data.
Identification of Language Components From Individuals’ rs-fMRI ICA Output
Because ICA is a data-driven analysis technique, it can be difficult to objectively interpret the cognitive significance of the estimated components [Hyvarinen and Oja, 2000]. Unlike task-based fMRI, where the degree of temporal correlation between the components’ time courses and the task timing can be used as a criterion to identify components of interest [Calhoun et al., 2001; McKeown et al., 1998; Tie et al., 2008a,b], there is no temporal information of the spontaneous neuronal activities during resting state. Therefore, component selection from rs-fMRI ICA output has relied on visual inspection of the component maps by human raters, and/or spatial correlation analysis between the component maps and specific templates of the network of interest (e.g., DMN templates). These templates are usually defined either structurally or empirically [Franco et al., 2009; Greicius et al., 2004; van de Ven et al., 2004].
In this study, in order to make our “task-free” language mapping approach practical and easy for its clinical applications, we aim at developing an initial automated language component identification procedure based on similarity analysis with spatial templates (i.e., LNTs). To this end, we performed a classification study by defining three empirical templates based on training group ICA results and one structural template based on putative language areas from a brain atlas, and evaluating their efficiency in language component identification using an independent testing group. Spatial similarity between an individual subject’s ICA output and the corresponding subject-specific LNTs were assessed using a goodness-of-fit measure. For each new testing subject, using the expert rating as the ground truth, effectiveness of the templates in identifying language components was assessed in two ways: first, intermethod agreement was evaluated between the template-selected top ranked component and the expert-selected RefLC; second, the percentage of total number of ConLCs that were ranked in the top five by each template was calculated. Results indicated that the top components picked by the “frontal” and “union” LNTs were in high agreement with the ground truth. In addition, these two LNTs were able to identify most ConLCs in their top ranked list. The “temporal” LNT, however, performed the worst compared with other LNTs by both analyses. These results indicate that the templates empirically derived from an independent group of subjects that focuses on left frontal language areas and that incorporates both left frontal and temporal language areas are able to effectively identify language components from a new subject’s rs-fMRI ICA output. By comparison, the template that shows language activation patterns in the temporal lobe alone and that is structurally defined based on putative language areas did not perform effectively in normal right-handed subjects. Comparison of the LNTs using the RefLC’s GOF score to the LNT indicated that the ground truth was the most similar to the “frontal” LNT, although the difference among the four LNTs did not reach statistical significance.
Comparison of Language Networks Revealed by Resting-State and Task-Based Language fMRIs
Language organization is far more complex than the traditional model that includes Broca’s and Wernicke’s areas and the pathways connecting these cortical regions, and the activation patterns revealed by task-based language fMRI are highly variable across different language tasks [Binder et al. 2009; Bookheimer, 2002, 2007]. Therefore, in this study, it is expected that there may not be a complete overlap of language networks revealed when subjects are at rest and when they are performing an antonym generation (AG) task, although critical language areas are expected to be identified by both paradigms. At the group level, the two paradigms revealed highly similar regions in the left frontal and temporal/parietal regions that are regarded as putative language areas in a right-handed control population. However, compared with the AG task-based fMRI, rs-fMRI revealed more left-lateralized and language-specific networks with less extraneous nonlanguage activations. For example, the AG task-based fMRI identified activations in the bilateral visual cortex that are responsible for processing visual aspects of the task stimuli, and cingulate gyrus that is likely associated with episodic memory and semantic retrieval [Binder et al., 2009]. This result could be attributed to ICA’s ability to separate BOLD signal into different components (e.g., visual area activations), while GLM identifies all areas with significant BOLD signal change induced by cognitive tasks.
At the individual subject level, the whole brain Dice coefficient between the rs-fMRI ICA map and the task t-map resulted in only fair overlap. However, when Dice coefficient was measured within the structurally defined putative language ROIs, overlap was increased significantly, with “ConLC map” having the highest overlap with the “task t-map”. Furthermore, using the putative language ROIs as the ground truth for all possible language-related activations, the “ConLC map” that combines all activated voxels from the consensus language components identified more language area activations. This suggests that the “ConLC map” is more sensitive to language activations, which is valuable for surgical planning to avoid false negatives. On the other hand, there was no significant difference in the percentage of the activated voxels that were within putative language areas among these maps, suggesting that they are similarly specific to language activations.
Proposed “Task-Free” fMRI Paradigm for Presurgical Language Mapping
Results of this study suggest that a two-step semi-automated language component identification procedure may provide the best strategy for our proposed rs-fMRI paradigm with ICA technique to be effective and efficient for surgical planning applications. The first step is an automated screening procedure on the individual patients’ rs-fMRI ICA output to identify the potential language components, based on spatial (the top five components ranked either by the “frontal” or “union” LNTs), temporal (the low-frequency components), and Icasso reliability (the components with high stability index) criteria. The second step is a manual expert selection procedure on the potential language components identified from the first step, resulting in one or two language components. The union of these selected component maps could be generated to provide neurosurgeons with a comprehensive language map.
When building the LNTs for the automated screening step, an alternative approach is to construct the weighted LNTs that highlight putative language areas by assigning a weighting factor to the voxels within Broca’s and Wernicke’s areas, similar to the method adopted by [Franco et al., 2009]. Our speculation is that our proposed strategy would not be improved significantly because by including the top five components ranked by the unweighted LNTs all potential language components would have been identified already.
Limitations of This Study
One of the aims of this study is to build the LNTs that could be used in the automated screening procedure. One obvious limitation of the LNTs that demonstrated the best performance (the “frontal” and “union” LNTs) is that they were constructed and assessed based on the results of groups of right-handed control subjects. Therefore, they may not be very effective in rs-fMRI analyses of left-handed subjects, and neurosurgical patients with mass lesions or whose language system expresses more variable organization or has reorganized partially or completely to the contralateral hemisphere [Bookheimer, 2007]. To overcome this limitation, we have constructed homologues of the templates by mirror projection to the right hemisphere [Propper et al., 2010] and assessed their performance as well (not reported). As expected, they demonstrated poor agreement with the expert rating results, and did not reveal any “consensus language components” among the top ranked components due to the fact that the subjects in this study were all strongly right-handed. In clinical practice, however, we suggest using four templates (i.e., the two best templates and their right-hemisphere homologues) to rank individual patients’ ICA output during the automated screening procedure to identify all potential language components.
Another limitation of this study is that the experts’ experience in rating the components could be a confounding factor to generating the ground truth. We asked the experts to indicate the confidence level for their rating and defined the ConLCs using a lenient criterion, in an effort to alleviate impact of the experts’ experience. In clinical practice, the automated screening procedure could serve as an objective approach to reduce human error, however, expert intervention by manually choosing the components representative of the complex language function from results of a data-driven approach seems inevitable.
It is noteworthy that the ultimate gold standard of this feasibility study would be to validate in neurosurgical patients, by comparing their rs-fMRI results with intraoperative language mapping results and postsurgical clinical outcomes.
CONCLUSIONS
In conclusion, we report the initial investigation of using resting-state fMRI to map individual subjects’ language areas for surgical planning purposes. Our results demonstrate the feasibility of this approach in right-handed healthy controls. The data-driven ICA technique is well suited for analyzing rs-fMRI, and the proposed semi-automated identification strategy proved to be effective in selection of language components from individual subjects’ ICA output. Effectiveness of this procedure needs further investigation in neurosurgical patients for this “task-free” paradigm to be useful in clinical applications.
Acknowledgments
Contract grant sponsor: The National Institute of Neurological Disorders and Stroke, The National Center for Research Resources, The National Institute of Biomedical Imaging and Bioengineering of the National Institutes of Health; Contract grant numbers: R21NS075728, P41EB015898, P41RR019703, P01CA067165; Contract grant sponsor: The Brain Science Foundation, The Klarman Family Foundation.
References
- Auer DP. Spontaneous low-frequency blood oxygenation level-dependent fluctuations and functional connectivity analysis of the ‘resting’ brain. Magn Reson Imaging. 2008;26:1055–1064. doi: 10.1016/j.mri.2008.05.008. [DOI] [PubMed] [Google Scholar]
- Bandettini PA, Wong EC, Hinks RS, Tikofsky RS, Hyde JS. Time course EPI of human brain function during task activation. Magn Reson Med. 1992;25:390–397. doi: 10.1002/mrm.1910250220. [DOI] [PubMed] [Google Scholar]
- Bartels A, Zeki S. Brain dynamics during natural viewing conditions -A new guide for mapping connectivity in vivo. Neuroimage. 2005;24:339–349. doi: 10.1016/j.neuroimage.2004.08.044. [DOI] [PubMed] [Google Scholar]
- Beckmann CF, DeLuca M, Devlin JT, Smith SM. Investigations into resting-state connectivity using independent component analysis. Philos Trans R Soc Lond B Biol Sci. 2005;360:1001–1013. doi: 10.1098/rstb.2005.1634. [DOI] [PMC free article] [PubMed] [Google Scholar]
- Bell AJ, Sejnowski TJ. An information-maximization approach to blind separation and blind deconvolution. Neural Comput. 1995;7:1129–1159. doi: 10.1162/neco.1995.7.6.1129. [DOI] [PubMed] [Google Scholar]
- Binder JR, Desai RH, Graves WW, Conant LL. Where is the semantic system? A critical review and meta-analysis of 120 functional neuroimaging studies. Cereb Cortex. 2009;19:2767–2796. doi: 10.1093/cercor/bhp055. [DOI] [PMC free article] [PubMed] [Google Scholar]
- Binder JR, Swanson SJ, Hammeke TA, Morris GL, Mueller WM, Fischer M, Benbadis S, Frost JA, Rao SM, Haughton VM. Determination of language dominance using functional MRI: A comparison with the Wada test. Neurology. 1996;46:978–984. doi: 10.1212/wnl.46.4.978. [DOI] [PubMed] [Google Scholar]
- Binder JR, Frost JA, Hammeke TA, Cox RW, Rao SM, Prieto T. Human brain language areas identified by functional magnetic resonance imaging. J Neurosci. 1997;17:353–362. doi: 10.1523/JNEUROSCI.17-01-00353.1997. [DOI] [PMC free article] [PubMed] [Google Scholar]
- Binder JR, Frost JA, Hammeke TA, Bellgowan PS, Rao SM, Cox RW. Conceptual processing during the conscious resting state: A functional MRI study. J Cogn Neurosci. 1999;11:80–95. doi: 10.1162/089892999563265. [DOI] [PubMed] [Google Scholar]
- Biswal B, Yetkin FZ, Haughton VM, Hyde JS. Functional connectivity in the motor cortex of resting human brain using echo-planar MRI. Magn Reson Med. 1995;34:537–541. doi: 10.1002/mrm.1910340409. [DOI] [PubMed] [Google Scholar]
- Biswal BB, Mennes M, Zuo XN, Gohel S, Kelly C, Smith SM, Beckmann CF, Adelstein JS, Buckner RL, Colcombe S, Dogonowski AM, Ernst M, Fair D, Hampson M, Hoptman MJ, Hyde JS, Kiviniemi VJ, Kotter R, Li SJ, Lin CP, Lowe MJ, Mackay C, Madden DJ, Madsen KH, Margulies DS, Mayberg HS, McMahon K, Monk CS, Mostofsky SH, Nagel BJ, Pekar JJ, Peltier SJ, Petersen SE, Riedl V, Rombouts SA, Rypma B, Schlaggar BL, Schmidt S, Seidler RD, Siegle GJ, Sorg C, Teng GJ, Veijola J, Villringer A, Walter M, Wang L, Weng XC, Whitfield-Gabrieli S, Williamson P, Windischberger C, Zang YF, Zhang HY, Castellanos FX, Milham MP. Toward discovery science of human brain function. Proc Natl Acad Sci USA. 2010;107:4734–4739. doi: 10.1073/pnas.0911855107. [DOI] [PMC free article] [PubMed] [Google Scholar]
- Bookheimer S. Functional MRI of language: New approaches to understanding the cortical organization of semantic processing. Annu Rev Neurosci. 2002;25:151–188. doi: 10.1146/annurev.neuro.25.112701.142946. [DOI] [PubMed] [Google Scholar]
- Bookheimer S. Pre-surgical language mapping with functional magnetic resonance imaging. Neuropsychol Rev. 2007;17:145–155. doi: 10.1007/s11065-007-9026-x. [DOI] [PubMed] [Google Scholar]
- Brennan RL, Prediger DJ. Coefficient kappa: Some uses, misuses, and alternatives. Educ Psychol Meas. 1981;41:687–699. [Google Scholar]
- Buckner RL, Andrews-Hanna JR, Schacter DL. The brain’s default network: Anatomy, function, and relevance to disease. Ann N Y Acad Sci. 2008;1124:1–38. doi: 10.1196/annals.1440.011. [DOI] [PubMed] [Google Scholar]
- Calhoun VD, Adali T, Pearlson GD, Pekar JJ. A method for making group inferences from functional MRI data using independent component analysis. Hum Brain Mapp. 2001;14:140–151. doi: 10.1002/hbm.1048. [DOI] [PMC free article] [PubMed] [Google Scholar]
- Carpentier A, Pugh KR, Westerveld M, Studholme C, Skrinjar O, Thompson JL, Spencer DD, Constable RT. Functional MRI of language processing: Dependence on input modality and temporal lobe epilepsy. Epilepsia. 2001;42:1241–1254. doi: 10.1046/j.1528-1157.2001.35500.x. [DOI] [PubMed] [Google Scholar]
- Cohen J. A coefficient of agreement for nominal scales. Educ Psychol Meas. 1960;20:37–46. [Google Scholar]
- Cordes D, Haughton VM, Arfanakis K, Wendt GJ, Turski PA, Moritz CH, Quigley MA, Meyerand ME. Mapping functionally related regions of brain with functional connectivity MR imaging. AJNR Am J Neuroradiol. 2000;21:1636–1644. [PMC free article] [PubMed] [Google Scholar]
- Damoiseaux JS, Rombouts SA, Barkhof F, Scheltens P, Stam CJ, Smith SM, Beckmann CF. Consistent resting-state networks across healthy subjects. Proc Natl Acad Sci USA. 2006;103:13848–13853. doi: 10.1073/pnas.0601417103. [DOI] [PMC free article] [PubMed] [Google Scholar]
- De Luca M, Beckmann CF, De Stefano N, Matthews PM, Smith SM. fMRI resting state networks define distinct modes of long-distance interactions in the human brain. Neuroimage. 2006;29:1359–1367. doi: 10.1016/j.neuroimage.2005.08.035. [DOI] [PubMed] [Google Scholar]
- Duffau H. Lessons from brain mapping in surgery for low-grade glioma: Insights into associations between tumour and brain plasticity. Lancet Neurol. 2005;4:476–486. doi: 10.1016/S1474-4422(05)70140-X. [DOI] [PubMed] [Google Scholar]
- Fernandez G, Specht K, Weis S, Tendolkar I, Reuber M, Fell J, Klaver P, Ruhlmann J, Reul J, Elger CE. Intrasubject reproducibility of presurgical language lateralization and mapping using fMRI. Neurology. 2003;60:969–975. doi: 10.1212/01.wnl.0000049934.34209.2e. [DOI] [PubMed] [Google Scholar]
- FitzGerald DB, Cosgrove GR, Ronner S, Jiang H, Buchbinder BR, Belliveau JW, Rosen BR, Benson RR. Location of language in the cortex: A comparison between functional MR imaging and electrocortical stimulation. AJNR Am J Neuroradiol. 1997;18:1529–1539. [PMC free article] [PubMed] [Google Scholar]
- Fleiss JL. Measuring nominal scale agreement among many raters. Psychol Bull. 1971;76:378–382. [Google Scholar]
- Fox MD, Raichle ME. Spontaneous fluctuations in brain activity observed with functional magnetic resonance imaging. Nat Rev Neurosci. 2007;8:700–711. doi: 10.1038/nrn2201. [DOI] [PubMed] [Google Scholar]
- Franco AR, Pritchard A, Calhoun VD, Mayer AR. Interrater and intermethod reliability of default mode network selection. Hum Brain Mapp. 2009;30:2293–2303. doi: 10.1002/hbm.20668. [DOI] [PMC free article] [PubMed] [Google Scholar]
- Giussani C, Roux FE, Ojemann J, Sganzerla EP, Pirillo D, Papagno C. Is preoperative functional magnetic resonance imaging reliable for language areas mapping in brain tumor surgery? Review of language functional magnetic resonance imaging and direct cortical stimulation correlation studies. Neurosurgery. 2010;66:113–120. doi: 10.1227/01.NEU.0000360392.15450.C9. [DOI] [PubMed] [Google Scholar]
- Goldmann RE, Golby AJ. Atypical language representation in epilepsy: Implications for injury-induced reorganization of brain function. Epilepsy Behav. 2005;6:473–487. doi: 10.1016/j.yebeh.2005.03.012. [DOI] [PubMed] [Google Scholar]
- Greicius MD, Srivastava G, Reiss AL, Menon V. Default-mode network activity distinguishes Alzheimer’s disease from healthy aging: Evidence from functional MRI. Proc Natl Acad Sci USA. 2004;101:4637–4642. doi: 10.1073/pnas.0308627101. [DOI] [PMC free article] [PubMed] [Google Scholar]
- Greicius MD, Supekar K, Menon V, Dougherty RF. Resting-state functional connectivity reflects structural connectivity in the default mode network. Cereb Cortex. 2009;19:72–78. doi: 10.1093/cercor/bhn059. [DOI] [PMC free article] [PubMed] [Google Scholar]
- Hampson M, Peterson BS, Skudlarski P, Gatenby JC, Gore JC. Detection of functional connectivity using temporal correlations in MR images. Hum Brain Mapp. 2002;15:247–262. doi: 10.1002/hbm.10022. [DOI] [PMC free article] [PubMed] [Google Scholar]
- Himberg J, Hyvarinen A, Esposito F. Validating the independent components of neuroimaging time series via clustering and visualization. Neuroimage. 2004;22:1214–1222. doi: 10.1016/j.neuroimage.2004.03.027. [DOI] [PubMed] [Google Scholar]
- Horovitz SG, Fukunaga M, de Zwart JA, van Gelderen P, Fulton SC, Balkin TJ, Duyn JH. Low frequency BOLD fluctuations during resting wakefulness and light sleep: A simultaneous EEG-fMRI study. Hum Brain Mapp. 2008;29:671–682. doi: 10.1002/hbm.20428. [DOI] [PMC free article] [PubMed] [Google Scholar]
- Hyvarinen A, Oja E. Independent component analysis: Algorithms and applications. Neural Netw. 2000;13:411–430. doi: 10.1016/s0893-6080(00)00026-5. [DOI] [PubMed] [Google Scholar]
- Kiviniemi VJ, Haanpaa H, Kantola JH, Jauhiainen J, Vainionpaa V, Alahuhta S, Tervonen O. Midazolam sedation increases fluctuation and synchrony of the resting brain BOLD signal. Magn Reson Imaging. 2005;23:531–537. doi: 10.1016/j.mri.2005.02.009. [DOI] [PubMed] [Google Scholar]
- Lancaster JL, Summerln JL, Rainey L, Freitas CS, Fox PT. The Talairach Daemon, a database server for Talairach Atlas Labels. Neuroimage. 1997;5:S633. [Google Scholar]
- Lancaster JL, Woldorff MG, Parsons LM, Liotti M, Freitas CS, Rainey L, Kochunov PV, Nickerson D, Mikiten SA, Fox PT. Automated talairach atlas labels for functional brain mapping. Hum Brain Mapp. 2000;10:120–131. doi: 10.1002/1097-0193(200007)10:3<120::AID-HBM30>3.0.CO;2-8. [DOI] [PMC free article] [PubMed] [Google Scholar]
- Li YO, Adali T, Calhoun VD. Estimating the number of independent components for functional magnetic resonance imaging data. Hum Brain Mapp. 2007;28:1251–1266. doi: 10.1002/hbm.20359. [DOI] [PMC free article] [PubMed] [Google Scholar]
- Likert R. A technique for the measurement of attitudes. Arch Psychol. 1932;140:1–55. [Google Scholar]
- Liu H, Buckner RL, Talukdar T, Tanaka N, Madsen JR, Stuffle-beam SM. Task-free presurgical mapping using functional magnetic resonance imaging intrinsic activity. J Neurosurg. 2009;111:746–754. doi: 10.3171/2008.10.JNS08846. [DOI] [PMC free article] [PubMed] [Google Scholar]
- Loring DW, Meador KJ, Allison JD, Pillai JJ, Lavin T, Lee GP, Balan A, Dave V. Now you see it, now you don’t: statistical and methodological considerations in fMRI. Epilepsy Behav. 2002;3:539–547. doi: 10.1016/s1525-5050(02)00558-9. [DOI] [PubMed] [Google Scholar]
- Maldjian JA, Laurienti PJ, Kraft RA, Burdette JH. An automated method for neuroanatomic and cytoarchitectonic atlas-based interrogation of fMRI data sets. Neuroimage. 2003;19:1233–1239. doi: 10.1016/s1053-8119(03)00169-1. [DOI] [PubMed] [Google Scholar]
- Maldjian JA, Laurienti PJ, Burdette JH. Precentral gyrus discrepancy in electronic versions of the Talairach atlas. Neuroimage. 2004;21:450–455. doi: 10.1016/j.neuroimage.2003.09.032. [DOI] [PubMed] [Google Scholar]
- McKeown MJ, Jung TP, Makeig S, Brown G, Kindermann SS, Lee TW, Sejnowski TJ. Spatially independent activity patterns in functional MRI data during the stroop color-naming task. Proc Natl Acad Sci USA. 1998;95:803–810. doi: 10.1073/pnas.95.3.803. [DOI] [PMC free article] [PubMed] [Google Scholar]
- Ojemann GA. Functional mapping of cortical language areas in adults. Intraoperative approaches. Adv Neurol. 1993;63:155–163. [PubMed] [Google Scholar]
- Oldfield RC. The assessment and analysis of handedness: The Edinburgh inventory. Neuropsychologia. 1971;9:97–113. doi: 10.1016/0028-3932(71)90067-4. [DOI] [PubMed] [Google Scholar]
- Petersen SE, Fox PT, Snyder AZ, Raichle ME. Activation of extrastriate and frontal cortical areas by visual words and word-like stimuli. Science. 1990;249:1041–1044. doi: 10.1126/science.2396097. [DOI] [PubMed] [Google Scholar]
- Price CJ, Wise RJ, Frackowiak RS. Demonstrating the implicit processing of visually presented words and pseudo-words. Cereb Cortex. 1996;6:62–70. doi: 10.1093/cercor/6.1.62. [DOI] [PubMed] [Google Scholar]
- Propper RE, O’Donnell LJ, Whalen S, Tie Y, Norton IH, Suarez RO, Zollei L, Radmanesh A, Golby AJ. A combined fMRI and DTI examination of functional language lateralization and arcuate fasciculus structure: Effects of degree versus direction of hand preference. Brain Cogn. 2010;73:85–92. doi: 10.1016/j.bandc.2010.03.004. [DOI] [PMC free article] [PubMed] [Google Scholar]
- Randolph JJ. Free-marginal multirater kappa: An alternative to Fleiss’ fixed-marginal multirater kappa. Joensuu University Learning and Instruction Symposium; Joensuu, Finland. October 14–15, 2005; 2005. (ERIC Document Reproduction Service No. ED490661) [Google Scholar]
- Rolls HK, Yoo SS, Zou KH, Golby AJ, Panych LP. Rater-dependent accuracy in predicting the spatial location of functional centers on anatomical MR images. Clin Neurol Neurosurg. 2007;109:225–235. doi: 10.1016/j.clineuro.2006.08.005. [DOI] [PMC free article] [PubMed] [Google Scholar]
- Rosazza C, Minati L. Resting-state brain networks: Literature review and clinical applications. Neurol Sci. 2011;32:773–785. doi: 10.1007/s10072-011-0636-y. [DOI] [PubMed] [Google Scholar]
- Rosazza C, Minati L, Ghielmetti F, Mandelli ML, Bruzzone MG. Functional connectivity during resting-state functional MR imaging: Study of the correspondence between independent component analysis and region-of-interest-based methods. AJNR Am J Neuroradiol. 2011;33:180–187. doi: 10.3174/ajnr.A2733. [DOI] [PMC free article] [PubMed] [Google Scholar]
- Roux FE, Boulanouar K, Lotterie JA, Mejdoubi M, LeSage JP, Berry I. Language functional magnetic resonance imaging in preoperative assessment of language areas: Correlation with direct cortical stimulation. Neurosurgery. 2003;52:1335–1345. doi: 10.1227/01.neu.0000064803.05077.40. [DOI] [PubMed] [Google Scholar]
- Sanai N, Mirzadeh Z, Berger MS. Functional outcome after language mapping for glioma resection. N Engl J Med. 2008;358:18–27. doi: 10.1056/NEJMoa067819. [DOI] [PubMed] [Google Scholar]
- Seifritz E, Esposito F, Hennel F, Mustovic H, Neuhoff JG, Bilecen D, Tedeschi G, Scheffler K, Di Salle F. Spatiotemporal pattern of neural processing in the human auditory cortex. Science. 2002;297:1706–1708. doi: 10.1126/science.1074355. [DOI] [PubMed] [Google Scholar]
- Shimony JS, Zhang D, Johnston JM, Fox MD, Roy A, Leuthardt EC. Resting-state spontaneous fluctuations in brain activity: a new paradigm for presurgical planning using fMRI. Acad Radiol. 2009;16:578–583. doi: 10.1016/j.acra.2009.02.001. [DOI] [PMC free article] [PubMed] [Google Scholar]
- Smith SM, Fox PT, Miller KL, Glahn DC, Fox PM, Mackay CE, Filippini N, Watkins KE, Toro R, Laird AR, Beckmann CF. Correspondence of the brain’s functional architecture during activation and rest. Proc Natl Acad Sci USA. 2009;106:13040–13045. doi: 10.1073/pnas.0905267106. [DOI] [PMC free article] [PubMed] [Google Scholar]
- Stippich C, Rapps N, Dreyhaupt J, Durst A, Kress B, Nennig E, Tronnier VM, Sartor K. Localizing and lateralizing language in patients with brain tumors: Feasibility of routine pre-operative functional MR imaging in 81 consecutive patients. Radiology. 2007;243:828–836. doi: 10.1148/radiol.2433060068. [DOI] [PubMed] [Google Scholar]
- Suarez RO, Whalen S, O’Shea JP, Golby AJ. A surgical planning method for functional MRI assessment of language dominance: Influences from threshold, region-of-interest, and stimulus mode. Brain Imaging Behav. 2008;2:59–73. [Google Scholar]
- Suarez RO, Whalen S, Nelson AP, Tie Y, Meadows ME, Radmanesh A, Golby AJ. Threshold-independent functional MRI determination of language dominance: A validation study against clinical gold standards. Epilepsy Behav. 2009;16:288–297. doi: 10.1016/j.yebeh.2009.07.034. [DOI] [PMC free article] [PubMed] [Google Scholar]
- Talairach J, Tournoux P. Co-Planar Stereotactic Atlas of The Human Brain. Thieme; Stuttgart: 1988. [Google Scholar]
- Tharin S, Golby A. Functional brain mapping and its applications to neurosurgery. Neurosurgery. 2007;60(4 Suppl 2):185–201. doi: 10.1227/01.NEU.0000255386.95464.52. [DOI] [PubMed] [Google Scholar]
- Tie Y, Suarez RO, Whalen S, Norton IH, Golby AJ. Identification of essential language areas by combination of fMRI from different tasks using probabilistic independent component analysis. J Biomed Sci Eng. 2008a;1:157–162. [Google Scholar]
- Tie Y, Whalen S, Suarez RO, Golby AJ. Group independent component analysis of language fMRI from word generation tasks. Neuroimage. 2008b;42:1214–1225. doi: 10.1016/j.neuroimage.2008.05.028. [DOI] [PMC free article] [PubMed] [Google Scholar]
- Tie Y, Suarez RO, Whalen S, Radmanesh A, Norton IH, Golby AJ. Comparison of blocked and event-related fMRI designs for pre-surgical language mapping. Neuroimage. 2009;47 (Suppl 2):T107–T115. doi: 10.1016/j.neuroimage.2008.11.020. [DOI] [PMC free article] [PubMed] [Google Scholar]
- van de Ven VG, Formisano E, Prvulovic D, Roeder CH, Linden DE. Functional connectivity as revealed by spatial independent component analysis of fMRI measurements during rest. Hum Brain Mapp. 2004;22:165–178. doi: 10.1002/hbm.20022. [DOI] [PMC free article] [PubMed] [Google Scholar]
- Vincent JL, Snyder AZ, Fox MD, Shannon BJ, Andrews JR, Raichle ME, Buckner RL. Coherent spontaneous activity identifies a hippocampal-parietal memory network. J Neurophysiol. 2006;96:3517–3531. doi: 10.1152/jn.00048.2006. [DOI] [PubMed] [Google Scholar]
- Waites AB, Stanislavsky A, Abbott DF, Jackson GD. Effect of prior cognitive state on resting state networks measured with functional connectivity. Hum Brain Mapp. 2005;24:59–68. doi: 10.1002/hbm.20069. [DOI] [PMC free article] [PubMed] [Google Scholar]
- Zhang D, Johnston JM, Fox MD, Leuthardt EC, Grubb RL, Chicoine MR, Smyth MD, Snyder AZ, Raichle ME, Shimony JS. Preoperative sensorimotor mapping in brain tumor patients using spontaneous fluctuations in neuronal activity imaged with functional magnetic resonance imaging: initial experience. Neurosurgery. 2009;65(6 Suppl):226–236. doi: 10.1227/01.NEU.0000350868.95634.CA. [DOI] [PMC free article] [PubMed] [Google Scholar]