Abstract
This article is a comparative study of white matter projections from ventral prefrontal cortex (vPFC) between human and macaque brains. We test whether the organizational rules that vPFC connections follow in macaques are preserved in humans. These rules concern the trajectories of some of the white matter projections from vPFC, and how the position of regions in the vPFC dictate the trajectories of their projections in the white matter. In order to address this question, we present a novel approach that combines direct tracer measurements of entire white matter trajectories in macaque monkeys with diffusion MRI tractography of both macaques and humans. The approach allows us to provide explicit validation of diffusion tractography and transfer tractography strategies across species to test the extent to which inferences from macaques can be applied to human neuroanatomy. Apart from one exception, we found a remarkable overlap between the two techniques in the macaque. Furthermore the organizational principles followed by vPFC tracts in macaques are preserved in humans.
Introduction
The gross organization of white matter (WM) bundles has been preserved in evolution between macaques and humans (Thiebaut de Schotten et al., 2012), and similar geometrical features can be observed in both species (Wedeen et al., 2012). This resemblance between species offers a model for human anatomy when the latter is not practically accessible, and allows us to draw from a large body of knowledge of the macaque anatomy (Yeterian et al., 2012). However, the details of WM layout, such as the branching of bundles into sub-bundles, are not always preserved. For example, although the arcuate fasciculus can be dissected in both species, the details of its branching and cortical projections are substantially different (Rilling et al., 2008). Therefore, comparative studies of WM anatomy are needed in order to determine the extent to which inferences from macaques can inform us about human brains.
In this respect, the connectional anatomy of the human frontal lobes is of particular relevance. While human WM is disproportionately larger than that of macaque, it is even more so in the frontal lobes (Schoenemann et al., 2005). Thus, frontal WM is likely to be more complex in humans, and organizational rules found in macaques may not be preserved.
In this study, we investigate the connectional anatomy of the vPFC in macaques and humans. Tracing studies in monkeys demonstrate that, while the trajectories of vPFC fibers are complex, three organization rules emerge that allow predictions about where specific fibers are likely to travel (Lehman et al., 2011). First, the uncinate fasciculus connects not only the vPFC with the temporal lobe, but also serves as a conduit for vPFC fibers to join other WM bundles. Second, within the internal capsule (IC), fibers from each vPFC area split into a dorsal thalamic and a ventral brainstem group. Third, the medial-to-lateral vPFC position dictates both the route axons take to reach WM bundles and the position they take within the bundle. Axons from medial cortical areas travel ventral to those originating from lateral vPFC regions both in the IC and the corpus callosum. Despite the precision with which such organizational principles can be investigated in macaques, the extent to which they apply in humans is not clear.
Here we explicitly test these macaque-human predictions. We use a novel combination of accurate mapping of whole WM trajectories from chemical tracing, with diffusion MRI tractography. Our approach proceeds in three steps: first we delineate the organization of WM pathways from different vPFC regions using tractography in nonhuman primates; second we compare those results with the 3D reconstructions of pathways from the same vPFC regions, but derived from conventional tracing; and third we test the hypothesis that fibers from different vPFC regions in humans use similar rules to reach their targets. In addition, we test whether the same rules generalize to the whole vPFC. Our approach of combining techniques to bridge the gap between species allows us to make strong claims on our tractography findings, as they are directly compared to chemical tracing.
Materials and Methods
Tracers
Details of surgery and tissue preparation were described elsewhere (Lehman et al., 2011). Briefly, the vPFC was divided into three regions based on functional imaging studies (Croxson et al., 2005, Petrides et al., 2002). Anterograde or bidirectional tracers were injected into the following three regions in adult male Old World primates: (1) ventral medial PFC (vmPFC; medial to the olfactory sulcus), (2) central OFC orbital cortex (cOFC; between the medial and lateral orbital sulci), and (3) lateral orbital cortex (lOFC; at or lateral to the lateral orbital sulcus). Monkeys received an injection of one or more of the following anterograde/bidirectional tracers: Lucifer yellow, fluororuby, or fluorescein conjugated to dextran amine (LY, FR, or FS; 40–50 nl, 10% in 0.1M phosphate buffer (PB), pH 7.4; Invitrogen); Phaseolus vulgaris-leucoagglutinin (PHA-L; 50 nl, 2.5%; Vector Laboratories); or tritiated amino acids (100 nl, 1:1 solution of [3H] leucine and [3H]-proline in dH2O, 200 mCi/ml, NEN). Cortical injections with contamination or weak labeling were eliminated from the analysis. Contamination refers to all injections in which the tracer was not limited to a single cortical region, but had leaked into an adjacent area or into the underlying white matter. Weak labeling refers to relatively few labeled fibers in the striatum, thalamus, and internal capsule, often the result of the injection site centered in superficial cortical layers. There were a total of 15, on target injections with excellent transport: seven placed in the vmPFC, five in the cOFC, and four in the lOFC. One animal received three different tracer injections placed into different regions of vPFC (vmPFC, cOFC, and lOFC).
Fiber bundles were charted using conventional microscopic techniques. All thick fibers without clear terminal boutons were assumed to be passing fibers and were included in the analysis. Fibers traveling in bundles were outlined as a group. Orientation was indicated for each bundle by charting a few individual fibers within each outline. Fibers outside of the major bundles were traced individually. The fiber pathways for each injection case were rendered in 3D separately and a stack of 2-D coronal sections was created from the microscope chartings and Nissl stained images. This stack was imported into IMOD (Kremer et al., 1996) and a 3-D reconstruction that contained the fiber bundles was created for each case separately. These separate models were then merged into a single, reference model to compare trajectories from the different cortical regions. Photos of coronal sections were used for registration to the ex vivo MRI data as described below.
Macaque ex-vivo imaging data
The brains of two adult male macaques (M. fascicularis) were obtained from a previous post-mortem study of stroke in non-human primates (de Crespigny et al., 2005). The animals (referred to below as MAC1a and MAC1b) had undergone a 1 hour intravascular middle cerebral artery occlusion experiment and had sustained no permanent lesion as detectable using in vivo DWI. Following this, the brains were removed after euthanasia and immersed in a 10% formaldehyde solution at 4 °C for at least 4 weeks. Following fixation, they were placed in a solution of 2% phosphate-buffered saline (PBS) doped with 1 mMol/l Gd-DTPA (Magnevist, Berlex Imaging, Montville, NJ, USA) contrast agent. The brains were then mounted on an individually modelled mould and immersed in Fomblin LC/8 (Solvay Solexis Inc., Thorofare, NJ, USA) for susceptibility matching.
High angular and high spatial resolution diffusion-weighted images were acquired using previously described methods (D’Arceuil et al., 2007). Imaging was performed on a 4.7 T Oxford magnet equipped with BGA 12 gradients interfaced to a Bruker Biospec Avance console (ParaVision 3.0.1; Bruker Biospin, Ettlingen, Germany), using a standard 72 mm inner diameter birdcage coil (Bruker). DWI was performed using a 3D segmented spin-echo EPI sequence (430 μm isotropic resolution, TE 33 ms, 8 shots, TE 33 ms, TR 350 ms, 120 isotropically distributed diffusion directions, bmax = 8000 s/mm2, delta 6.85 ms, Delta 10.8 ms, 27 h total scan time). Note that the high b-value used here (compared to 1500 s/mm2 in the human data) was necessary to compensate for the 3-fold drop in the diffusion coefficient due to the fixation process (Sun et al., 2005), and thus to obtain a comparable diffusion contrast between the data sets. Additionally, a separate adult female macaque (M. mulatta) brain specimen was used to investigate reproducibility of the ex-vivo tractography results (referred to below as MAC2). The brain was perfusion-fixed in formalin. Data were acquired on a 9.4T Bruker scanner with a spinecho sequence at 0.55 mm isotropic resolution with a b value of 2000 s/mm2 and 60 diffusion directions. Three sets of diffusion-weighted data were acquired for subsequent averaging. Scan duration was 72 hours.
Note that, in order to achieve comparable resolution of anatomical structures, the smaller nonhuman primate brains were scanned at much higher spatial resolution than the human brains. This was facilitated by imaging fixed brain specimens that were scanned for hours or days at higher field strengths to recover the signal sacrificed by reducing voxel size.
Human in-vivo imaging data
Diffusion-weighted and T1-weighted images were acquired in five healthy subjects (3 females, mean age=26 years) on a 3T Siemens (Erlangen, Germany) TIM Trio MR scanner. Diffusion weighted images were acquired using double-pulsed gradient spin echo with echo planar imaging (65 × 2mm thick slices; matrix size 96×96, field of view 192×192 mm2, giving a voxel size of 2×2×2 mm3; Grappa factor=2; TR/TE=9800/102ms). Diffusion weighting was isotropically distributed along 120 directions with a b-value of 1500 s/mm2. For each set of diffusion-weighted data, 20 volumes with no diffusion weighting were acquired. Two full sets of diffusion-weighted data were acquired with reversed phase-encoding direction (anterior-posterior and posterior-anterior), and these were combined to produce distortion-free average data (see below). Total scan time for diffusion-weighted images was 45min. A T1-weighted anatomical image was acquired using a three- dimensional FLASH (fast low-angle shot) sequence (TR/TE 12/6.65 ms; flip angle, 19°; elliptical sampling of k space, voxel size 1×1×1mm, acquisition time 6min).
Data analysis: Pre-processing
All of the MRI data analyses were done using tools from FSL 5.0 (Smith et al., 2004, Woolrich et al., 2009, Jenkinson et al., 2012). The in vivo human data was corrected for field inhomogeneity-induced distortions prior to averaging using the TOPUP tool, which combines images acquired with reversed phase-encoding to estimate and correct distortions, as described in (Andersson et al., 2003). These distortions are particularly pronounced near the ventral prefrontal cortex, and thus their correction was crucial in our study. The quality of this pre-processing step was visually checked using FLIRT rigid-body registration (Jenkinson et al., 2002) to the subjects’ distortion-free T1-weighted structural images. Eddy-current induced distortions were minimised using the double-pulsed gradient sequence (Alexander et al., 1997), and further corrected in post-processing using the EDDY tool (Andersson J et al., 2012). Diffusion data were registered to standard MNI152 space (1mm isotropic) using a two-stage registration: (1) rigid-body alignment of a fractional anisotropy (FA) image to the T1-weighted structural of each individual, then (2) nonlinear (FNIRT) transformation to standard space using a high resolution distortion model.
The ex-vivo macaque dMRI data did not need inhomogeneity-induced distortion correction (since they were not acquired using single-shot EPI), and there were no noticeable eddy-current distortions. Repeated acquisitions were averaged in image space to increase SNR.
After these pre-processing steps, voxelwise model fitting of diffusion orientations and tractography were performed in both human and macaque dMRI data in exactly the same way, as explained below.
We used BedpostX (part of FSL5.0) to fit a crossing fiber model to both ex vivo and in vivo data (Behrens et al., 2007). Up to three fiber orientations per voxel were allowed, and a modified diffusion model (Jbabdi et al., 2012) with Rician noise modelling was used for the macaque data to reduce over-fitting of fiber orientations. This tool produces voxelwise posterior distributions of fiber orientations that are subsequently used in probabilistic tractography.
Data analysis: Alignment with tracer data
Photographs (in JPEG format) of coronal brain sections were stacked and transformed into a NIFTI 3D brain volume using the ImageJ (v1.45) software (http://rsbweb.nih.gov/ij). These sections had 46μm in-plane resolution and 600μm inter-slice spacing. The resulting 3D volume was then registered to the ex vivo dMRI data (FA image) using a combination of linear FLIRT (Jenkinson et al., 2002) and non-linear FNIRT (www.fmrib.ox.ac.uk/fsl/fnirt) transformations. Six control points were used to aid and initialise the nonlinear registration (one in the anterior commissure (AC), two in the CC –genu and splenium-, two in the vPFC and one in the IPS). As the contrast in the slice photographs was different from that of the MRI data, registration was driven by grey matter maps calculated using FAST (Zhang et al., 2001) on the two images prior to registration. The quality of this crucial registration step was carefully checked visually (see figure 1). The above registration steps were performed using one of the three ex-vivo MRI data sets (the one with highest SNR – MAC1a). Then registration between the other two ex-vivo data sets (MAC1b and MAC2) and the tracer data were done via non-linearly registering FA images from these two monkeys to the FA image of the third monkey, and subsequently combining all registration warpfields to produce a single warpfield for each monkey.
Figure 1.
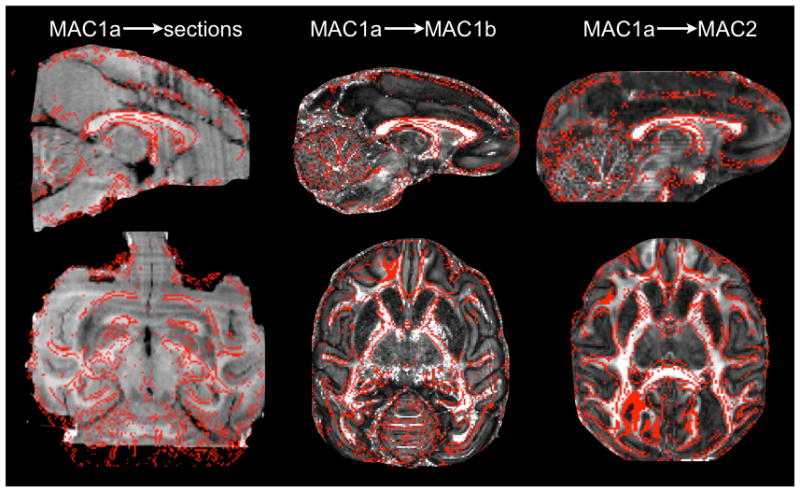
Accuracy of the alignment between the macaque brains. The FA map from macaque MAC1a (the best quality diffusion data) is overlaid (red outline) on the stacked histological sections (left) and on the FA maps from MAC1b (middle) and MAC2 (right).
Data analysis: tractography
Seed regions for macaque tractography were defined to be precisely the injection sites from (Lehman et al., 2011), which were transformed into diffusion space using the warpfields from the nonlinear registrations described above (figure 2 and 3C). Inclusion and exclusion masks were hand-drawn on the fractional anisotropy (FA) image of the MAC1a ex vivo data (figure 3A). In the human experiments, seed regions and inclusion/exclusion masks were hand-drawn in standard space (MNI152 coordinates shown in figure 3B and 3C). Human seed regions were defined relative to vPFC sulcal morphology that is common to both species as outlined in (Chiavaras et al., 2001). The vmPFC seed was positioned in the Gyrus rectus (GR), the cOFC region within the anterior orbital gyrus (AOG), and the lOFC within the lateral orbital gyrus (LOG). A sketch of the seed ROI centres in macaques and humans is shown in figure 2.
Figure 2.
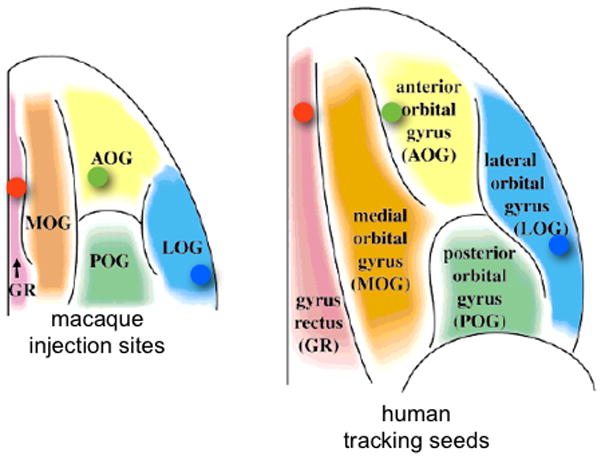
Ventral view of the position of the three seed regions (coloured dots) relative to the main orbital sulci in humans and monkeys (figure modified from (Chiavaras et al., 2001)). Key: blue=lOFC, green=cOFC, red=vmPFC.
Figure 3.
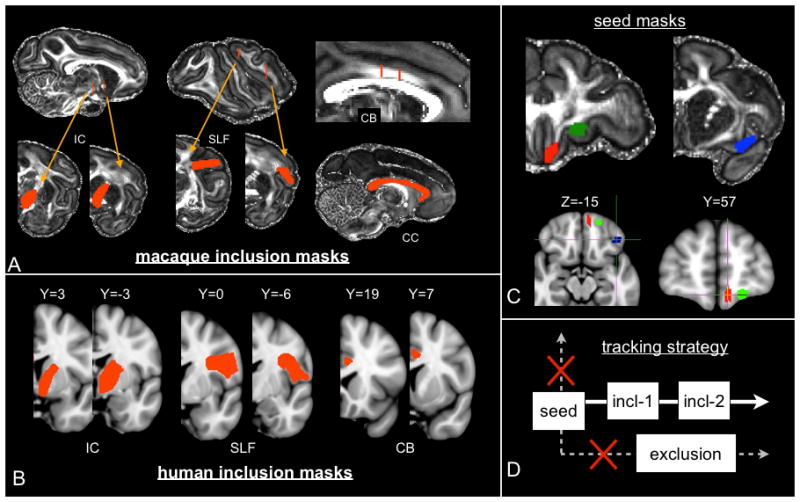
A: Position of the inclusion masks used in the macaque tractography of the internal capsule (IC), the superior longitudinal fascicle (SLF), the cingulum bundle (CB) and the corpus callosum (CC). B: Inclusion masks used in the human tractography. The slice coordinates are relative to MNI152 standard space, and are in mm (coordinate [0,0,0] corresponds to the anterior commissure). The corpus callosum inclusion mask is not displayed; it corresponds to a single planar ROI containing the whole anterior half of the corpus callosum at coordinate X=0. C: Location of the three injection-sites from the tracing data displayed on the FA map of macaque MAC1a (top) and human MNI standard space (bottom). Key: red=vmPFC, green=cOFC, blue=lOFC. D: Tracking strategy common to both macaque and human experiments. Streamlines are only retained if they cross inclusion masks, and excluded if they don’t or if they cross one or more exclusion mask. When two inclusion masks are used, they are required to be crossed in a specified order (anterior to posterior in all our experiments).
Tractography analyses followed the same procedure for all experiments and in both species (except for step size and number of steps in order to account for differences in brain and voxel sizes). Tracking was initiated from a seed mask at the injection site, and other ROIs were used as inclusion or exclusion masks (figure 3D). Ten thousand sample streamlines were seeded from each voxel within the seed ROIs, where the starting location was randomly positioned inside each voxel (maximum of 4000 (resp. 2000) steps of 0.1mm (resp. 0.5mm) each for the macaque (resp. human) experiments; no anisotropy threshold was used; curvature threshold=60 degrees). Each streamline followed local orientations sampled from the posterior distribution given by BedpostX, as described in (Behrens et al., 2007). A visitation map (spatial histogram of streamline location) was built at the voxel resolution of the original diffusion space for the macaque experiments (430μm or 550μm) and that of the MNI152 space for the human experiments (1mm). Voxelwise probabilities were calculated as the number of streamlines passing through a voxel divided by the number of streamlines that were not rejected by the exclusion/inclusion criteria. These probabilities were then averaged across subjects or animals, unless otherwise stated. Tracking results (in the form of spatial histograms) were thresholded at 1% in all figures to reduce noise in the visualisation.
Four major WM bundles were reconstructed, seeding from vPFC and using WM inclusion/exclusion masks: (i) connections through the internal capsule (IC), (ii) corpus callosum (CC), (iii) cingulum bundle (CB) and (iv) superior longitudinal fascicle (SLF). Exclusion and inclusion masks were used to isolate each of these bundles. These masks were common to all three seed regions. For the IC, CB and SLF experiments, two inclusion masks were hand-drawn on single planes, and streamlines were retained if they crossed both masks in succession (figure 3D). Note that, for each set of bundles, the same ROIs were used as inclusion/exclusion masks for all the three injection sites/seed regions. Therefore, whilst these ROIs served to preselect the relevant bundles (e.g. CC projections versus CB or IC), they did not bias the relative positions of the sub-bundles.
The mid-sagittal plane was always used as an exclusion mask except for the CC experiment, where it was used as a stopping mask instead. For each seed ROI that belongs to either sub-section of the vPFC, larger ROIs covering the rest of the vPFC were used as exclusion masks in order to prevent streamlines from entering adjacent cortex before reaching the WM. All inclusion/exclusion masks were hand-drawn on single planes in both species.
Tractography from the whole vPFC
In order to test if the rules of organisation of WM trajectories from the injection sites generalise to the whole vPFC, we performed the following analysis. We subdivided the entire vPFC orbital surface of macaques and humans into 13 sub-regions using two histological atlases. For the macaque vPFC, we used the parcellation of (Carmichael and Price, 1994). For this parcellation, the vPFC areas were delineated histologically in 5 hemispheres based on nine different cyto- and myeloarchitectonic and immuno-histochemical stains. For the human vPFC, we used the parcellation from (Ongur et al., 2003), who used many of the same stains as in the macaque to subdivide vPFC. Ongur and colleagues have shown that all sub-divisions of vPFC identified in humans have a macaque counterpart, although the relative sizes and positions of these areas display some variation between the two species. Both of these atlases are available as part of the Caret5 software (Van Essen et al., 2012a, Van Essen et al., 2012b). The nomenclature of these 13 vPFC subdivisions used here follows that adopted by (Ongur et al., 2003).
Results
Overall the results show that four important pathways from the vPFC can be followed accurately with diffusion tractography using conventional anatomical tracing as a guide. Moreover, the rules that these fiber bundles use to reach their targets are also evident in the human brain. These include, the path that fibers take to enter WM bundles, and the position they occupy in the internal capsule and corpus callosum. However, we also demonstrate aspects of these pathways that are difficult to reproduce using tractography in either humans or macaques.
Ventral-dorsal gradient in IC and CC
One striking set of results from the tracing data is the trajectory that vPFC pathways take to, and the position they occupy within, the internal capsule (IC) and corpus callosum (CC). To reach the IC, axons from medial vPFC regions travel dorsally through the grey matter of the ventral striatum in small fascicles to enter the IC from a ventral position. These fibers move dorsally within the capsule as they travel caudally, such that at the level of the anterior commissure (AC) they are positioned ventral to, or embedded within the AC (figure 4A and 4B). This is a challenging situation for tractography, where fibers must traverse grey matter through small fascicles. Moreover, the main fiber orientation in the AC is medial/lateral, whilst the vPFC tracts travel rostro-caudally, and must therefore traverse the more extensive fiber bundle oriented orthogonally. In contrast, axons from the lOFC travel dorsally, arching around the lateral border of the striatum to enter the IC dorsally. These fibers turn ventrally into the IC and continue to move ventrally as they travel to the thalamus and brainstem. This creates another challenge for tractography, as this trajectory is a particularly tortuous route. Thus, in the IC, fibers from more medial parts of vPFC travel ventral to those projecting from the more lateral portions of vPFC.
Figure 4.
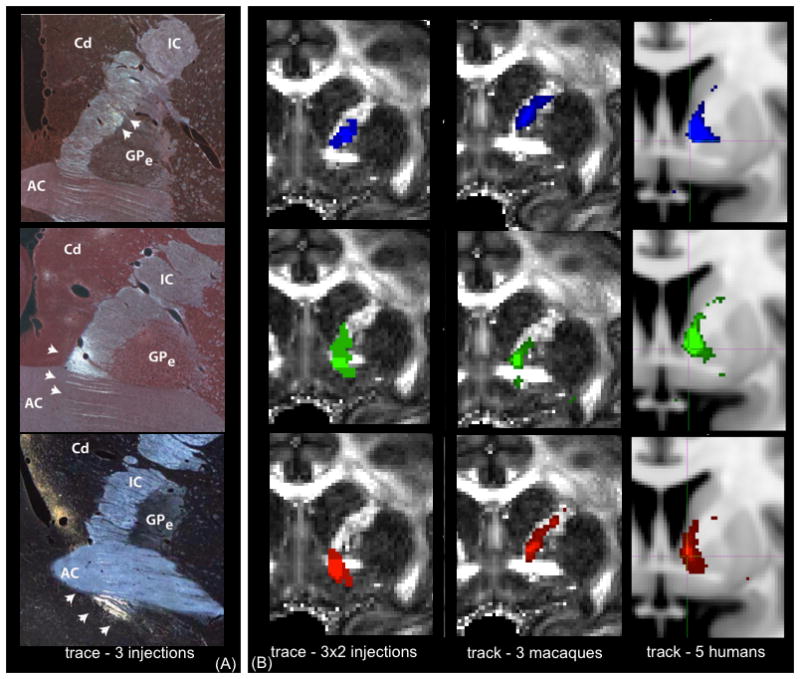
The position of fibers from different vPFC regions travelling in the IC at the level of the anterior commissure (AC). There is topographic organization, such that axons from medial regions travel ventral to those from lateral areas. (A) Photomicrographs from single injections in the vPFC. White arrows indicate the locations where the tracer was detected. Abbreviations: AC=Anterior Commissure, GPe=external Globus Pallidus, IC=internal capsule, Cd=Caudate. (B) Tracer and tractography results overlaid on an MRI image averaged across 2 injections per seed (left), 3 macaques (tractography, middle) and 5 humans (right). Key: blue=lOFC, green=cOFC, red=vmPFC. In both (A) and (B), injection/seed site is in lOFC (top), cOFC (middle) and vmPFC (bottom).
In the ex vivo macaque tractography experiments, we were able to replicate both the relative and absolute positions of lOFC and cOFC pathways in the IC. Figure 4B (middle panel) shows that, as predicted by the tracer data, the streamlines from the lOFC entered the IC dorsal to those from cOFC. The relative position of lOFC and cOFC tracts was preserved across all three macaque tractography data sets. The vmPFC connections, on the other hand, did not follow the route predicted by the tracer experiments. We describe and discuss these results in details in a separate section below.
In the human data, tractography revealed the same overall organisation of lOFC and cOFC connections as in the macaque brains. In all five subjects, lOFC tracts travelled dorsal to cOFC tracts in the IC. The medial-lateral positioning of seeds within the vPFC rotated into a ventral-dorsal gradient within the IC (figure 4B, right panel). Also, as in the macaque tractography, the vmPFC pathways failed to replicate the tracer findings. We examine these pathways separately in the vmPFC section below.
The other vPFC pathways that presented a dorsal-ventral gradient were the CC connections. In both humans and macaques, pathways entering the CC were ordered along the superior-inferior axis, such that projections from lOFC were dorsal to those from cOFC, and pathways from vmPFC were ventral to cOFC (figure 5). This ordering was extremely robust, and was replicated across all individual animals and humans, and using both tracing and tractography.
Figure 5.
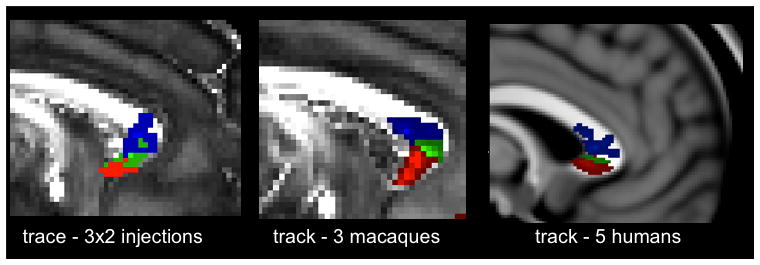
Organization of vPFC projections to the CC. The ventral-dorsal gradient can be clearly seen in both techniques and species. Key: blue=lOFC, green=cOFC, red=vmPFC.
Thalamic and Brainstem split
Macaque tracer data have shown that pathways from all vPFC regions separate, within the IC, into two groups; a dorsal group of fibers that travel to the thalamus, and a ventral group, that travel to the brainstem. This separation occurs immediately caudal to the AC (Lehman et al., 2011).
We observed the same pattern in both macaque and human tractography data (figure 6). The splitting into thalamic and brainstem sub-bundles occurs immediately caudal to the AC for both species (AC indicated by black crosses in figure 6), as predicted from the macaque tracer data. We note that the same split can be found in vmPFC trajectories. However, we do not show these here, as the vmPFC pathways do not follow the ventral route through the IC that was predicted by the tracer data, and can therefore not be confidently compared with the human trajectories (see vmPFC results section below).
Figure 6.
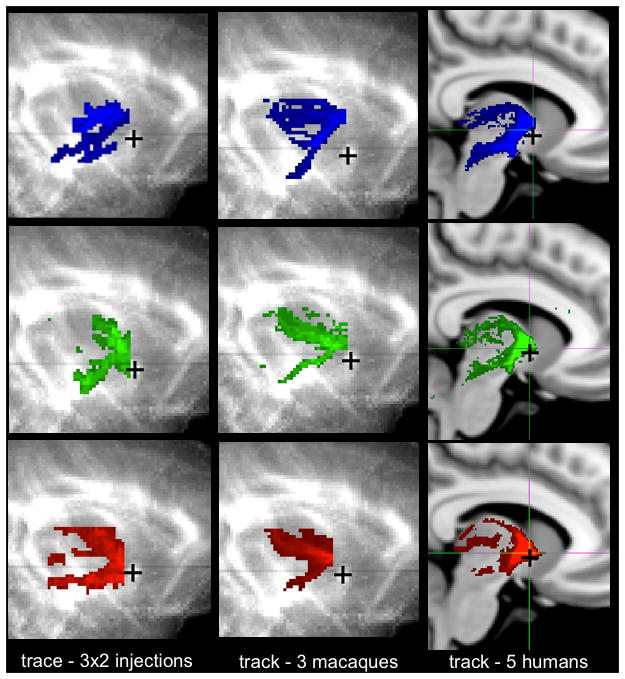
Splitting of the trajectories from the lOFC, cOFC and vmPFC in the IC into dorsal thalamic and ventral brainstem projections. In both species, the splitting occurs immediately caudal to the AC. Key: blue=lOFC; green=cOFC, red=vmPFC. The black crosses show the position of the AC.
Cingulum
The tracer data showed that fibers from all areas of the vPFC travel through the cingulum bundle (CB). However, axons from the various regions reach the CB via different routes. The lOFC projections travel dorsal through the white matter to reach the CB rather than taking a ventral route through the ventral prefrontal white matter plate. We find the same result using tractography in both species, as shown in figure 7A (MAC1a data used for these tracts). In humans, however, we found that the cOFC connections were particularly difficult to track. We were only able to detect them robustly in one out of five subjects.
Figure 7.
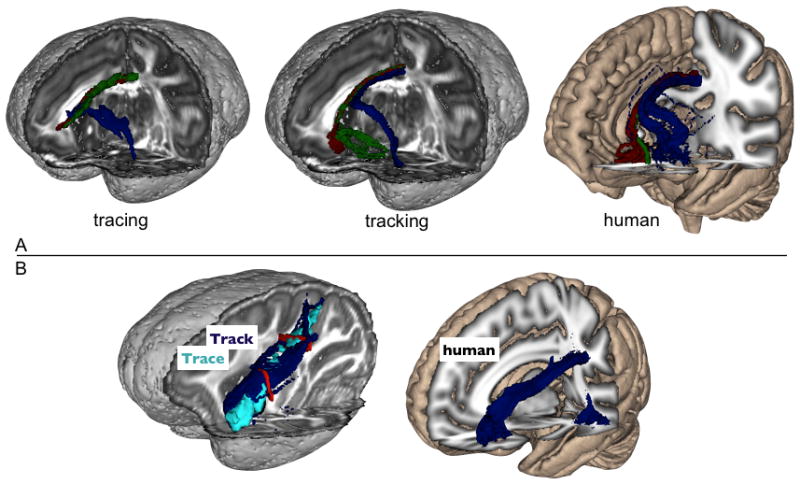
A: 3D renderings of the CB connections from lOFC (blue), cOFC (green) and vmPFC (red) in macaques and humans. B: SLFIII connections in macaques and humans from the lOFC seed mask. The red colours in (B) show the two planar ROIs used as inclusion masks for the SLFIII connection.
Superior Longitudinal Fascicle
The tracing study showed that only injections in the lOFC could be followed through the SLFIII. We obtained the same result in tractography in both species (figure 7B). Lateral OFC was found to strongly connect to SLFIII, but vmPFC and cOFC projections were either absent or extremely weak. In humans, the trajectory through SLFIII curved back to reach the caudal and inferior parts of the temporal lobe, in contrast to the macaque tracking and tracing results where these connections terminated in the parietal lobe. This is in line with previous comparative investigations of fronto-temporal and fronto-parietal connections in humans and monkeys (Rilling et al., 2011, Rilling et al., 2008). Only connections seeded from lOFC did reach SLFIII, replicating the macaque results from both tracing and tracking.
Uncinate Fascicle
The UF is traditionally pictured as a distinct bundle of fibers that connect the prefrontal and anterior temporal lobes (Schmahmann and Pandya, 2006). However, our tracing study shows that the UF also serves as a conduit for vPFC fibers to join other WM bundles, as detailed in (Lehman et al., 2011). In particular, the UF contains connections between different sections of the vPFC. It also contains axons that link the more medial vPFC fibers to the CB and corpus callosum (see CB results above). These UF fiber pathways run parallel to the ventral plate and follow a trajectory immediately adjacent to the cortex. We examined the crossing fiber patterns in both macaques and human dMRI data and found evidence for these connections within the UF (figure 8 – data from a single human subject and from MAC1a shown here). These UF pathways were clearer in the macaque data, in which 3 crossing-fiber orientations were detected in most WM voxels of the ventral prefrontal plate. The human data also shows clear secondary fiber pathways running parallel to the cortex, although sensitivity to these fiber orientations appears somewhat lower in the human data.
Figure 8.
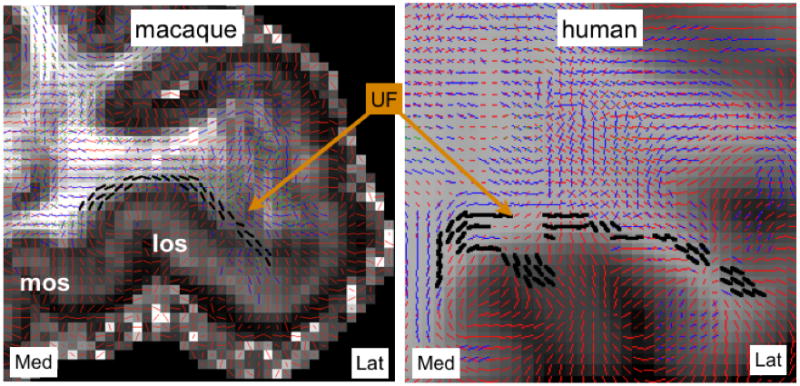
Evidence for lateral projections along the UF in macaques (left) and humans (right). Fiber orientations that run parallel to the cortex have been highlighted in bold black. Key: mos=medial orbital sulcus, los=lateral orbital sulcus.
Route taken by vmPFC pathways through the IC
A set of tracer results that we were not able to replicate in the tractography was the trajectory of vmPFC pathways through the ventral aspects of the IC (see figure 4B). In both the human and the macaque tractography experiments, fibers from the vmPFC entered the IC through a much more dorsal route, merging with the route taken by cOFC pathways.
A potential reason for this discrepancy could be that the tracts were not able to cross the AC’s strongly dominant left-right bundle. However, examining our reconstruction of local fiber orientations from dMRI data in more detail, we found that the crossing fiber model that we used was indeed able to detect a secondary rostro-caudal fiber direction within the dorsal part of the AC. Remarkably, this secondary fiber was only detected at the level of the IC. There was no secondary fiber either lateral or medial to that narrow passage throughout the AC (figure 9A, B). This was true in both species, and provided the vmPFC pathways with the possibility of passing through the AC at the same location as the tracing data. However, the tractography-derived connections from the vmPFC did not pass through the AC; but rather travelled above the AC. On the other hand, our tracer data showed that vmPFC fibers travel through small white matter fascicles embedded within the striatum (figure 9C). Examining dMRI-derived fiber orientations in this area shows that these voxels have low anisotropy and high heterogeneity in orientations, thus the fiber orientations within these voxels did not support the tracer route. Therefore, whilst local orientations within the AC as well as in frontal white matter were compatible with the tracer trajectory, the small fascicles through the striatum were not. Tractography streamlines from the vmPFC seed mask instead followed the route taken by cOFC.
Figure 9.
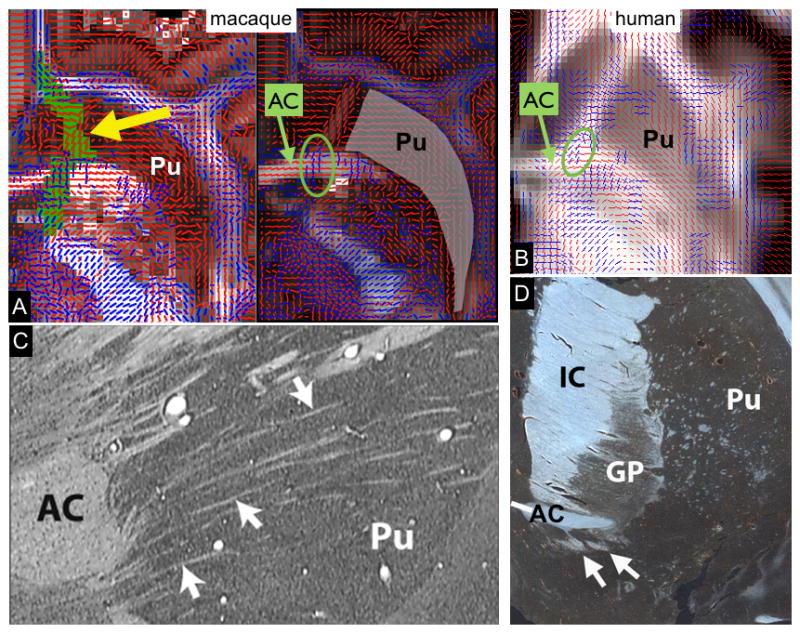
A: Fiber orientations from dMRI in the ventral prefrontal cortex. A: Two axial slices of the macaque brain (1mm apart) showing fibre orientations estimated from bedpostx (main orientation in red, secondary orientation in blue). The trajectory of the vmPFC connections from the chemical tracers data pass through a narrow passage within the striatum with noisy fiber orientations (tract shown in green and indicated by a yellow arrow). Notice the crossing fibers at the level of the AC at the exact location of the tracer’s route. This result is in strong support of the model selection in bedpostx between 1 and 2 fibers per voxels. B: Axial slice of the human brain displaying fiber orientations from bedpostx. Similar to the macaque, crossing fibres are evident in the AC (green circle) at the level of the IC intersection. C: Nissl-stained sagittal section through the macaque brain. Arrows indicate small WM fascicles passing through the ventral striatum. D: GAP-43-stained coronal section through a human striatum. Arrows indicate WM fasclicles passing through the ventral striatum. Key: AC, Anterior commissure; GP, Globus Pallidus; IC, internal capsule; Pu, putamen.
Finally, similar to our finding in macaques, evidence for a presence of vmPFC fibers ventral to the AC, and running through the striatum, can be seen in growth associated protein (GAP-43)-stained sections of human brains (figure 9D), but we did not find such trajectories in the human tractography.
Tractography accuracy
The long and tortuous trajectories of lOFC pathways are a good test-bed for tractography comparisons with chemical tract tracing. As these trajectories were well reconstructed in the tracer data, we could test how well each of the four fiber bundles explored in this study overlapped between the two techniques. Figure 10 shows 3D renderings of tractography results in MAC1a, overlaid on the 3D reconstructed tracing data. We found a high degree of overlap between these two independent techniques, suggesting that frontal lobe dMRI tractography, particularly for lOFC pathways that remain within the WM, is very reliable in the macaques.
Figure 10.
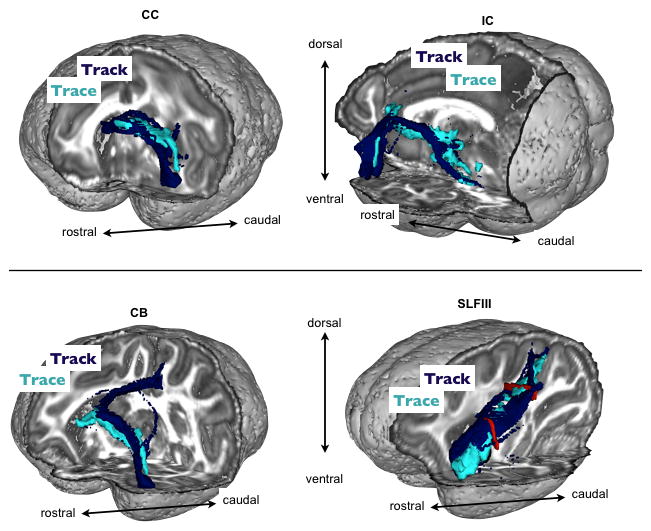
Qualitative comparisons of the 3D trajectories of lOFC connections between tractography (tracking) and chemical tracing. Dark blue=tractography, light blue=tracer. Top panel shows connections to CC and IC. Bottom shows CB and SLFIII projections. The red colours in the bottom right figure show the two planar ROIs used as inclusion masks for the SLFIII connection.
Reproducibility
We also investigated cross-individual reproducibility results for the IC/CC trajectories in both species (3 macaques and 5 humans). In figure 11, the absolute positions of WM trajectories from vmPFC, cOFC and lOFC are shown on a single slice. The data from tractography in humans and monkeys are summarised using crosshairs centred at the mean of the tract histograms. The length of the branches corresponds to the area with 90% of the streamline samples along each dimension (X and Z axes for IC; Y and Z axes for CC). The tracer data are also shown separately for each pair of injections along with the macaque tractography results. The dorso-lateral gradient is evident for all individuals in both IC and CC, although the position of lOFC and cOFC projections to CC is more variable in humans. Note that vmPFC projections are not shown for IC as these did not follow the correct trajectory predicted from the tracer data.
Figure 11.
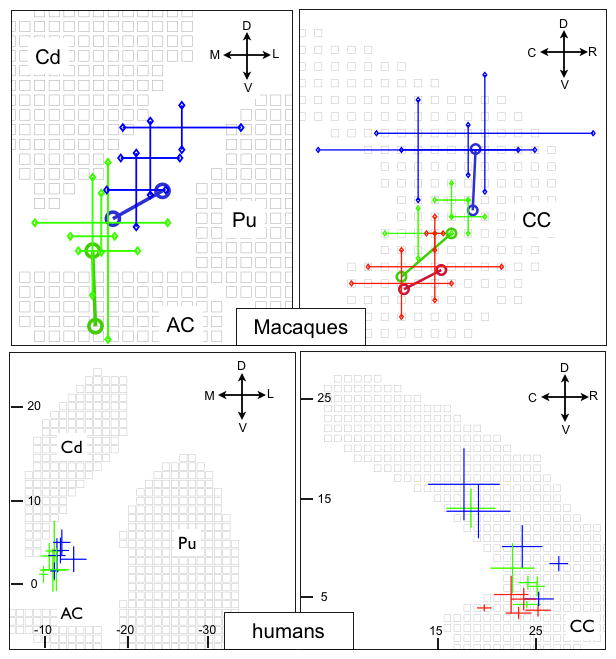
Reproducibility of the trajectories within the IC and CC across 5 humans and 3 macaques. Left/right panels correspond to IC and CC respectively. Top and bottom panels correspond to macaques and humans. The crosses show the position of the probabilistic trajectories from tractography. The crosses are centred on the mean trajectory, and the length of the branches along each axis correspond to the region with 90% of the probability mass. In the top panel, tracer data from two injections per site are also shown (centres of gravity of the pathways displayed as open circles connected by a line to help visualisation). Key: blue=lOFC, green=cOFC, red=vmPFC. Cd=Caudate, Pu=Putamen, AC=Anterior Commissure. Orientation: R, C, D, V, M, L=Rostral, Caudal, Dorsal, Ventral, Medial, Lateral.
Generalizability
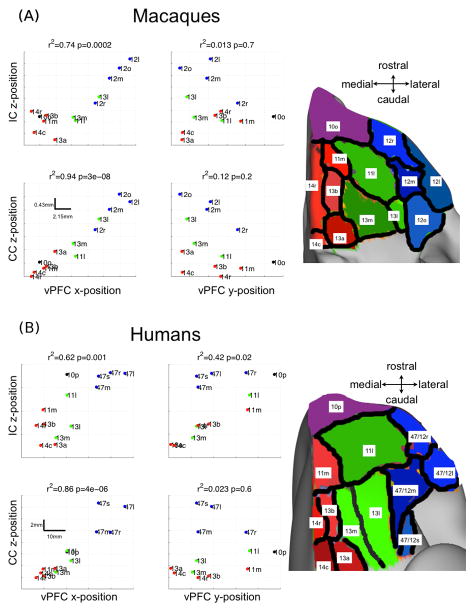
In all the tractography experiments described above, we used three macaque injection site locations (and approximate locations in humans) as seed regions for tractography. However, we also tested the hypothesis that the rules governing the IC and CC pathways, i.e. that their position within the IC and CC is dependent on the medial-lateral cortical region of origin, are more generalizable rules. To do this, we performed tractography from 13 sub-regions covering the entire orbital surface of the macaque and human vPFC. We used sub-regions that are histologically best matched between the two species (Carmichael and Price, 1994, Ongur et al., 2003). Using these sub-regions as seeds for tractography, we analysed the relationship between the positions of the centre of gravity of the vPFC subdivisions and the position of their projections through the IC and CC. Figures 12a and 12b summarise the results of this analysis. Of particular importance, we found that the medial-lateral position of the vPFC sub-regions correlate highly with the dorso-ventral position of pathways entering the IC and CC across the vPFC surface. In contrast, the rostral-caudal cortical position does not demonstrate this correlation. In the case of human connections to the IC, the rostro-caudal axis also shows a correlation with position in the IC, although the correlation is weaker than for the medial-lateral axis. This is due to the fact that the medial-lateral and rostro-caudal positions of sub-divisions in human vPFC are correlated. Indeed, after regressing out the medial-lateral positions, the correlation between rostro-caudal vPFC position and IC pathway position is no longer significant.
Figure 12.
Macaque (A) and human (B) whole vPFC analysis of WM projections in the IC and CC. Left panel: The scatter plots show the positions of the centres of gravity (COG) of the vPFC seed regions plotted against the COG of the pathways. It is clear that the x-position (medial-lateral) of the seed regions correlate significantly with the z-position (ventral-dorsal) of the IC and CC projections (R-squared statistics and p-values shown on the plots). This is not the case for the y-position (rostro-caudal) of the seed regions. Right panel: subdivision of the vPFC into 13 regions according to (Carmichael and Price, 1994) for macaques and (Ongur et al., 2003) for humans. The regions are coloured in red/green/blue according to their approximate medial-dorsal positions for ease of visualisation. Anterior regions 10o and 10p are coloured differently because they span both medial and central positions. The nomenclature of the regions follows the convention adopted by (Ongur et al., 2003). On the scatter plots in panel (B), the sub-regions 47/12x are simply labelled 47x.
Some vPFC subdivisions show notable differences between species. For instance, region 13l in macaques is more similar to lOFC than cOFC subdivisions, both in terms of its position within the vPFC, and the position of its connections to the IC and CC. In addition, areas 10p/10o, 13m and 11l have a different medial-lateral extent in the two species. This difference induces a shift in the position of the pathways in the IC and CC. For example, human area 10p extends much more laterally than homologous macaque area 10o. Therefore, it is not surprising that the center of gravity of its IC and CC projections in humans are more dorsal than in macaques. A similar argument can be made for 11l and 13m, only this time it is the macaque areas that are more extended medio-laterally.
Our analysis of the whole vPFC shows that the rules of organisation that we have inferred from tracer injections into localised regions of the vPFC generalise to the entire vPFC. The medial-lateral position within vPFC dictates the position of connections as they enter the IC and CC, and this rule applies in both humans and macaques.
Discussion
Summary
In this paper, we compared the organization of vPFC white matter connections between macaques and humans. Overall, we found that all organizational principles that were both predicted from chemical tracing in macaques and replicated with macaque tractography, were also present in humans. These organizational rules include the rotation in the trajectory of vPFC pathways before reaching the IC and CC (Figures 4 and 5). In both species, these connections rotate from a medial-lateral position in the cortex into a ventral-dorsal gradient in IC and CC. Using tractography seeded from histologically-matched atlases of the macaque and humans vPFC, we also showed that this rule generalizes across the entire vPFC cortex. The second rule that was common across species was the separation of IC tracts into dorsal thalamic and ventral brainstem sub-bundles immediately caudal to the anterior commissure (figure 6). This also followed predictions from the tracer data in macaques.
The two other fiber bundles that we have investigated here, CB and SLFIII, also followed the same organization in both species: whilst all vPFC seed regions projected to the CB, only lOFC projected to SLFIII. This result, observed in the macaque tracer data, was found in tractography of both macaques and humans. Furthermore, CB connections from vPFC followed the same route as predicted in the tracing data (figure 7).
Despite the large similarities between the white matter trajectories across species and techniques, there are some fine grained differences in many of the pathways we report. These differences could be due to variations between individuals and species or between tracing techniques. Alternatively they could be due to more mundane factors such as noise in individual datasets or errors in alignment between MR and histological datasets. Despite these differences in the fine details of individual pathways, the rules of white matter organization are preserved across techniques and species.
One tracer result that was not replicated by macaque tractography was the trajectory of vmPFC connections through the IC. We hypothesise that, in order to follow the ventral trajectory observed in macaque tract tracing, fiber bundles from vmPFC need to pass through small fascicles embedded within the ventral striatum and crossing the anterior commissure. These small white matter bundles are part of the internal capsule, in that they carry descending vPFC fibers (Lehman et al., 2011). These bundles are visualized histologically in both macaques and humans (figures 9C and 9D).
General rules for the vPFC
Our analysis of the whole vPFC (figures 12a and 12b) shows that the rules of organization that we have inferred from tracer injections in localized regions of the vPFC generalize to the entire vPFC. This is an important result. The ventral-dorsal orientation in the IC and CC can be viewed as a WM “axis”. We show how this axis relates to position within the ventral prefrontal cortex. Determining this type of relationships between position in the white matter and grey matter could be important for interpreting WM microstructural changes, or more generally help segmentation of WM into relevant functional sub-sections.
Tractography vs chemical tracers
The tracer data that we used in this article is an ideal test bed for tractography. Connections from different parts of vPFC demonstrate a certain number of non-trivial and challenging trajectories. Their precise arrangement has been described in great detail in (Lehman et al., 2011). Also, contrary to most chemical tracer studies, we have carefully reconstructed the whole trajectories through white matter, in 3-D, thus illustrating not only the termination sites. This allowed us the unusual opportunity to compare the location of white matter trajectories from different vPFC regions within the same species, and therefore provided the foundation and a guide for improving the accuracy of tractography first in monkeys and then applied to humans.
Few studies have directly compared tractography to chemical tracing in animals (see (Hubbard and Parker, 2009) for a good review). These studies have so far considered large bundles that are relatively easy to reconstruct using dMRI tractography (Dauguet et al., 2007, Dyrby et al., 2007) or trajectories through more complex crossing fiber regions (Schmahmann et al., 2007). Collectively these studies have made important advances in demonstrating the ability of tractography to track the major long association and projection bundles that have been well described using human post mortem dissection methods (Déjerine, 1895) and animal tracing methods (Schmahmann and Pandya, 2006), but have not tested precise dissociations such as those presented in the current study.
Multimodal comparative anatomy
The results we report here represent an important new direction for tracing and tractography. Our proposed approach of combining techniques and species is a three-stage exploration of connectivity that is generalizable to many more brain connections. First, we used the gold-standard method of chemical tracing in the macaque monkey. Second, we used tractography in the same species as a link for understanding the limitations of tractography in humans for detecting the same connections. Third, we use tractography in humans to determine whether axons from the vPFC follow the same rules as those in monkeys to reach their targets.
Our novel combination of techniques allows us to be confident in the results of tractography in humans, as they are supported by the within-species comparison to the more reliable techniques of chemical tracing. In this respect, it is interesting to note that the only tracking result in humans that did not fit macaque predictions was the one that could not be found in macaque tractography. The failure of tracking the correct vmPFC pathways through the IC illustrates the difficulty of tracking through small fascicles embedded within grey matter. This limitation of diffusion tractography may be overcome, in some cases, with the acquisition of high quality and high-resolution datasets (Miller et al., 2012, Miller et al., 2011).
Implications for functional studies of the frontal lobes
A precise understanding of the anatomy of human ventral prefrontal white matter is of central importance for theories of cognition and reward-guided behaviour, and for better understanding of the psychiatric conditions in which these white matter regions are implicated (Ardekani et al., 2011, Kawashima et al., 2009, Mitelman et al., 2007). More generally, however, the ventral prefrontal cortex is amongst the brain regions that have encountered the greatest evolutionary changes between macaques and humans (Wise, 2008). Nevertheless, we demonstrate that the rules white matter trajectories use in macaques are also respected in the human brain. That is, we test directly the common assumption that connectional organization inferred from macaque tracer studies has direct relevance in the human.
Finally, our data have important implications for understanding changes in white matter tracts associated with disease. DTI studies demonstrate changes in large WM pathways, such as the CC, anterior limb of IC and UF, associated with different psychiatric diseases (Ardekani et al., 2011, Kawashima et al., 2009, Mitelman et al., 2007). These large white matter bundles carry fibers from multiple frontal regions, but so far, the general disruption of white matter integrity could not be linked to specific connections. Our data will help guide DTI analysis and ROI placements within these bundles. Thus, for example, knowing the relative position of specific pathways from the vPFC through the IC, CC, and UF, it is now possible to be more precise in identifying the likely cortical connections associated with white matter changes.
Acknowledgments
The authors are grateful to Adam G Thomas for the human in-vivo MRI data, and to Alex J de Crespigny, Helen E D’Arceuil and James K Rilling for the ex-vivo macaque MRI data. We would like to acknowledge funding from the EU CONNECT project (238292), the UK Wellcome Trust (WT088312AIA), the NIH (MH086400 and MH73111) and the Human Connectome Project (1U54MH091657-01) from the 16 NIH Institutes and Centers that support the NIH Blueprint for Neuroscience Research.
Footnotes
Conflict of Interests: None
References
- ALEXANDER AL, TSURUDA JS, PARKER DL. Elimination of eddy current artifacts in diffusion-weighted echo-planar images: the use of bipolar gradients. Magn Reson Med. 1997;38:1016–21. doi: 10.1002/mrm.1910380623. [DOI] [PubMed] [Google Scholar]
- ANDERSSON JLJX, YACOUB E, AUERBACH E, MOELLER S, UGURBIL K. A comprehensive gaussian process framework for correcting distortions and movements in diffusion images. International Society for Magnetic Resonance in Medicine (ISMRM); Melbourne, Australia: 2012. p. 2426. [Google Scholar]
- ANDERSSON JL, SKARE S, ASHBURNER J. How to correct susceptibility distortions in spin-echo echo-planar images: application to diffusion tensor imaging. Neuroimage. 2003;20:870–88. doi: 10.1016/S1053-8119(03)00336-7. [DOI] [PubMed] [Google Scholar]
- ARDEKANI BA, TABESH A, SEVY S, ROBINSON DG, BILDER RM, SZESZKO PR. Diffusion tensor imaging reliably differentiates patients with schizophrenia from healthy volunteers. Hum Brain Mapp. 2011;32:1–9. doi: 10.1002/hbm.20995. [DOI] [PMC free article] [PubMed] [Google Scholar]
- BEHRENS TE, BERG HJ, JBABDI S, RUSHWORTH MF, WOOLRICH MW. Probabilistic diffusion tractography with multiple fibre orientations: What can we gain? Neuroimage. 2007;34:144–55. doi: 10.1016/j.neuroimage.2006.09.018. [DOI] [PMC free article] [PubMed] [Google Scholar]
- CARMICHAEL ST, PRICE JL. Architectonic subdivision of the orbital and medial prefrontal cortex in the macaque monkey. J Comp Neurol. 1994;346:366–402. doi: 10.1002/cne.903460305. [DOI] [PubMed] [Google Scholar]
- CHIAVARAS MM, LEGOUALHER G, EVANS A, PETRIDES M. Three-dimensional probabilistic atlas of the human orbitofrontal sulci in standardized stereotaxic space. Neuroimage. 2001;13:479–96. doi: 10.1006/nimg.2000.0641. [DOI] [PubMed] [Google Scholar]
- CROXSON PL, JOHANSEN-BERG H, BEHRENS TE, ROBSON MD, PINSK MA, GROSS CG, RICHTER W, RICHTER MC, KASTNER S, RUSHWORTH MF. Quantitative investigation of connections of the prefrontal cortex in the human and macaque using probabilistic diffusion tractography. J Neurosci. 2005;25:8854–66. doi: 10.1523/JNEUROSCI.1311-05.2005. [DOI] [PMC free article] [PubMed] [Google Scholar]
- D’ARCEUIL HE, WESTMORELAND S, DE CRESPIGNY AJ. An approach to high resolution diffusion tensor imaging in fixed primate brain. Neuroimage. 2007;35:553–65. doi: 10.1016/j.neuroimage.2006.12.028. [DOI] [PubMed] [Google Scholar]
- DAUGUET J, PELED S, BEREZOVSKII V, DELZESCAUX T, WARFIELD SK, BORN R, WESTIN CF. Comparison of fiber tracts derived from in-vivo DTI tractography with 3D histological neural tract tracer reconstruction on a macaque brain. Neuroimage. 2007;37:530–8. doi: 10.1016/j.neuroimage.2007.04.067. [DOI] [PubMed] [Google Scholar]
- DE CRESPIGNY AJ, D’ARCEUIL HE, MAYNARD KI, HE J, MCAULIFFE D, NORBASH A, SEHGAL PK, HAMBERG L, HUNTER G, BUDZIK RF, PUTMAN CM, GONZALEZ RG. Acute studies of a new primate model of reversible middle cerebral artery occlusion. J Stroke Cerebrovasc Dis. 2005;14:80–7. doi: 10.1016/j.jstrokecerebrovasdis.2004.12.005. [DOI] [PubMed] [Google Scholar]
- DÉJERINE J. Anatomie des centres nerveux. Paris: Rueff et Cie; 1895. [Google Scholar]
- DYRBY TB, SOGAARD LV, PARKER GJ, ALEXANDER DC, LIND NM, BAARE WF, HAY-SCHMIDT A, ERIKSEN N, PAKKENBERG B, PAULSON OB, JELSING J. Validation of in vitro probabilistic tractography. Neuroimage. 2007;37:1267–77. doi: 10.1016/j.neuroimage.2007.06.022. [DOI] [PubMed] [Google Scholar]
- HUBBARD PL, PARKER GJM. Validation of Tractography. Elsevier; 2009. [Google Scholar]
- JBABDI S, SOTIROPOULOS SN, SAVIO AM, GRANA M, BEHRENS TE. Model-based analysis of multishell diffusion MR data for tractography: How to get over fitting problems. Magn Reson Med. 2012 doi: 10.1002/mrm.24204. [DOI] [PMC free article] [PubMed] [Google Scholar]
- JENKINSON M, BANNISTER P, BRADY M, SMITH S. Improved optimization for the robust and accurate linear registration and motion correction of brain images. Neuroimage. 2002;17:825–841. doi: 10.1016/s1053-8119(02)91132-8. [DOI] [PubMed] [Google Scholar]
- JENKINSON M, BECKMANN CF, BEHRENS TE, WOOLRICH MW, SMITH SM. Fsl. Neuroimage. 2012;62:782–90. doi: 10.1016/j.neuroimage.2011.09.015. [DOI] [PubMed] [Google Scholar]
- KAWASHIMA T, NAKAMURA M, BOUIX S, KUBICKI M, SALISBURY DF, WESTIN CF, MCCARLEY RW, SHENTON ME. Uncinate fasciculus abnormalities in recent onset schizophrenia and affective psychosis: a diffusion tensor imaging study. Schizophr Res. 2009;110:119–26. doi: 10.1016/j.schres.2009.01.014. [DOI] [PMC free article] [PubMed] [Google Scholar]
- KREMER JR, MASTRONARDE DN, MCINTOSH JR. Computer visualization of three-dimensional image data using IMOD. J Struct Biol. 1996;116:71–6. doi: 10.1006/jsbi.1996.0013. [DOI] [PubMed] [Google Scholar]
- LEHMAN JF, GREENBERG BD, MCINTYRE CC, RASMUSSEN SA, HABER SN. Rules ventral prefrontal cortical axons use to reach their targets: implications for diffusion tensor imaging tractography and deep brain stimulation for psychiatric illness. J Neurosci. 2011;31:10392–402. doi: 10.1523/JNEUROSCI.0595-11.2011. [DOI] [PMC free article] [PubMed] [Google Scholar]
- MILLER KL, MCNAB JA, JBABDI S, DOUAUD G. Diffusion tractography of post-mortem human brains: optimization and comparison of spin echo and steady-state free precession techniques. Neuroimage. 2012;59:2284–97. doi: 10.1016/j.neuroimage.2011.09.054. [DOI] [PMC free article] [PubMed] [Google Scholar]
- MILLER KL, STAGG CJ, DOUAUD G, JBABDI S, SMITH SM, BEHRENS TE, JENKINSON M, CHANCE SA, ESIRI MM, VOETS NL, JENKINSON N, AZIZ TZ, TURNER MR, JOHANSEN-BERG H, MCNAB JA. Diffusion imaging of whole, post-mortem human brains on a clinical MRI scanner. Neuroimage. 2011;57:167–81. doi: 10.1016/j.neuroimage.2011.03.070. [DOI] [PMC free article] [PubMed] [Google Scholar]
- MITELMAN SA, TOROSJAN Y, NEWMARK RE, SCHNEIDERMAN JS, CHU KW, BRICKMAN AM, HAZNEDAR MM, HAZLETT EA, TANG CY, SHIHABUDDIN L, BUCHSBAUM MS. Internal capsule, corpus callosum and long associative fibers in good and poor outcome schizophrenia: a diffusion tensor imaging survey. Schizophr Res. 2007;92:211–24. doi: 10.1016/j.schres.2006.12.029. [DOI] [PubMed] [Google Scholar]
- ONGUR D, FERRY AT, PRICE JL. Architectonic subdivision of the human orbital and medial prefrontal cortex. J Comp Neurol. 2003;460:425–49. doi: 10.1002/cne.10609. [DOI] [PubMed] [Google Scholar]
- PETRIDES M, ALIVISATOS B, FREY S. Differential activation of the human orbital, mid-ventrolateral, and mid-dorsolateral prefrontal cortex during the processing of visual stimuli. Proc Natl Acad Sci U S A. 2002;99:5649–54. doi: 10.1073/pnas.072092299. [DOI] [PMC free article] [PubMed] [Google Scholar]
- RILLING JK, GLASSER MF, JBABDI S, ANDERSSON J, PREUSS TM. Continuity, divergence, and the evolution of brain language pathways. Front Evol Neurosci. 2011;3:11. doi: 10.3389/fnevo.2011.00011. [DOI] [PMC free article] [PubMed] [Google Scholar]
- RILLING JK, GLASSER MF, PREUSS TM, MA X, ZHAO T, HU X, BEHRENS TE. The evolution of the arcuate fasciculus revealed with comparative DTI. Nat Neurosci. 2008;11:426–8. doi: 10.1038/nn2072. [DOI] [PubMed] [Google Scholar]
- SCHMAHMANN JD, PANDYA DN. Fibre pathways of the brain. New York: Oxford UP; 2006. [Google Scholar]
- SCHMAHMANN JD, PANDYA DN, WANG R, DAI G, D’ARCEUIL HE, DE CRESPIGNY AJ, WEDEEN VJ. Association fibre pathways of the brain: parallel observations from diffusion spectrum imaging and autoradiography. Brain. 2007;130:630–53. doi: 10.1093/brain/awl359. [DOI] [PubMed] [Google Scholar]
- SCHOENEMANN PT, SHEEHAN MJ, GLOTZER LD. Prefrontal white matter volume is disproportionately larger in humans than in other primates. Nat Neurosci. 2005;8:242–52. doi: 10.1038/nn1394. [DOI] [PubMed] [Google Scholar]
- SMITH SM, JENKINSON M, WOOLRICH MW, BECKMANN CF, BEHRENS TE, JOHANSEN-BERG H, BANNISTER PR, DE LUCA M, DROBNJAK I, FLITNEY DE, NIAZY RK, SAUNDERS J, VICKERS J, ZHANG Y, DE STEFANO N, BRADY JM, MATTHEWS PM. Advances in functional and structural MR image analysis and implementation as FSL. Neuroimage. 2004;23(Suppl 1):S208–19. doi: 10.1016/j.neuroimage.2004.07.051. [DOI] [PubMed] [Google Scholar]
- SUN SW, NEIL JJ, LIANG HF, HE YY, SCHMIDT RE, HSU CY, SONG SK. Formalin fixation alters water diffusion coefficient magnitude but not anisotropy in infarcted brain. Magn Reson Med. 2005;53:1447–51. doi: 10.1002/mrm.20488. [DOI] [PubMed] [Google Scholar]
- THIEBAUT DE SCHOTTEN M, DELL’ACQUA F, VALABREGUE R, CATANI M. Monkey to human comparative anatomy of the frontal lobe association tracts. Cortex. 2012;48:82–96. doi: 10.1016/j.cortex.2011.10.001. [DOI] [PubMed] [Google Scholar]
- VAN ESSEN DC, GLASSER MF, DIERKER DL, HARWELL J. Cortical parcellations of the macaque monkey analyzed on surface-based atlases. Cereb Cortex. 2012a;22:2227–40. doi: 10.1093/cercor/bhr290. [DOI] [PMC free article] [PubMed] [Google Scholar]
- VAN ESSEN DC, GLASSER MF, DIERKER DL, HARWELL J, COALSON T. Parcellations and hemispheric asymmetries of human cerebral cortex analyzed on surface-based atlases. Cereb Cortex. 2012b;22:2241–62. doi: 10.1093/cercor/bhr291. [DOI] [PMC free article] [PubMed] [Google Scholar]
- WEDEEN VJ, ROSENE DL, WANG R, DAI G, MORTAZAVI F, HAGMANN P, KAAS JH, TSENG WY. The geometric structure of the brain fiber pathways. Science. 2012;335:1628–34. doi: 10.1126/science.1215280. [DOI] [PMC free article] [PubMed] [Google Scholar]
- WISE SP. Forward frontal fields: phylogeny and fundamental function. Trends Neurosci. 2008;31:599–608. doi: 10.1016/j.tins.2008.08.008. [DOI] [PMC free article] [PubMed] [Google Scholar]
- WOOLRICH MW, JBABDI S, PATENAUDE B, CHAPPELL M, MAKNI S, BEHRENS T, BECKMANN C, JENKINSON M, SMITH SM. Bayesian analysis of neuroimaging data in FSL. Neuroimage. 2009;45:S173–86. doi: 10.1016/j.neuroimage.2008.10.055. [DOI] [PubMed] [Google Scholar]
- YETERIAN EH, PANDYA DN, TOMAIUOLO F, PETRIDES M. The cortical connectivity of the prefrontal cortex in the monkey brain. Cortex. 2012;48:58–81. doi: 10.1016/j.cortex.2011.03.004. [DOI] [PMC free article] [PubMed] [Google Scholar]
- ZHANG Y, BRADY M, SMITH S. Segmentation of brain MR images through a hidden Markov random field model and the expectation-maximization algorithm. IEEE Trans Med Imaging. 2001;20:45–57. doi: 10.1109/42.906424. [DOI] [PubMed] [Google Scholar]


