Abstract
The carpal tunnel accommodates free movement of its contents, and the tunnel’s cross-sectional area is a useful morphological parameter for the evaluation of the space available for the carpal tunnel contents and of potential nerve compression in the tunnel. The osseous boundary of the carpal bones as the dorsal border of the carpal tunnel is commonly used to determine the tunnel area, but this boundary contains soft tissues such as numerous intercarpal ligaments and the flexor carpi radialis tendon. The aims of this study were to quantify the thickness of the soft tissues abutting the carpal bones and to investigate how this soft tissue influences the calculation of the carpal tunnel area. Magnetic resonance images were analyzed for eight cadaveric specimens. A medical balloon with a physiological pressure was inserted into an evacuated tunnel to identify the carpal tunnel boundary. The balloon-based (i.e. true carpal tunnel) and osseous-based carpal tunnel boundaries were extracted and divided into regions corresponding to the hamate, capitate, trapezoid, trapezium, and transverse carpal ligament (TCL). From the two boundaries, the overall and regional soft tissue thicknesses and areas were calculated. The soft tissue thickness was significantly greater for the trapezoid (3.1±1.2mm) and trapezium (3.4±1.0mm) regions than for the hamate (0.7±0.3mm) and capitate (1.2±0.5mm) regions. The carpal tunnel area using the osseous boundary (243.0±40.4mm2) was significantly larger than the balloon-based area (183.9±29.7mm2) with a ratio of 1.32. In other words, the carpal tunnel area can be estimated as 76% (= 1/1.32) of the osseous-based area. The abundance of soft tissue in the trapezoid and trapezium regions can be attributed mainly to the capitate-trapezium ligament and the flexor carpi radialis tendon. Inclusion of such soft tissue leads to overestimations of the carpal tunnel area. Correct quantification of the carpal tunnel area aids in examining carpal tunnel stenosis as a potential risk factor for median nerve compression.
Keywords: area, carpal tunnel, carpal tunnel syndrome, stenosis
1 Introduction
The carpal tunnel is an open compartment containing the nine flexor tendons and the median nerve. The volar border of the carpal tunnel is composed of the transverse carpal ligament (TCL), and the dorsal border is formed by the carpal bones connected by numerous intercarpal ligaments. The proximal carpal bones are the scaphoid, lunate, triquetrum, and pisiform; the distal carpal bones are the trapezium, trapezoid, capitate, and hamate. On the radial aspect of the carpal tunnel the TCL divides to form a separate compartment for the flexor carpi radialis tendon. The carpal tunnel is more compliant at the proximal, pisiform level, in comparison to the distal, hamate level (1), and the median nerve is prone to compression at the distal level (2, 3).
Morphological parameters of the carpal tunnel provide useful information for the diagnosis and the evaluation of tunnel stenosis and median nerve compression (4-7). Some morphological parameters of interest include the carpal tunnel cross-sectional area (CSA) (4, 7-12) and the ratio of the area occupied by the carpal tunnel contents to the tunnel’s CSA (11-13). However, quantifying morphological parameters is limited by the imaging modality used. Computed tomography (CT) is often used to measure the carpal tunnel’s CSA (4, 7, 12, 14), but this imaging modality is deficient in indentifying specific soft tissue structures. Some studies were unable to visualize the TCL when quantifying the tunnel’s CSA (4, 7), while an additional study reported difficulty in distinguishing the flexor carpi radialis tendon from the carpal tunnel (12). Magnetic resonance imaging (MRI) can discriminate tissues, but it provides less detail about osseous structures than with CT imaging. The limitations associated with each imaging modality may account for large discrepancies among studies that measure the carpal tunnel CSA with CT (4, 7, 12, 14) or MRI (9-11, 15-19).
Inconsistencies among studies that measure the carpal tunnel CSA may be due to the inclusion of soft tissues that lie between the carpal tunnel and the osseous boundary. The purposes of this study were (1) to quantify the thickness distribution of the soft tissues that abut the carpal tunnel interior to the carpal bones and (2) to examine the influence of the thickness distribution on the calculation of the carpal tunnel CSA. We hypothesized that the thickness of the soft tissues is unevenly distributed across the bony regions. With inclusion of the soft tissues into the carpal tunnel CSA measurement, we hypothesized that the area available for the carpal tunnel contents would be overestimated.
2 Methods
MRI data from a previous study (20), consisting of eight fresh frozen cadaveric hand specimens (47.4 ± 5.2 yrs) with no previously documented wrist injuries or surgeries, were used in this study. Briefly summarizing, the carpal tunnel was evacuated by removing the carpal tunnel contents. A custom pressure device, consisting of a medical balloon filled with a magnetic resonance contrast agent, was used to apply a nominal physiologic pressure of 10 mmHg within the carpal tunnel. An extremity MRI system (1.0 T, ONI Medical Systems Inc, Wilmington, MA) was used to obtain cross-sectional images of the wrist with a 150 × 150 mm2 field of view and 260 × 192 matrix by a 3D gradient echo (TR = 30 ms, TE = 8.9 ms, flip angle = 35°). The cross-sectional images were oriented perpendicular to the dorsal surface of the carpal tunnel with 1 mm slice thickness. The cross-section corresponding to the hook of the hamate and the ridge of the trapezium were chosen for subsequent analysis.
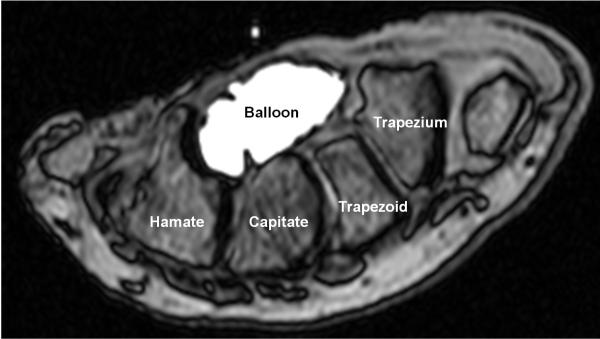
The ImageJ (v1.43, National Institutes of Health, USA) multi-point tool was used on the MRI data to generate coordinates of the envelope formed by (a) the TCL and the osseous boundary of carpal bones, i.e. bone-based boundary, and (b) the carpal tunnel boundary based on the balloon, i.e. balloon-based boundary. See Figure 1 as an example. A convex hull technique was applied to reconstruct the boundaries. The coordinates were also generated for the attachment sites of the TCL on the hook of the hamate and the ridge of the trapezium, as well as the midpoints of the hamate-capitate, the capitate-trapezoid, and the trapezoid-trapezium joints. All coordinates were inputted into a custom MATLAB program (MathWorks, Natick, MA) for subsequent data analyses.
Figure 1.
A representative MRI of the carpal tunnel and balloon cross-section at the hook of the hamate level
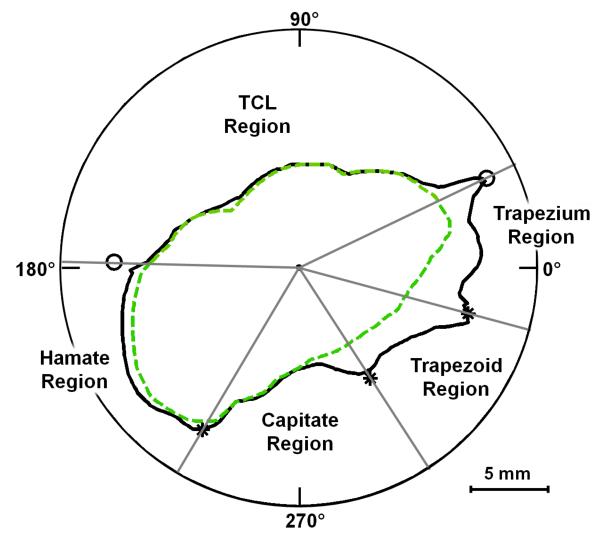
The coordinates were converted into polar coordinates (r, θ) with the geometric centroid of the balloon serving as the origin. Linear interpolation was used to determine the radius of the boundaries at each degree. The two boundaries were then organized into five separate regions (Figure 2):
TCL - from the ridge of the trapezium to the hook of the hamate
Hamate - from the hook of the hamate to the hamate-capitate midpoint
Capitate - from the hamate-capitate midpoint to the capitate-trapezoid midpoint
Trapezoid - from the capitate-trapezoid midpoint to the trapezoid-trapezium midpoint
Trapezium - from the trapezoid-trapezium midpoint to the ridge of the trapezium
For each region, the soft tissue thickness, the bone-based area, and the balloon-based area were calculated. The soft tissue thickness was calculated at each degree as the difference between the two radii of the bone-based and the balloon-based boundaries. The thickness was also normalized with respect to the carpal arch width, the distance between the hook of the hamate and the ridge of the trapezium. The soft tissue thickness in each region was calculated by averaging the thickness distributions within the region. The overall and the regionalized bone- and balloon-based areas were also calculated.
Figure 2.
Polar plot, from the MRI shown in Figure 1, displaying the bone-based (solid line) and balloon-based (dashed line) boundaries as well as their regional divisions (* denotes the joint midpoints, and o denotes the TCL attachment sites)
A one-way repeated measures ANOVA was performed to determine the dependence of the soft tissue thickness on each region (Hamate, Capitate, Trapezoid, Trapezium, and TCL). Post-hoc Tukey Tests were performed for pairwise comparisons. Carpal tunnel areas based on bone- and balloon-boundaries were compared using a Wilcoxon signed rank test. All statistical tests were evaluated with a significance of 0.05.
3 Results
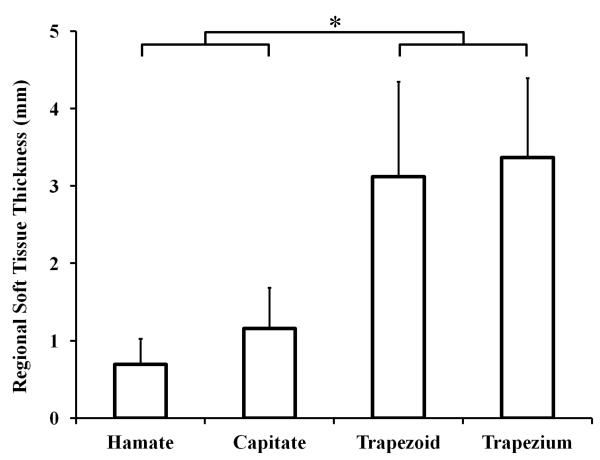
The carpal arch width was 21.6 ± 2.7 mm. The overall soft tissue thickness (excluding the TCL region) was 1.6 ± 0.4 mm with a normalized thickness, with respect to the carpal arch width, of 7.6 ± 1.8%. The soft tissue thickness (and normalized values) for the hamate, capitate, trapezoid, and trapezium regions were 0.7 ± 0.3 mm (3.1 ± 1.2%), 1.2 ± 0.5 mm (5.5 ± 2.6%), 3.1 ± 1.2 mm (14.6 ± 5.8%), and 3.4 ± 1.0 mm (15.7 ± 5.0%), respectively (Figure 3). The soft tissue thickness of the TCL region was negligible, 0.2 ± 0.1 mm (0.9 ± 0.5% of the carpal arch width). The soft tissue thickness was significantly different for the different regions (p<0.001). Specifically, the soft tissue thicknesses for the trapezoid and trapezium regions were significantly greater than those of the hamate and capitate regions (p<0.001).
Figure 3.
Average soft tissue thickness of the bony regions; * p<0.001
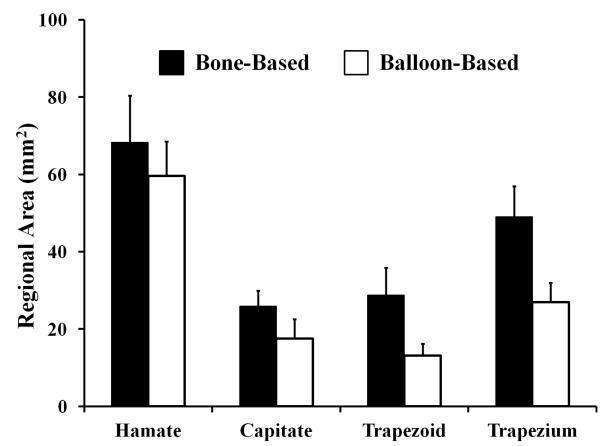
The bone- and balloon-based carpal tunnel areas were statistically different with values of 243.0 ± 40.4 mm2 and 183.9 ± 29.7 mm2, respectively (p<0.001). The resulting ratio of the bone-based area to the balloon-based area was 1.32 ± 0.07. Likewise, the regional areas for the bone-based boundary were larger than those of the balloon-based boundary (p < 0.05; Figure 4). The regional difference between the bone-based and the balloon- based areas were 8.6 ± 4.5 mm2 for the hamate, 8.3 ± 3.6 mm2 for the capitate, 15.6 ± 6.5 mm2 for the trapezoid, and 22.0 ± 5.7 mm2 for the trapezium. The area difference for the TCL region was small at 4.3 ± 2.8 mm2. The regional area overestimations, in comparison to the balloon-based values, were 14 ± 6%, 54 ± 33%, 124 ± 59%, 84 ± 27%, and 7 ± 5% for the hamate, capitate, trapezoid, trapezium, and TCL regions, respectively. For the overestimation (32%) of the total area, the contribution from individual regions were 5 ± 2% for the hamate, 5 ± 2% for the capitate, 8 ± 3% for the trapezoid, 12 ± 3% for the trapezium, and 2 ± 1% for the TCL.
Figure 4.
Regional areas for the bone- and balloon-based boundaries
4 Discussion
In this study, a medical balloon filled with a MRI contrast fluid maintained a constant physiologic pressure and it clearly defined the balloon-based carpal tunnel boundary. The balloon-based area was considered to be the true representation of the carpal tunnel CSA that is the available for the carpal tunnel contents. The bone-based area was the area enclosed by the carpal bones, dorsally, and the TCL, volarly, and this area contains structures that are not a part of the true carpal tunnel as it includes various interosseous ligaments and the flexor carpi radialis tendon.
We found that the soft tissue thickness was unevenly distributed across the bone regions with the trapezoid and trapezium regions having an abundance of soft tissue. This soft tissue includes intercarpal ligaments and the flexor carpi radialis tendon. For example, the larger quantity of soft tissue for the trapezium region is due to the capitate-trapezium ligament and the flexor carpi radialis tendon with its fibro-osseous tunnel formed by the TCL and the trapezium (6). For the trapezoid region, the soft tissue thickness is due to the capitate-trapezium ligament which is also a site for developing fat (21). Inclusion of these soft tissues as a part of the carpal tunnel CSA leads to erroneous representation of the open space available to the flexor tendons and the median nerve within the carpal tunnel
Our study has determined that there were differences between the bone-based and the balloon-based areas. Our bone-based area measurement agrees well, within one standard deviation (202.6—283.4 mm2), with the literature (4, 7, 12). Dekel et al. and Papaionnaou et al. defined the carpal tunnel as the osseous boundary and a line connecting the hook of the hamate and the ridge of the trapezium because the TCL was not visible within the CT image. Using this description of the carpal tunnel boundary, the studies reported the carpal tunnel CSA, averaging data for males and females, to be 232 mm2 (4) and 264 mm2 (7) respectively. Merher et al. was able to visualize the TCL within the CT image, but stated that it was difficult to separate the carpal tunnel from the flexor carpi radialis tendon resulting in a carpal tunnel CSA of 219 mm2 (12). The inability to visualize and distinguish the soft tissues, e.g. TCL or flexor carpi radialis tendon, is associated with the limitations of CT imaging, and MRI has an advantage for discriminating soft tissues. However, many MRI studies used the bone boundary to measure the carpal tunnel CSA with values ranging from 152 to 382 mm2 (9, 10, 17). A study using MRI was able to exclude the flexor carpi radialis tendon from the carpal tunnel CSA measurement, but still used the bone boundary reporting an area of 152 mm2 (19). Despite the imaging modality, using the bone boundary is an inaccurate method of defining the carpal tunnel CSA because it includes the flexor carpi radialis tendon and various intercarpal ligaments covering the carpal bones which are extraneous to the carpal tunnel (6).
The balloon-based area agrees well with several MRI studies that use the true carpal tunnel boundary to quantify the carpal tunnel CSA. Specifically, three studies were within one standard deviation (30 mm2) of our measurement of 184 mm2. Bower et al. reported a carpal tunnel CSA of 182 mm2 (18), while Cobb et al. reported a tunnel CSA of 183 mm2 (11). Mogk and Keir determined a carpal tunnel CSA of 171 mm2 (8). It is therefore reasonable that our balloon-based area reflects the carpal tunnel area based on the true carpal tunnel boundaries. Furthermore, the bone-based area is 1.32 times that of the balloon-based area. This implies that previous studies using the bone-based area overestimated the carpal tunnel CSA by 32% (4, 7, 10, 12). Practically, when the true carpal tunnel border is not easily identifiable, the bone-boundary can be used to estimate the true carpal tunnel area using a correction factor of 0.76 (= 1/1.32). Our results are in agreement with another study that reported a correction factor of 0.816 for determination of true carpal tunnel volume accommodating for the soft tissues, i.e. interosseous ligaments, abut the carpal bones (22).
The 32% overestimation of the entire carpal tunnel area was categorized into the individual bone regions using the difference between the bone- and balloon-based areas. Our results show that the contributions to the overestimation in the total area are primarily due to the trapezium (12%) and trapezoid (8%) regions. This is attributable mainly to the bone-based area including the capitate-trapezium ligament and the flexor carpi radialis tendon. Other intercarpal ligaments also contributed to the overestimation in the carpal tunnel area for the hamate (5%) and capitate (5%) regions. The four bone regions account for 30% of the total overestimation. The remaining 2% is due to the area difference of the TCL region which is attributed to the attachment sites of the TCL on the hamate and the trapezium.
Overestimation of the carpal tunnel area may explain discrepancies in literature on whether patients with carpal tunnel syndrome have a different carpal tunnel CSA compared to controls. For example, two studies reported that carpal tunnel syndrome patients have a larger CSA (14, 16). Interestingly, one of the studies used the true carpal tunnel boundary (16), and the other study used the bone boundary (14). Other studies reported that patients had a smaller CSA than controls (4, 23, 24). Several studies reported no significant difference in distal carpal tunnel CSA among controls and carpal tunnel syndrome patients (7, 11, 12, 17, 25, 26). Incorrect measurement of the carpal tunnel CSA can lead to incorrect ratios of the area occupied by the carpal tunnel contents to the carpal tunnel area. Merhar et al. used the bone-based boundary and reported no significant difference for the ratio among carpal tunnel syndrome patients and controls (12). However, the carpal tunnel could be more congested than thought if the true carpal tunnel is concerned. Cobb et al. used the true carpal tunnel boundary and found that carpal tunnel syndrome patients have a higher content-to-tunnel area ratio compared to controls (11). Using the true carpal tunnel border, investigators can more accurately estimate the area ratio of the carpal tunnel contents to the total carpal tunnel area, and more easily identify the severity of carpal tunnel stenosis. By using the true carpal tunnel area, investigators can more clearly identify if the median nerve is more compressed, and therefore more easily diagnose or evaluate median nerve compression.
There are a few restrictions in the interpretation of this study. First, identifying the carpal tunnel and the bone boundaries can vary between investigators. However, the balloon boundary was clearly defined in the MRI because of the contrast agent in the balloon. Second, the findings are limited to the distal level of the carpal tunnel. We focused on the distal level of the carpal tunnel where the median nerve tends to be more compressed (2, 3). Future studies are needed to investigate differences in the true and the bone-based CSAs at various levels along the tunnel. Third, the regional soft tissue thicknesses and the areas are dependent on the location of polar origin. The centroid of the balloon-based boundary was chosen as the polar origin because the balloon-based boundary was reliably identified and it represents the boundary of the true carpal tunnel.
Overall, this study has shown that an uneven thickness distribution of soft tissue abuts the carpal tunnel, and the soft tissue thickness influences the carpal tunnel area. It was found that the soft tissue thickness is greatest for the trapezoid and trapezium regions. Using the osseous boundary of the carpal tunnel, which includes the soft tissues extraneous to the carpal tunnel, leads to a 32% overestimation of the cross-sectional area of the true carpal tunnel area available for the carpal tunnel contents. This relationship allows for the prediction of the true carpal tunnel area with a correction factor of 0.76 for the bone-based area if the true carpal tunnel boundary cannot be obtained. More accurate estimations of the carpal tunnel area available to its contents can assist in determining potential risk factors for idiopathic cases of carpal tunnel syndrome such as carpal tunnel stenosis.
Acknowledgements
The authors acknowledge Tamara Marquardt for the collection of imaging data and Suk Yu for assistance with data analysis. The project described was supported by Grant Number 1R21AR062753 from NIAMS/NIH. Its contents are solely the responsibility of the authors and do not necessarily represent the official views of the NIAMS or NIH.
5 References
- 1.Xiu KH, Kim JH, Li ZM. Biomechanics of the transverse carpal arch under carpal bone loading. Clin Biomech (Bristol, Avon) 2010;25(8):776–80. doi: 10.1016/j.clinbiomech.2010.05.011. [DOI] [PMC free article] [PubMed] [Google Scholar]
- 2.Mesgarzadeh M, Schneck CD, Bonakdarpour A, Mitra A, Conaway D. Carpal tunnel: MR imaging. Part II. Carpal tunnel syndrome. Radiology. 1989;171(3):749–54. doi: 10.1148/radiology.171.3.2541464. [DOI] [PubMed] [Google Scholar]
- 3.Goss BC, Agee JM. Dynamics of intracarpal tunnel pressure in patients with carpal tunnel syndrome. J Hand Surg Am. 2010;35(2):197–206. doi: 10.1016/j.jhsa.2009.09.019. [DOI] [PubMed] [Google Scholar]
- 4.Dekel S, Papaioannou T, Rushworth G, Coates R. Idiopathic carpal tunnel syndrome caused by carpal stenosis. Br Med J. 1980;280(6227):1297–9. doi: 10.1136/bmj.280.6227.1297. [DOI] [PMC free article] [PubMed] [Google Scholar]
- 5.Pierre-Jerome C, Bekkelund SI, Mellgren SI, Nordstrom R. Quantitative MRI and electrophysiology of preoperative carpal tunnel syndrome in a female population. Ergonomics. 1997;40(6):642–9. doi: 10.1080/001401397187937. [DOI] [PubMed] [Google Scholar]
- 6.Robbins H. Anatomical Study of the Median Nerve in the Carpal Tunnel and Etiologies of the Carpal-Tunnel Syndrome. J Bone Joint Surg Am. 1963;45:953–66. [PubMed] [Google Scholar]
- 7.Papaioannou T, Rushworth G, Atar D, Dekel S. Carpal canal stenosis in men with idiopathic carpal tunnel syndrome. Clin Orthop. 1992;285:210–3. [PubMed] [Google Scholar]
- 8.Mogk JP, Keir PJ. Wrist and carpal tunnel size and shape measurements: effects of posture. Clin Biomech (Bristol, Avon) 2008;23(9):1112–20. doi: 10.1016/j.clinbiomech.2008.05.009. [DOI] [PubMed] [Google Scholar]
- 9.Horch RE, Allmann KH, Laubenberger J, Langer M, Stark GB. Median nerve compression can be detected by magnetic resonance imaging of the carpal tunnel. Neurosurgery. 1997;41(1):76–82. doi: 10.1097/00006123-199707000-00016. discussion 82-3. [DOI] [PubMed] [Google Scholar]
- 10.Monagle K, Dai G, Chu A, Burnham RS, Snyder RE. Quantitative MR imaging of carpal tunnel syndrome. AJR. American Journal of Roentgenology. 1999;172(6):1581–1586. doi: 10.2214/ajr.172.6.10350293. [DOI] [PubMed] [Google Scholar]
- 11.Cobb TK, Bond JR, Cooney WP, Metcalf BJ. Assessment of the ratio of carpal contents to carpal tunnel volume in patients with carpal tunnel syndrome: a preliminary report. J Hand Surg [Am] 1997;22(4):635–9. doi: 10.1016/s0363-5023(97)80120-7. [DOI] [PubMed] [Google Scholar]
- 12.Merhar GL, Clark RA, Schneider HJ, Stern PJ. High-resolution computed tomography of the wrist in patients with carpal tunnel syndrome. Skeletal Radiol. 1986;15(7):549–52. doi: 10.1007/BF00361053. [DOI] [PubMed] [Google Scholar]
- 13.Cobb TK, Dalley BK, Posteraro RH, Lewis RC. Establishment of carpal contents/canal ratio by means of magnetic resonance imaging. The Journal of hand surgery. 1992;17(5):843–9. doi: 10.1016/0363-5023(92)90454-w. [DOI] [PubMed] [Google Scholar]
- 14.Winn FJ, Jr., Habes DJ. Carpal tunnel area as a risk factor for carpal tunnel syndrome. Muscle Nerve. 1990;13(3):254–8. doi: 10.1002/mus.880130313. [DOI] [PubMed] [Google Scholar]
- 15.Morimoto KW, Budoff JE, Haddad J, Gabel GT. Cross-sectional area of the carpal canal proximal and distal to the wrist flexion crease. J Hand Surg [Am] 2005;30(3):487–92. doi: 10.1016/j.jhsa.2004.12.004. [DOI] [PubMed] [Google Scholar]
- 16.Uchiyama S, Itsubo T, Yasutomi T, Nakagawa H, Kamimura M, Kato H. Quantitative MRI of the wrist and nerve conduction studies in patients with idiopathic carpal tunnel syndrome. J Neurol Neurosurg Psychiatry. 2005;76(8):1103–8. doi: 10.1136/jnnp.2004.051060. [DOI] [PMC free article] [PubMed] [Google Scholar]
- 17.Allmann KH, Horch R, Uhl M, Gufler H, Altehoefer C, Stark GB, Langer M. MR imaging of the carpal tunnel. Eur J Radiol. 1997;25(2):141–5. doi: 10.1016/s0720-048x(96)01038-8. [DOI] [PubMed] [Google Scholar]
- 18.Bower JA, Stanisz GJ, Keir PJ. An MRI evaluation of carpal tunnel dimensions in healthy wrists: Implications for carpal tunnel syndrome. Clin Biomech (Bristol, Avon) 2006;21(8):816–25. doi: 10.1016/j.clinbiomech.2006.04.008. [DOI] [PubMed] [Google Scholar]
- 19.Skie M, Zeiss J, Ebraheim NA, Jackson WT. Carpal tunnel changes and median nerve compression during wrist flexion and extension seen by magnetic resonance imaging. J Hand Surg [Am] 1990;15(6):934–9. doi: 10.1016/0363-5023(90)90019-n. [DOI] [PubMed] [Google Scholar]
- 20.Li ZM, Masters TL, Mondello TA. Area and shape changes of the carpal tunnel in response to tunnel pressure. J Orthop Res. 2011;29(12):1951–6. doi: 10.1002/jor.21468. [DOI] [PMC free article] [PubMed] [Google Scholar]
- 21.Mesgarzadeh M, Schneck CD, Bonakdarpour A. Carpal tunnel: MR imaging. Part I. Normal anatomy. Radiology. 1989;171(3):743–8. doi: 10.1148/radiology.171.3.2717746. [DOI] [PubMed] [Google Scholar]
- 22.Richman JA, Gelberman RH, Rydevik BL, Gylys-Morin VM, Hajek PC, Sartoris DJ. Carpal tunnel volume determination by magnetic resonance imaging three-dimensional reconstruction. J Hand Surg [Am] 1987;12(5 Pt 1):712–7. doi: 10.1016/s0363-5023(87)80054-0. [DOI] [PubMed] [Google Scholar]
- 23.Gelmers HJ. Primary carpal tunnel stenosis as a cause of entrapment of the median nerve. Acta Neurochir (Wien) 1981;55(3-4):317–20. doi: 10.1007/BF01808447. [DOI] [PubMed] [Google Scholar]
- 24.Bleecker ML, Bohlman M, Moreland R, Tipton A. Carpal tunnel syndrome: role of carpal canal size. Neurology. 1985;35(11):1599–604. doi: 10.1212/wnl.35.11.1599. [DOI] [PubMed] [Google Scholar]
- 25.Jarvik JG, Yuen E, Haynor DR, Bradley CM, Fulton-Kehoe D, Smith-Weller T, Wu R, Kliot M, Kraft G, Wang L, Erlich V, Heagerty PJ, Franklin GM. MR nerve imaging in a prospective cohort of patients with suspected carpal tunnel syndrome. Neurology. 2002;58(11):1597–602. doi: 10.1212/wnl.58.11.1597. [DOI] [PubMed] [Google Scholar]
- 26.Jessurun W, Hillen B, Zonneveld F, Huffstadt AJ, Beks JW, Overbeek W. Anatomical relations in the carpal tunnel: a computed tomographic study. J Hand Surg [Br] 1987;12(1):64–7. doi: 10.1016/0266-7681_87_90061-1. [DOI] [PubMed] [Google Scholar]


