Abstract
Background
Alzheimer’s disease (AD) is the most prevalent type of dementia. Although the pathobiology of AD is still not understood, certain risk factors have been identified. The most asserted risk factors are age and genetics. Here, the age-adjusted AD mortality in Puerto Rico (PR) and United States (US) from 1999 to 2004 was analyzed, using the Tenth International Classification of Disease coding system.
Method
The numbers of deaths was obtained from the National Center for Health Statistics (NCHS) multiple cause-of-death public use data files for the United States and Territories (including Puerto Rico) for 1999 to 2004. Deaths due to Alzheimer’s disease (ICD-10 G30) as either the underlying cause-of-death, or as one of the multiple cause-of-death listings in the entity axis format, were used in these analyses. Mortality rates were calculated using data from the US Census Bureau.
Results
The results showed that while all of causes of deaths had a decreasing tendency in both PR and US, the age-adjusted AD mortality rate increased in both PR and US. However, in PR the AD mortality rate (32.4/100,000; 95% CI 30.4–34.4) was higher than that observed for all US (20.9/100,000). Interestingly, the AD mortality rate of Puerto Ricans living in PR is much higher than Puerto Ricans living in the US (12.1/100,000)(p <.0001). Additionally, females had higher AD mortality rate than males in both PR and the US.
Conclusions
The results showed an increasing trend in AD mortality rate in both the US and PR. The higher AD mortality rate in PR versus the US could not be solely explained based on genetic factors since Puerto Ricans living in the US had lower AD mortality than those living in PR. Therefore, environmental and socioeconomic differences should be considered as contributing factors.
Keywords: Alzheimer’s disease, mortality rate, Hispanic, population, epidemiology
Introduction
Alzheimer’s disease (AD) is a progressive neurological disorder characterized by loss of memory [1]. This neurological disease affects more than 18 million people worldwide today and this number is expected to double worldwide by year 2025 [2]. Due to the lack of effective treatments, the number of new AD cases could rise close to 1 million per year by 2050 [2]. In the US, there are 4.5 million people with AD and the cost associated to the treatment of these patients suffering is calculated at $100 billion annually [3]. This projected increase in AD cases and the cost associated to the treatment of these patients anticipate a public healthcare crisis.
The greatest risk factor for developing AD is age. The age of onset is 60 years or older and the prevalence doubles every five years to the point that almost half of those over 85 develop AD [2]. Due to the increase on life expectancy in developing countries, the population of people over 60 years of age should double by year 2030. Therefore, the number of people at risk of developing AD will increase as more people are expected to reach 60 years of age or older. In addition to age, genetic has been identified as contributing factor for the development of AD. Specific mutations in familial cases of early-onset AD were identified at the end of 1980’s and beginning of 1990’s [4–6]. The identified mutations are found predominantly in three genes, APP, PSEN1 and PSEN2. However, familial early-onset AD account for just a small fraction of all reported cases of AD. Other genes have been correlated to the development of AD. A variant of the gene that encodes the apolipoprotein E (ApoE) protein was identified as genetic risk factor for late-onset AD [6–7]. Recently, specific variants of other gene, named SORL1, have been associated to Alzheimer’s disease [8]. The occurrence of the variants of these two genes identified as risk factors has been study in different ethnic groups [9–10]. However, these variants have not been directly correlated to differences in the incidence of AD among ethnic groups, since other contributing factors may play an important role [9–13].
Several studies suggest that there are differences in the incidence of AD among ethnic and racial groups [13–14]. However, no significant differences in prevalence and incidence rates of AD were reported by Fillenbaum and co-workers [15]. Some incidence studies have shown a higher frequency of AD among women [16–17]. However, others have not. Overall, data are no conclusive as to whether AD incidence rate differ by on gender, race, and ethnicity In the present report we investigated mortality rates from 1999–2004 in Puerto Rico, and compared these rates to those in the US. The year 1999 was the first year that the Tenth International Classification of Disease was implemented (ICD-10), so that data from 1999–2004 are comparable, but mortality data before 1999 (ICD-9 and earlier) may not be comparable. To our knowledge there have been no data published comparing AD mortality rates in PR and the US since the advent of the ICD-10.
Methods
Numerator data for the number of deaths came from the National Center for Health Statistics (NCHS) multiple cause-of-death public-use data files. Numerator data for the United States and Territories (including Puerto Rico) were obtained for 1999 to 2004. Deaths due Alzheimer’s disease (ICD-10 G30) as either the underlying cause of death, or as one of the multiple-cause of death listings in the entity axis format, were used in this analysis [18]. Mortality rates were calculated using data from the US Census Bureau as denominators. Annual estimates of age and sex-specific populations were taken from intercensal population estimates and 2000 US Census data [18–24]. All mortality rates were standardized to the 2000 US population via direct standardization using 5 year age groups.
The distribution of AD mortality per region in PR was developed using data from the Department of Health of Puerto Rico from the years 2000 to 2004. The age-adjusted AD mortality rate was calculated and standardized to the 2000 US population for the 2000–2004 period. The map was developed using the Geographic Information System, Manifold version 8.
Results
AD mortality is higher in PR than the US
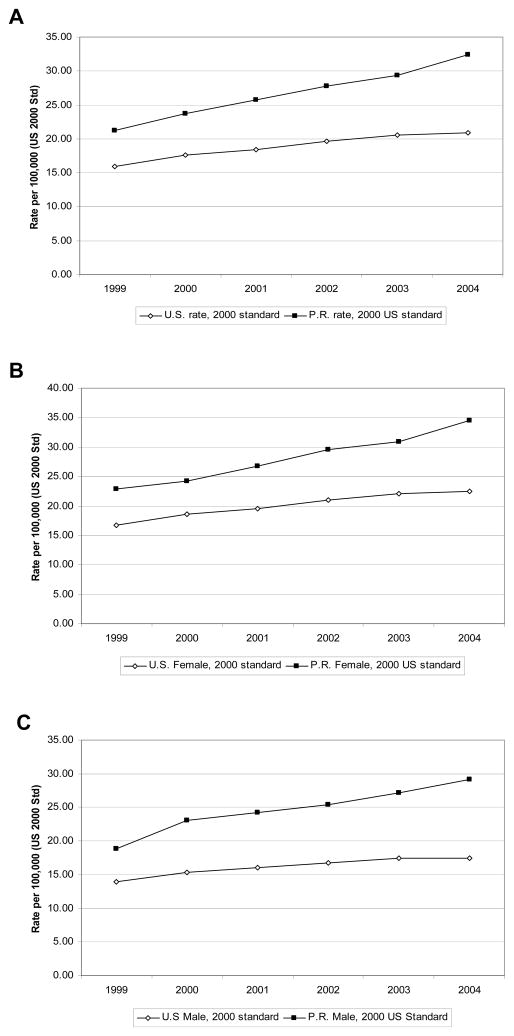
AD occupied the fourteenth position among the leading underlying causes of deaths by the year 1999. By the year 2004 AD was the fifth leading underlying cause of death in PR. In order to understand these drastic changes in deaths associated to AD in PR, the age-adjusted AD mortality rate was calculated for the period of 1999–2004 (Table 1 and Figure 1A). The age-adjusted AD mortality rate for 1999 in PR was 21.2 for every 100,000 habitants (Fig. 1A). This number increased in the subsequent years, reaching 32.4 deaths for every 100,000 habitants by year 2004 (Fig. 1A; 95% CI 30.4–34.4). This indicates a 52.8 percent increase in AD mortality rate in five years among Puerto Ricans living in PR. Conversely, in the US the age-adjusted AD mortality rate for 1999 was 15.9 per every 100,000 habitants (Fig. 1A). As observed in PR, the mortality rate associated to AD increased in the US reaching 20.9 deaths per every 100,000 habitants by year 2004. This represents a 31.4 percent increase in deaths associated to AD for the five year period in the US.
Table 1.
Age-adjusted AD mortality rate†
Age-adjusted AD mortality as underlying cause-of-death
| USA* | PR* | |||||
|---|---|---|---|---|---|---|
| Year | All | F | M | All | F | M |
| 1999 | 15.9 | 16.7 | 13.9 | 21.2 | 22.9 | 18.8 |
| 2000 | 17.6 | 18.5 | 15.3 | 23.8 | 24.2 | 23.1 |
| 2001 | 18.5 | 19.5 | 16.0 | 25.7 | 26.8 | 24.2 |
| 2002 | 19.6 | 21.0 | 16.7 | 27.8 | 29.5 | 25.4 |
| 2003 | 20.6 | 22.0 | 17.4 | 29.3 | 30.9 | 27.1 |
| 2004 | 20.9 | 22.4 | 17.5 | 32.4 | 34.5 | 29.1 |
Underlying cause of death
2000 US Standard/100,000
Fig. 1. AD as underlying cause of death in PR vs. the US.
A) The AD mortality as underlying cause-of death was calculated from 1999 to 2004. The age-adjusted AD mortality rate the US (open diamonds) and PR (closed squared) was plotted for the five year period. The difference in AD mortality based on gender was also analyzed. B) Females in the US and PR showed an increasing trend in AD mortality rate from 1999 to 2004. C) In the case of males, the same increasing trend was observed in the US and PR. In all cases, AD mortality rate is higher in PR than in the US.
The same patterns seen for the entire population are seen for men and women separately (Table 1, Figures 1B, 1C). In 1999, the AD mortality rate for women in PR was 22.9 deaths for every 100,000 habitant while for the same year in the US the mortality rate was 16.7 for every 100,000. In US and PR was registered an increased for the five years (1999–2004) studied, reaching 22.4 in the US and 34.5 in PR by the year 2004. This represented an increase in women mortality of 34.1 percent in the US and 50.6 percent in PR. The same trend was observed for men, where the AD mortality rate for men was higher in PR than in the US. The AD mortality for men in PR had a 54.8 percent increase from 1999 to 2004, while in the US the increase was 25.5 percent for the same period (Fig. 1C). In both the US and PR women are 1.2 times as likely to die of AD as men.
AD mortality increased in comparison to other causes of deaths
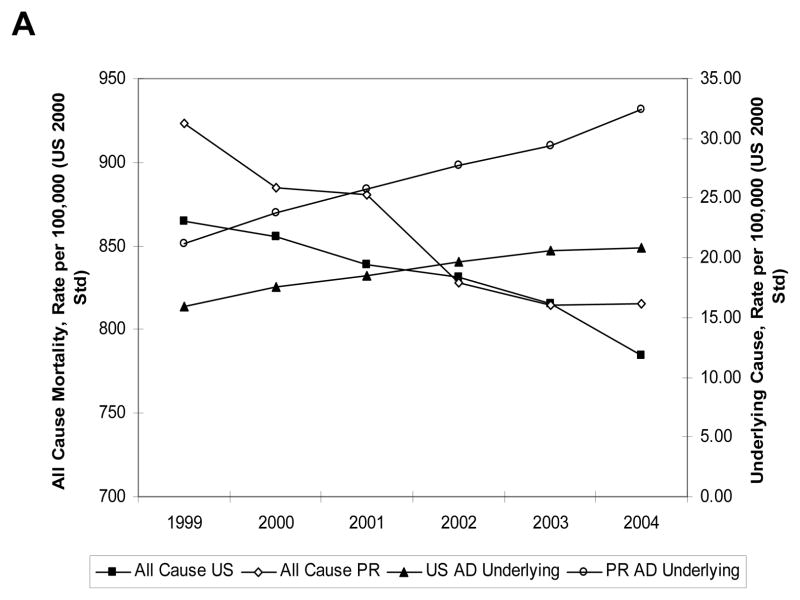
Figure 2 shows that AD mortality rates in PR and the US increased at the same time as the overall mortality rate was sharply decreasing.
Fig. 2. AD vs. other causes of death in PR and the US.
A) The mortality rate for all causes of death in the US (closed square) and PR (open diamonds) calculated for the period of 1999–2004 was plotted. The graphs showed a decreasing tendency for both the US and PR. In comparison, AD mortality rates increase for the US (closed triangle) and PR (open circle) during the same period.
AD as multiple cause-of-death in the US and PR
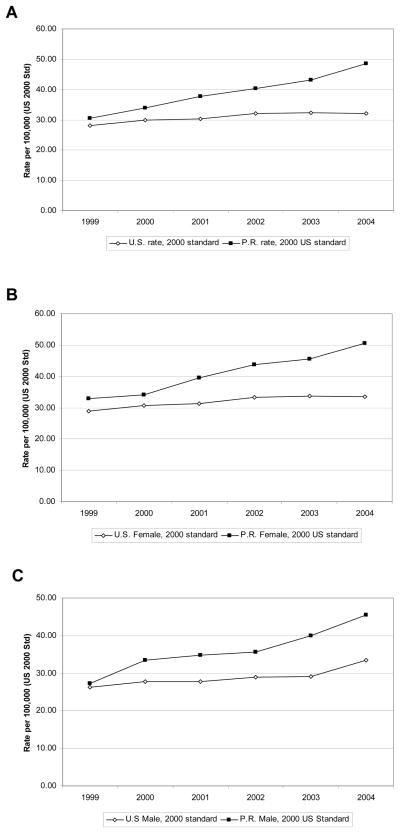
Many death certificates list AD as a secondary cause of death rather than the underlying cause. Table 2 and Figure 3 shows that in 2004 the multiple cause AD mortality rate in PR was 50 percent higher than the underlying cause rate; a similar difference (53%) was seen for the US.
Table 2.
Age-adjusted AD mortality rate†
Age-adjusted AD mortality as multiple cause-of-death
| USA* | PR* | |||||
|---|---|---|---|---|---|---|
| Year | All | F | M | All | F | M |
| 1999 | 28.2 | 28.8 | 26.2 | 30.5 | 32.9 | 27.2 |
| 2000 | 29.9 | 30.7 | 27.8 | 33.9 | 34.1 | 33.4 |
| 2001 | 30.4 | 31.4 | 27.8 | 37.6 | 39.6 | 34.8 |
| 2002 | 32.0 | 33.3 | 29.0 | 40.4 | 43.8 | 35.5 |
| 2003 | 32.3 | 33.6 | 29.0 | 43.2 | 45.4 | 39.9 |
| 2004 | 32.0 | 33.5 | 33.5 | 48.5 | 50.5 | 45.5 |
Multiple cause of death
2000 US Standard/100,000
Fig. 3. AD as multiple cause-of-death in PR vs. the US.
A) The AD mortality as multiple cause-of-death was calculated from 1999 to 2004. The age-adjusted AD mortality rate in the US (open diamonds) and PR (closed squared) was plotted for the five year period. B) Females in the US and PR showed an increasing trend in AD mortality as reported as multiple cause-of-death from 1999 to 2004. C) In the case of males, the same increasing tendency was observed in the US and PR.
The analysis of AD as a multiple cause-of-death showed the same trends as underlying cause rates, with higher rates in PR compared to the US and with a greater increase over time. In the US, AD as multiple cause-of-death showed an increase of 13.6 percent, from 28.2 per every 100,000 in 1999 to 32.0 in 2004 (Table 2 and Fig. 3A). AD as multiple cause-of-death in PR increased 59.0 percent, from 30.5 per every 100,000 in 1999 to 48.5 by 2004 (Table 2 and Fig. 3A). Similar patterns were seen for both women and men (Fig 3B and 3C).
AD mortality rate of Puerto Ricans in the US vs. PR
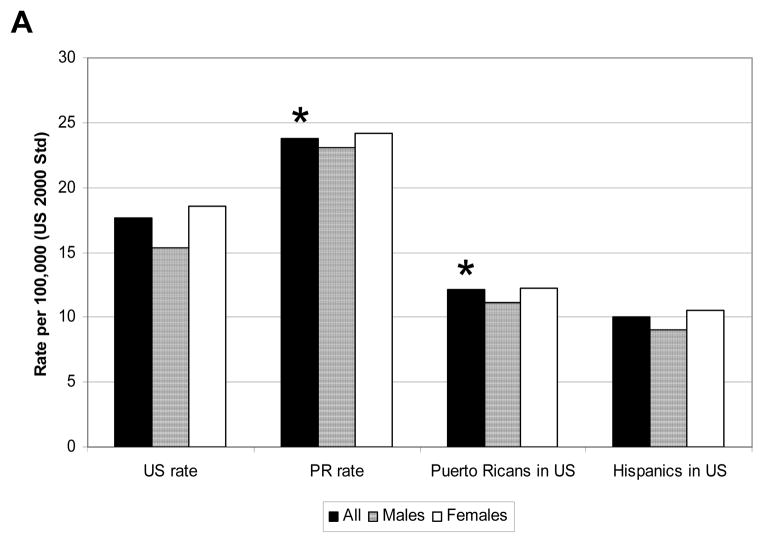
The census of 2000 reported 3.8 million Puerto Ricans living in PR and, practically, the same amount living in the US (3.4 million). The AD mortality for Puerto Ricans in Puerto Rico was of 23.7 per every 100,000 while Puerto Ricans living in the US it was 12.1 per every 100,000 for the year 2000 (Fig. 4)(p<.0001). Puerto Ricans living in the US, however, had a similar mortality rate to all Hispanics in the US.
Fig. 4. AD mortality rate of Puerto Rican in PR vs the US.
A) The age-adjusted AD mortality rate as underlying caused for Puerto Ricans living in PR vs the US was compared. The graphed showed the overall AD mortality (black bar), female mortality (lined bar) and male mortality (white bar) for the US, PR, Puerto Ricans living in the US and Hispanics living in the US. Asterisk indicates a P value of <.0001.
Regional differences in AD mortality in PR
We also calculated the AD mortality rate for the eight health regions in the island (Fig. 5). The two regions on the northwest part of the island showed the higher AD mortality rate, while the northeast showed the lowest AD mortality. Meanwhile, the southeast region VI (Caguas) also showed a high AD mortality rate. The regions with the lowest AD mortality, Metro and Mayagüez, had a rate closer to that observed in the US for the same period (Table 1, Fig. 5). Meanwhile, the southern region of Ponce showed a moderate AD mortality rate, but still higher than the one observed in the US (Fig. 5).
Fig. 5. Geographical distribution of AD mortality rate in PR.
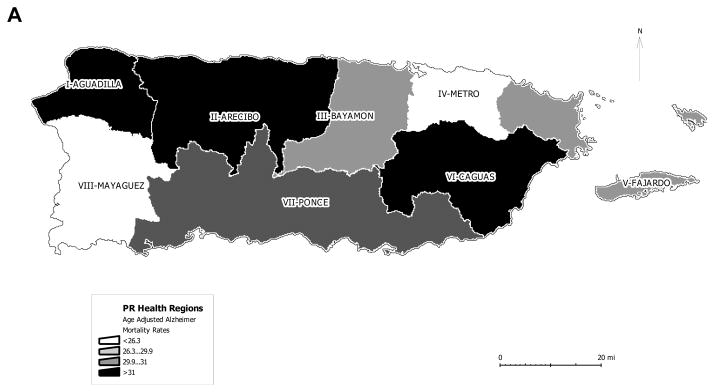
The island of PR is divided in eight regions. The regions are illustrated on the map. The legend indicates the ranges of AD mortality rate distributed on the map.
Discussion
AD cases are expected to more than double by year 2025 [2]. This projected increase is due to the lack of effective treatments that prevent or eliminate the neurodegenerative process associated to the development of AD. The pathobiology of AD has been extensively studied. At the molecular level it has been identified two neuronal lesions (senile plaques and neurofibrillary tangles) as pathological hallmarks of AD [5–6]. The molecular mechanism leading to the formation of these pathological lesions is still unclear. However, several lines of evidence suggest that genetic factors may play a crucial role in the etiology of AD [5–6]. Ethnicity has been correlated with propensity to develop AD. Some epidemiological studies indicated that African-Americans and Hispanics are more likely to develop AD than Caucasians [9–10, 13–14]. The propensity to develop AD has been attributed to the high prevalence of diseases identified as risk factors in these ethnic groups. However, the correlation between ethnicity and AD remains controversial [25].
Hispanics in the US are classified as those people that speak Spanish and/or are descendants of members of this group. The most representative members of the Hispanic population in the US are Mexicans, Puerto Ricans and Cubans. Puerto Ricans are the second largest group among Hispanics. Here we analyzed the age-adjusted AD mortality of Puerto Ricans living in the US and PR. The AD mortality in PR is higher than in the US from 1999 to 2004. For this five year period, in PR AD mortality increased 52.8% while in the US there was a 31.4% increase. Even though AD mortality was higher in PR than in the US, in both geographical areas women were 1.2 times as likely to die of AD as men. Furthermore, while all causes of deaths in the US and PR had declined from 1999 to 2004, age-adjusted AD mortality rate increased. These results indicate that the increased in AD mortality rate is not due to increments in mortality for all other underlying causes of deaths.
AD reported on the death certificate as multiple cause-of-death was also analyzed. In both the US and PR, AD mortality as multiple cause-of-death increased for the five year period. The results showed that by 2004 the multiple cause AD mortality rate in PR and was about 50 percent higher than the underlying cause rate. The increase on AD mortality rate in PR is not simply due to over-reporting of AD as underlying cause of death versus secondary cause of death on PR death certificates.
The population of Puerto Ricans in PR and the US is about the same. In PR there were approximately 3.8 million habitants for the year 2000, while in the US there were 3.4 million. In order to access AD mortality of Puerto Ricans in different geographical regions, AD mortality as underlying cause of death was analyzed in PR versus the US. We found that the AD mortality of Puerto Ricans was higher in PR than the US for year 2000. The AD mortality for Puerto Ricans in Puerto Rico was almost twice as much as that of Puerto Ricans in the US (23.7 vs. 12.1 per every 100,000 habitants; p<.0001). The significant differences in AD mortality of Puerto Ricans living in PR versus the US suggest that in addition to genetic differences there may be environmental and social contributing factors.
To further understand the observed phenomenon in PR, AD mortality was analyzed by regions. This analysis demonstrated that the northwest regions of PR had the highest AD mortality rate. Conversely, the northeast (metropolitan area) had the lowest AD mortality rate in PR. In the US there is also wide geographical variation (Hoyert et al. 1999). The geographical differences could be due to underlying cause ranging from access to preventive medicine and good medical care to different unknown risk factors Interestingly, the geographical distribution of AD mortality directly correlated with mortality rate associated to pulmonary diseases, suggesting that environmental factors may play an important role in the development of both AD and pulmonary diseases (data not shown). Differences in death certificate coding practices between the US and PR could also contribute to the difference in AD mortality among Puerto Ricans.
Our results are based on what was reported on death certificates and not incidence or prevalence data in the Puerto Rico. To our knowledge there have been no studies of the incidence or prevalence of AD among Puerto Ricans living in PR. Such studies would be very useful, although they would require careful attention to a standard method of diagnosis. Analogously, in the present study, some of our findings could be due to differences in diagnosing AD or on differences in reporting AD as cause of death by the physician that filed the death certificate. Nevertheless, our results showed an increasing trend in death rates for AD in both the US and PR. They also how that AD rates were higher among Puerto Ricans living in PR versus US rates, and much higher than rates among Puerto Ricans living in the US. These results expose the need to identify genetic, environmental and/or social factors that contribute to the high AD mortality of Puerto Ricans living in PR versus those in US.
Acknowledgments
This work was supported, in part, by NIH grant (S06GM008102-35S1) and FILIUS Institute-General Director’s Office-Funds for Pilot Investigations to I.E.V.
References
- 1.Dubois B, Feldman HH, Jacova C, DeKosky ST, Barberger-Gateau P, Cumings J, Delacourte A, Galasko D, Gauthier S, Jicha G, Meguro K, O’Brien J, Pasquier F, Robert P, Rossor M, Salloway S, Stern Y, Visser PJ, Scheltens P. Research criteria for the diagnosis of Alzheimer’s disease: revising the NINCDS-ADRDA criteria. Lancet Neurol. 2007;6:734–746. doi: 10.1016/S1474-4422(07)70178-3. [DOI] [PubMed] [Google Scholar]
- 2.Mount C, Downton C. Alzheimer disease: progress or profit? Nat Med. 2006;12:780–84. doi: 10.1038/nm0706-780. [DOI] [PubMed] [Google Scholar]
- 3.National Institute on Aging, National Institutes of Health. National Institute of Health publication number 03-5333. Jul, 2003. 2001–2002 Alzheimer’s Disease Progress Report; p. 2. [Google Scholar]
- 4.Goate A, Chartier-Harlin MC, Mullan M, Brown J, Crawford F, Fidani L, Giuffra L, Haynes A, Irving A, James L, Mant R, Newton P, Rooke K, Roques P, Talbot C, Pericak-Vance M, Roses A, Williamson R, Rossor M, Owen M, Hardy J. Segregation of a missense mutation in the amyloid precursor protein gene with familial Alzheimer’s disease. Nature. 1991;349:704–706. doi: 10.1038/349704a0. [DOI] [PubMed] [Google Scholar]
- 5.Hodges JR. Alzheimer’s centennial legacy: origins, landmarks and the current status of knowledge concerning cognitive aspects. Brain. 2006;129:2811–2822. doi: 10.1093/brain/awl275. [DOI] [PubMed] [Google Scholar]
- 6.Hardy J. A hundred years of Alzheimer’s disease research. Neuron. 2006;53:3–13. doi: 10.1016/j.neuron.2006.09.016. [DOI] [PubMed] [Google Scholar]
- 7.Corder EH, Saunders AM, Strittmatter WJ, Schmechel DE, Gaskell OC, Small GW, Roses AD, Haines JL, Pericak-Vance MA. Gene dose of apolipoprotein E type 4 allele and the risk of Alzheimer’s disease in late onset families. Science. 1993;261:921–923. doi: 10.1126/science.8346443. [DOI] [PubMed] [Google Scholar]
- 8.Rogaeva E, Meng Y, Lee JH, Gu Y, Kawarai T, et al. The neuronal sortilin-related receptor SORL1 is genetically associated with Alzheimer disease. Nat Gen. 2007;39:168–177. doi: 10.1038/ng1943. [DOI] [PMC free article] [PubMed] [Google Scholar]
- 9.Tang M-X, Stern Y, Marder K, Bell K, Gurland B, Lantigua R, Andrews H, Feng L, Tycko B, Mayex R. The APOE-e4 allele and the risk of Alzheimer disease among African Americans, Whites and Hispanics. JAMA. 1998;279:751–755. doi: 10.1001/jama.279.10.751. [DOI] [PubMed] [Google Scholar]
- 10.Gatz M, Reynlds CA, Fratiglioni L, Johansson B, Mortimer JA, Berg S, Fiske A, Pedersen NL. Role of genes and environments for explaining Alzheimer disease. Arch Gen Psychiatry. 2006;63:168–174. doi: 10.1001/archpsyc.63.2.168. [DOI] [PubMed] [Google Scholar]
- 11.Elbaz A, Dufouil C, Alpérovitch A. Interaction between genes and environment in neurodegenerative diseases. Epidemiology. 2007;330:318–328. doi: 10.1016/j.crvi.2007.02.018. [DOI] [PubMed] [Google Scholar]
- 12.Lee JH, Cheng R, Schupf N, Manly J, Lantigua R, Stern Y, Rogaeva E, Wakutani Y, Farrer L, St George-Hyslop P, Mayeux R. The Association between genetic variants in SORL1 and Alzheimer disease in an Urban, multiethnic community-based cohort. Arch Neurol. 2007;64:501–506. doi: 10.1001/archneur.64.4.501. [DOI] [PMC free article] [PubMed] [Google Scholar]
- 13.Gurland BJ, Wilder DE, Lantigua R, Stern Y, Chen J, Killeffer EH, Mayeux R. Rates of dementia in three ethnoracial groups. Int J Geriatr Psychiatry. 1999;14:481–493. [PubMed] [Google Scholar]
- 14.Tang M-X, Cross P, Andrews H, Jacobs DM, Small S, Bell K, Merchant C, Lantigua R, Costa R, Stern Y, Mayeux R. Incidence of AD in African-Americans, Caribbean Hispanics and Caucasians in northern Manhattan. Neurology. 2001;56:49–56. doi: 10.1212/wnl.56.1.49. [DOI] [PubMed] [Google Scholar]
- 15.Fillenbaum GG, Heyman A, Huber MS, Woodbury MA, Leiss J, Schmader KE, Bohannon A, Trapp-Moen B. The prevalence and 3-year incidence of dementia in older Black and White community residents. J Clin Epidemiol. 1998;51:587–595. doi: 10.1016/s0895-4356(98)00024-9. [DOI] [PubMed] [Google Scholar]
- 16.Andersen K, Launer LJ, Dewey ME, Letenneur L, Ott A, Copeland JR, Dartigues JF, Kragh-Sorensen P, Baldereschi M, Brayne C, Lobo A, Martinez-Lage JM, Stijnen T, Hofman A. Gender differences in the incidence of AD and vascular dementia: The EURODEM Studies. EURODEM Incidence research group. Neurology. 1999;53:1992–1997. doi: 10.1212/wnl.53.9.1992. [DOI] [PubMed] [Google Scholar]
- 17.Letenneur L, Gilleron V, Commenges D, Helmer C, Orgogozo JM, Dartiques JF. Are sex and educational level independent predictors of dementia and Alzheimer’s disease? Incidence data from the PAQUID project. J Neuol Neurosurg Psychiatry. 1999;66:177–183. doi: 10.1136/jnnp.66.2.177. [DOI] [PMC free article] [PubMed] [Google Scholar]
- 18.World Health Organization. International Statistical Classification of Diseases and Related Health Problems. Geneva: World Health Organization; 1992. 10th revision. [Google Scholar]
- 19.Resident Population Estimates of the United States by Age and Sex: April 1, 1990 to July 1, 1999, with Short-Term Projection to November 1, 2000. Source: Population Estimates Program, Population Division, U.S. Census Bureau. Release Date: December 20, 2000.
- 20.U.S. Census Bureau. Census of the Population of Puerto Rico, Years 1990 to 2000. Meeting of Planning, Program of Economic and Social Planning; Office of the Census. March 2002. [Google Scholar]
- 21.Table 1: Annual Estimates of the Population by Five-Year Age Groups and Sex for the United States: April 1, 2000 to July 1, 2006 (NC-EST2006-01). Source: Population Division, U.S. Census Bureau. Release Date: May 17, 2007.
- 22.Table 2. Annual Estimates of the Population by Age and Sex for Puerto Rico: April 1, 2000 to July 1, 2006 (PRC-EST2002-06). Source: Population Division, U.S. Census Bureau. Release Date: May 17, 2007.
- 23.Table 4. Annual Estimates of the Hispanic or Latino Population by Age and Sex for the United States: April 1, 2000 to July 1, 2006 (NC-EST2006-04-HISP). Release Date: May 17, 2007.
- 24.National Center for Health Statistics. Intercensal estimates of the July 1, 1991-July 1, 1999, United States resident population of the specified Hispanic origin groups, by year, age, sex, and Hispanic origin group, prepared by the National Center for Health Statistics.
- 25.Ertekin-Taner N. Genetics of Alzheimer’s disease: A centennial review. Neurol Clin. 2007;25:611–667. doi: 10.1016/j.ncl.2007.03.009. [DOI] [PMC free article] [PubMed] [Google Scholar]


