Abstract
Signals throughout the nervous system diverge into parallel excitatory and inhibitory pathways that later converge on downstream neurons to control their spike output. Converging excitatory and inhibitory synaptic inputs can exhibit a variety of temporal relationships. A common motif is feedforward inhibition, in which an increase (decrease) in excitatory input precedes a corresponding increase (decrease) in inhibitory input. The delay of inhibitory input relative to excitatory input originates from an extra synapse in the circuit shaping inhibitory input. Another common motif is push-pull or “crossover” inhibition, in which increases (decreases) in excitatory input occur together with decreases (increases) in inhibitory input. Primate On midget ganglion cells receive primarily feedforward inhibition and On parasol cells receive primarily crossover inhibition; this difference provides an opportunity to study how each motif shapes the light responses of cell types that play a key role in visual perception. For full-field stimuli, feedforward inhibition abbreviated and attenuated responses of On midget cells, while crossover inhibition, though plentiful, had surprisingly little impact on the responses of On parasol cells. Spatially structured stimuli, however, could cause excitatory and inhibitory inputs to On parasol cells to increase together, adopting a temporal relation very much like that for feedforward inhibition. In this case, inhibitory inputs substantially abbreviated a cell’s spike output. Thus inhibitory input shapes the temporal stimulus selectivity of both midget and parasol ganglion cells, but its impact on responses of parasol cells depends strongly on the spatial structure of the light inputs.
Introduction
Computation in many neural circuits depends on the integration of excitatory and inhibitory synaptic inputs. Differences in the temporal correlations between excitatory and inhibitory synaptic input, caused by differences in the circuits which provide those inputs, play a key role in determining the impact of synaptic integration on spike output. Here we study the functional importance of synaptic integration under conditions where excitatory and inhibitory inputs are either positively or negatively correlated.
Feedforward inhibition shapes signals in many neural circuits (for review, see Isaacson and Scanziani, 2011). In this motif, inhibitory synaptic input follows excitatory synaptic input with a short time delay, and hence excitatory and inhibitory inputs are positively correlated. The delay represents an extra synapse in the circuit producing inhibitory input: a common neuron provides excitatory input both to an output neuron and to an interneuron, and the interneuron then provides inhibitory input to the output neuron. This form of synaptic integration, found in many cortical circuits (Gabernet et al., 2005; Mittmann et al., 2005; Luna and Schoppa, 2008), can serve to limit neural responses to the brief time windows in which excitatory input exceeds inhibitory input (Pouille and Scanziani, 2001).
Excitatory and inhibitory inputs can also change oppositely, so that action potential production is associated with an increase in excitatory input and a commensurate decrease in inhibitory input (Zaghloul et al., 2003; Murphy and Rieke, 2006; Manookin et al., 2008). The early division of visual signals into On and Off circuits provides a natural substrate for this motif: e.g., inhibitory inputs derived from the Off circuitry can “crossover” to interact with excitatory inputs derived from the On circuitry. Crossover inhibition in visual cortex may help define the receptive field properties of simple cells (Ferster, 1988).
Primate midget and parasol ganglion cells exemplify feedforward and crossover inhibition. These cells comprise >70% of the ganglion cells in the primate retina, and the properties of their spike responses have been studied intensively (for review, see Field and Chichilnisky, 2007). Parasol cells provide input to magnocellular pathways and midget cells to parvocellular pathways, and their selective loss causes distinct visual deficits (Merigan and Maunsell, 1993). Midget and parasol cell responses differ in numerous ways, including differences in receptive field size, spatial integration, and sensitivity to subtle changes in stimulus contrast and timing (for review, see Dacey and Packer, 2003; Field and Chichilnisky, 2007). Midget ganglion cells receive primarily feed-forward synaptic inhibition while parasol cells receive mainly crossover inhibition (Manookin et al., 2010; Crook et al., 2011). It is not known how this difference in synaptic integration contributes to differences in the functional properties of the two cell types. Our goal here is to improve understanding of this issue.
Materials and Methods
Tissue preparation and cell identification
Electrical recordings from peripheral (>20 degrees eccentricity) primate retina were made as described previously (Dunn et al., 2007; Trong and Rieke, 2008). Primate (Macaca fascicularis, Macaca nemestrina, and Macaca mulatta of either sex) retinas were obtained through the Tissue Distribution Program of the Regional Primate Research Center at the University of Washington following procedures approved by the Institutional Animal Care and Use Committee. For all recordings, a piece of retina was isolated from the choroid and pigment epithelium and mounted flat with the ganglion cells facing up in a recording chamber. The retina was superfused with warmed (31 – 34°C) and oxygenated (5% CO2/95% O2) Ames solution (Sigma). On midget and On parasol ganglion cells were identified by their characteristic responses to light steps and the morphology of their somas; in initial experiments, cell type was confirmed by fluorescence imaging (Ala-Laurila et al., 2011). Before initiating recording, the overall sensitivity of the retina was determined from the spike responses of On parasol cells to 5% contrast, 4 Hz temporally modulated stimuli; data were collected only from pieces of retina in which these stimuli produced >20 spikes/s modulation of the firing rate.
Light stimulation
Light stimuli were delivered from LEDs or an OLED (organic LED) monitor (eMagin). In either case, stimuli were delivered through the microscope condenser and glass bottom of the recording chamber. Light intensities are reported as isomerizations per rod or cone per second (R*/cone/s), calculated using the calibrated LED or monitor outputs and spectra, the photoreceptor spectral sensitivity (Baylor et al., 1984, 1987), and assumed collecting areas of 0.37 μm2 (Schnapf et al., 1990) for cones and 1 μm2 for rods. Full-field stimuli covered a 560-μm-diameter spot on the retina. Spatially structured stimuli had a 560-μm-diameter mask. We chose not to separately stimulate the receptive field center and surround, as the basic properties of the excitatory and inhibitory inputs the cells receive (see Fig. 2) were not highly sensitive to the spot size. Unless specifically noted, experiments used a background that produced ~20,000 R*/s in the rods, ~8000 R*/s in the short-wavelength-sensitive cones, ~5000 R*/s in the middle-wavelength-sensitive cones, and ~2500 R*/s in the long-wavelength-sensitive cones.
Data analysis
Several metrics were used to quantify responses to sinusoidal stimuli (see Fig. 4B, top). Responses to the positive (“on”) and negative (“off”) phases of the stimulus cycle were measured by fitting the average response across one period of the stimulus with a sinusoid and computing the average response during the last 3/4 of the responsive and nonresponsive half-cycles (see Figs. 4, 5). Mean responses for both full-and split-field stimuli were computed across the entire stimulus cycle (see Figs. 4, 5, 9, 10). The ratio of inhibitory to excitatory synaptic input (inh/exc ratio; see Fig. 9D) was based on the maximal values of the inhibitory and excitatory inputs across an entire stimulus cycle. A “duty cycle” metric captured kinetics of the responses (see Figs. 4, 5, 9). The duty cycle for full-field stimuli was defined as the fraction of the positive phase of stimulus during which the firing rate was greater than half-maximal. For split-field stimuli the duty cycle was computed from half of the stimulus cycle; results were similar for the first and second half of the cycle. Transient responses had smaller duty cycles than sustained responses.
Voltage-clamp and conductance measurement
Whole-cell patch-clamp recordings were made using either Axopatch 200B or Multiclamp 700B amplifiers (Molecular Devices). Pipettes for voltage-clamp recordings were filled with a Cs-based internal solution (containing, in mm: 105 CsCH3SO3, 10 TEA-Cl, 20 HEPES, 10 EGTA, 5 Mg-ATP, 0.5 Tris-GTP, and 2 QX-314, pH ~7.3, ~280 mOsm). Voltage-clamp errors were minimized by using large pipettes (1.5–2 MΩ for parasol cells, 4–5 MΩ for midget cells) and partially compensating the access resistance (5–12 MΩ for parasol cells, 8–15 MΩ for midget cells; 50–75% compensation). Reported voltages have been corrected for a −10 mV liquid junction potential.
For measurements of synaptic conductances, cells were voltage-clamped at several holding potentials between −80 and +30 mV. Light steps were delivered while excitatory and inhibitory reversal potentials were assessed empirically by focusing on time points dominated by either excitatory or inhibitory input, and identifying holding potentials that minimized each (near −65 and +10 mV). The cell was held at the estimated excitatory reversal potential while inhibitory currents were recorded and at the estimated inhibitory reversal potential while excitatory currents were recorded. Conductances were derived by dividing the excitatory (inhibitory) current by an assumed driving force of −62 mV (+62 mV). This driving force represents the difference between the expected reversal potential for a nonselective cation conductance (0 mV) and the chloride reversal potential dictated by the pipette solution (−62 mV). The difference between these potentials and the holding potentials used to isolate excitatory and inhibitory currents likely reflects voltage errors from uncompensated series resistance and the axial resistance of the dendrites.
Dynamic clamp
Synaptic input was mimicked and manipulated during dynamic clamp experiments (Sharp et al., 1993; Murphy and Rieke, 2006). Cells were current-clamped using pipettes filled with a K-based internal solution (containing, in mm : 122 K-Aspartate, 10 KCl, 1 CaCl2, 1 MgCl, 2 EGTA, 10 HEPES, 4 Mg-ATP, and 0.5 Tris-GTP, pH 7.2 with KOH, 280 mOsm). Current injected into a cell (I) during dynamic clamp experiments was calculated as
| (1) |
where Gexc and Ginh are the conductances recorded during light stimulation, V is the membrane potential, and Eexc (Einh) is the reversal potential for excitatory (inhibitory) synaptic input. Current injected at time t was calculated from the measured voltage at time t − Δt, with Δt = 100 μs. Eexc was 0 mV and Einh was −90 mV. Upon initiating a dynamic was clamp experiment, the amplitudes of the excitatory and inhibitory conductances were scaled by a common factor, while keeping their ratio constant, to achieve spike numbers near those recorded during light stimulation. As needed, a modest constant current (<200 pA) was injected to help the cell maintain a spontaneous firing rate near 5 spikes/s (20 spikes/s for midget cells).
The hyperpolarized reversal potential for inhibitory synaptic input was supported by gramicidin perforated-patch current-clamp experiments in which light or puffs of glycine hyperpolarized On parasol cells by ~20 mV (mean hyperpolarization with light −22 ± 3 mV, mean ± SD, n = 3; see also Murphy and Rieke, 2006). Spike threshold was near −65 mV, and the resting potential was ~5 mV below threshold. Thus inhibitory input under physiological conditions should be strongly hyperpolarizing, with a reversal potential near −90 mV. To test the dependence of our results on Einh, we performed On parasol dynamic clamp experiments using values ranging from −70 to −100 mV (Fig. 1A). The general conclusion that inhibitory input affected On parasol cell responses to split-field but not full-field stimuli (see Figs. 5, 6, 10, 11) held for Einh ≤ −80 mV—i.e., as long as inhibitory synaptic input substantially hyperpolarized the cell.
Figure 1.
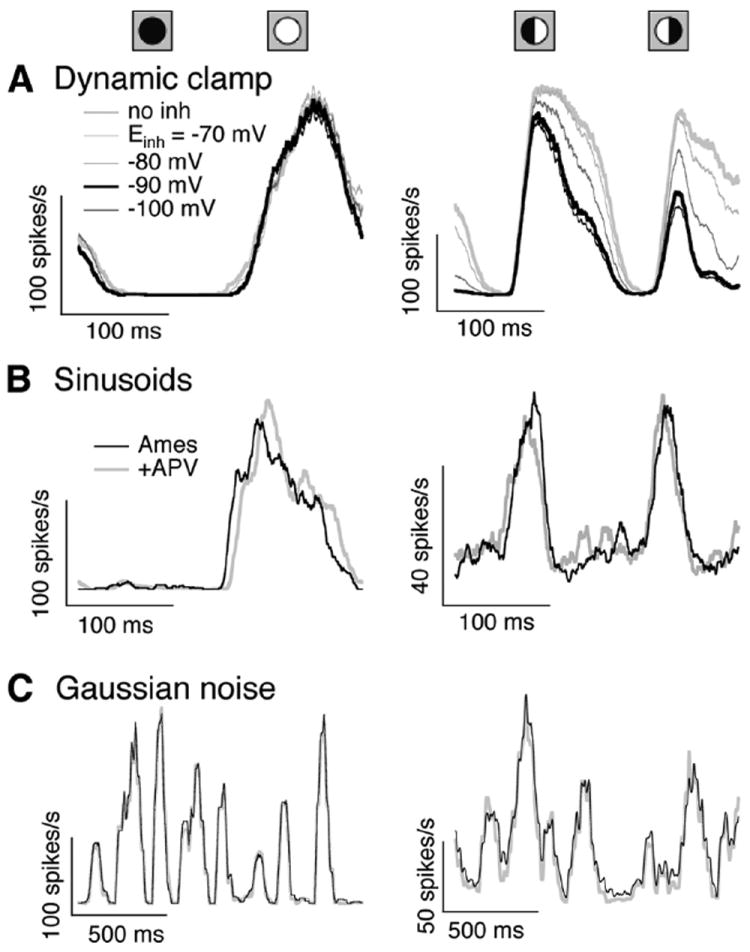
Dynamic clamp controls. A, Firing rate measured for an On parasol cell dynamic clamp experiment using full-field (left) and split-field (right) conductances while varying Einh (see Eq. 1). Thick traces show the conditions used in the remainder of the paper: without the inhibitory conductance (gray) or with Einh = −90 mV. B, Firing rate in an On parasol cell measured in response to full-field (left) and split-field (right) sinusoidal stimuli before and after suppressing NMDA conductances with APV. C, As in B but for full- and split-field Gaussian noise stimuli.
The dynamic clamp approach described in Equation 1 neglects the NMDA conductances that are present in the inputs to both On parasol and On midget cells. NMDA conductances, however, had little impact on the cells’ spike responses under the conditions of our experiments. Figure 1B compares On parasol responses to full- and split-field sinusoidal stimuli before and after suppressing NMDA conductances with APV (50 μm). Responses to sinusoidal stimuli were quantified using the duty cycle and mean firing rate during the responsive phase for full-field stimuli and the mean firing rate across the entire stimulus for split-field stimuli. Duty cycles and full-field responses changed <5% for both On parasol (n = 5) and On midget (n = 4) cells, while split-field responses changed <15% for On parasol cells. Mean firing rates were slightly lower (~10%) when NMDA conductances were suppressed. These experiments could overestimate the effect of NMDA receptors expressed by the ganglion cells themselves, since APV will suppress NMDA conductances throughout the retina.
Responses to full- and split-field noise stimuli were similarly insensitive to suppression of NMDA conductances (Fig. 1C). Spike responses were compared quantitatively using a spike-distance metric (Victor and Purpura, 1997; Murphy and Rieke, 2006); spike distances between different responses measured to the same stimulus under control conditions did not differ significantly from those between responses measured in control and APV conditions (n = 4)—i.e., the trial-to-trial variability in the spike response was larger than any systematic change in response produced by suppressing NMDA conductances. This held for On parasol responses to both full- and split-field noise (n = 3; Fig. 1C) and On midget responses to full-field noise (n = 3; data not shown).
Results
To determine how excitatory and inhibitory synaptic inputs interact to control the spike output of On midget and On parasol ganglion cells, we first characterized the inputs produced by a given stimulus and then manipulated the inhibitory input in dynamic clamp recordings. For full-field stimuli, this approach revealed a clear role of inhibitory input in shaping the spike output of On midget ganglion cells, but a surprisingly small role in shaping responses of On parasol ganglion cells. Spatially structured stimuli, however, altered the temporal relationship between the excitatory and inhibitory inputs received by an On parasol cell and revealed a clear role for inhibitory input in shaping the parasol cell responses.
Midget and parasol cells exemplify feedforward and crossover inhibition
We recorded synaptic currents from voltage-clamped On parasol and On midget ganglion cells while delivering full-field contrast steps from a mean light level near 5000 R*/cone/s (see Materials and Methods). Feedforward inhibition was prominent in the synaptic inputs to On midget ganglion cells. Figure 2B (left) shows average excitatory and inhibitory synaptic currents produced by a contrast step in a midget ganglion cell held at the reversal potential for either inhibitory or excitatory synaptic inputs (see Materials and Methods); the cell’s spike response to the same stimulus is shown below the current traces. Figure 2B (right) shows the same data converted to synaptic conductances—i.e., the excitatory (inhibitory) synaptic current divided by the driving force. The onset of the light step elicited an increase in excitatory synaptic input, and shortly thereafter an increase in inhibitory input (Fig. 2B, inset).
Figure 2.
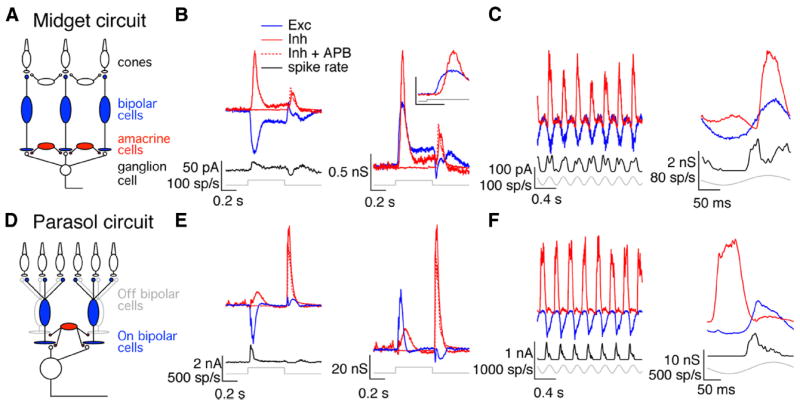
Temporal relationship between excitatory and inhibitory synaptic inputs differs for midget and parasol cells. A, Simplified circuit for excitatory and inhibitory synaptic inputs to On midget ganglion cells highlighting those cells producing excitatory (blue) and inhibitory (red) synaptic inputs. B, On midget cell responses to light steps. Left, Average synaptic currents and spike response to a 100% contrast light step. Right, Average synaptic conductances. Inset shows responses to the step onset on an expanded time scale. Calibration: 1 nS, 0.1 s. C, On midget cell responses to sinusoidal stimuli. Left, Currents and spike response to 4 Hz temporally modulated full-field stimulus. Right, Average conductances and spike responses during one cycle of the stimulus. D–F, Simplified On parasol circuit and responses as in A–C.
Delayed inhibition is often produced by a feedforward circuit in which a change in synaptic output is conveyed to a target neuron both directly, producing excitatory input, and indirectly via an inhibitory interneuron, producing delayed inhibitory input. In the case of On midget ganglion cells, glutamate release from On bipolar cells would directly provide excitatory input to the ganglion cell, and modulate inhibitory input indirectly via an amacrine cell (Fig. 2A). Consistent with this circuit, feedforward inhibition decreased substantially when light responses of On bipolar cells were suppressed with APB (2-amino-4-phosphonobutyric acid), an agonist of the mGluR6 receptors they express (Fig. 2B). Feedforward inhibition was also evident in the responses of On midget cells to sinusoidal modulation of a large spot; in this case, excitatory and inhibitory conductances, as well as firing rate, increased and decreased together (Fig. 2C). Feedforward inhibition was apparent in the responses of all recorded On midget ganglion cells (n = 48) and held across light intensities (0.01 R*/rod/s to 10,000 R*/cone/s; data not shown) and contrast levels (10–100%; data not shown).
The temporal relationship between excitatory and inhibitory synaptic inputs to On parasol ganglion cells differed from that for On midget ganglion cells. Feedforward inhibition was apparent at the onset of a light step, but a larger inhibitory input occurred at step offset (Fig. 2E). Inhibitory input to On parasol cells at step offset exceeded that at step onset over a wide range of light intensities (0.01 R*/rod/s to 10,000 R*/cone/s; data not shown) and contrast levels (10–100%; data not shown) and for responses to spots confined to the receptive field center (G. Schwartz and F. Rieke, unpublished results). The inhibitory input at step offset was insensitive to suppression of On bipolar cell light responses with APB (Fig. 2E), indicating that it was derived from activity of Off bipolar cells (Fig. 2D). We will refer to this component of inhibitory input as crossover inhibition. APB, as described previously (Ala-Laurila et al., 2011), revealed an excitatory synaptic input to On parasol cells at step offset (data not shown). Crossover inhibition was also apparent in the responses to sinusoidal stimuli; such stimuli modulated excitatory and inhibitory conductances with opposite polarity (Fig. 2F). The opposite polarity of responses to sinusoidal stimuli held across all temporal frequencies tested (1–15 Hz; data not shown). Crossover inhibition was apparent in all recorded On parasol ganglion cells (n = 38).
Relative timing of excitatory and inhibitory synaptic inputs elicited by full-field stimuli
We turned to Gaussian noise stimuli to more thoroughly characterize the temporal relation between excitatory and inhibitory synaptic inputs. We repeat this sequence of first sinusoidal and then noise stimuli throughout the paper. For noise stimuli, we repeated the same stimulus waveform while using cell-attached recordings to measure spike responses and voltage-clamp recordings to measure excitatory and inhibitory synaptic inputs (Fig.3A,D).
Figure 3.
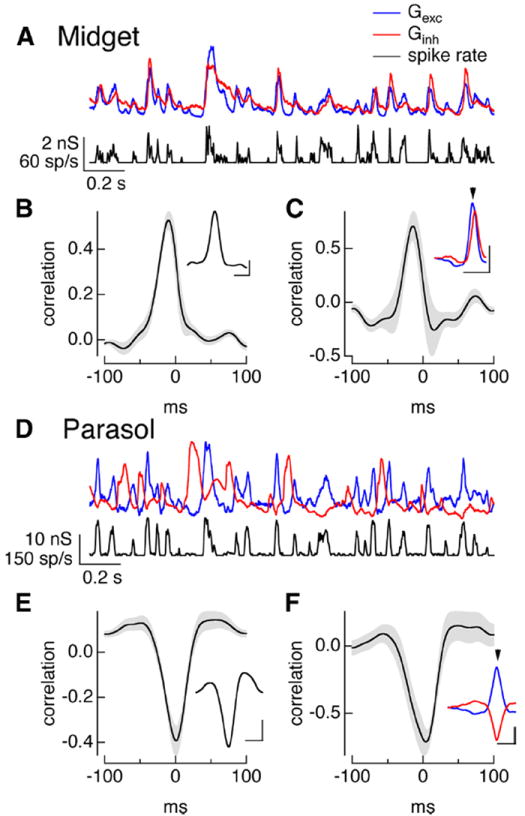
Temporal correlations during full-field noise stimuli. A, On midget conductances and spike response to Gaussian noise stimulus. B, Cross-correlation of average excitatory and inhibitory conductances (mean ± SEM, n = 9). Inset plots example cell from A. Calibration: 100 ms, correlation 0.2. C, Cross-correlation function for pre-spike conductances (mean ± SEM, n = 9). Inset shows the average trajectories of the excitatory (blue) and inhibitory (red) conductances before a spike from the example cell from A. Calibration: 0.2 nS, 100 ms. Arrowhead shows spike time. D–F, On parasol responses as in A–C. Calibration: E, 50 ms, correlation 0.2; F, 0.1 nS, 50 ms.
Feedforward inhibition should produce positively correlated excitatory and inhibitory conductances, while crossover inhibition should produce negatively correlated conductances. We tested these predictions using cross-correlation functions, which measure the correlation coefficient as one conductance is shifted in time relative to the other. Synaptic inputs to On midget ganglion cells were indeed positively correlated (Fig. 3A,B), while those to On parasol ganglion cells were negatively correlated (Fig.3D,E).
Feedforward inhibition also predicts that inhibitory input will be delayed relative to excitatory input. The peak of the cross-correlation function characterizes the relative timing of changes in excitatory and inhibitory synaptic input. For inputs to midget ganglion cells, the cross-correlation function peaked at −8 ± 3 ms (mean ± SEM, n = 9), indicating that excitatory inputs led inhibitory inputs. Crossover inhibition, however, does not make a clear prediction about the relative timing of excitatory and inhibitory inputs because the circuits controlling the inputs are so distinct. For inputs to On parasol ganglion cells, the cross-correlation function reached its maximal negative value at −0.1 ± 0.1 ms (mean ± SEM, n = 12), indicating that changes in excitatory and inhibitory input occurred near-simultaneously but with opposite polarity. This near simultaneity of changes in excitatory and inhibitory input suggests a balance of two factors: The additional amacrine cell participating in the circuit producing inhibitory synaptic input should produce a delay, but this delay is apparently matched by the increased speed of signaling via the Off bipolar cells in the circuit mediating inhibitory input compared with the On bipolar cells mediating excitatory input (Fig. 2D).
Do the differences in On midget and On parasol synaptic conductances described above hold immediately before an action potential? To answer this question, we measured the average trajectories of the excitatory and inhibitory conductances before a spike. In each cell, spike times determined from cell-attached recordings were used to identify time windows for computing the average excitatory and inhibitory conductances measured from voltage-clamp recordings. For midget ganglion cells, excitatory inputs first decreased and then began to increase 20–30 ms before a spike, and inhibitory inputs began to increase shortly thereafter (Fig. 3C, inset). The cross-correlation function for the excitatory and inhibitory synaptic inputs preceding an action potential (Fig. 3C) resembled that computed using the entire conductances; in particular, the cross-correlation peaked at negative times (−7 ± 4 ms, mean ± SEM, n = 9), indicating that the pre-spike changes in excitatory input led changes in inhibitory input.
For On parasol ganglion cells, inhibitory inputs began to decrease and excitatory inputs began to increase 20–30 ms before a spike and followed similar temporal trajectories (Fig. 3F, inset). The cross-correlation function for the pre-spike conductances resembled that for the full conductances (Fig. 3F); in particular, the cross-correlation reached a maximum negative value at a time not significantly different from 0 ms (0.5 ± 1 ms, mean ± SEM, n = 9), indicating that excitatory and inhibitory inputs changed at near-identical times. Thus the pre-spike conductances for both midget and parasol ganglion cells reflect the overall differences in excitatory and inhibitory synaptic inputs to the two cell types.
Prominent role of feedforward but not crossover inhibition in responses to full-field stimuli
The experiments summarized in Figures 2 and 3 illustrate substantial differences in the temporal relationship between the excitatory and inhibitory synaptic inputs On midget and On parasol ganglion cells receive during full-field, temporally modulated light inputs. What do these differences mean for how inhibitory input shapes spike responses to such stimuli? Blocking the receptors that mediate inhibitory synaptic inputs does not provide a clear answer because such receptors are located on cells throughout the retina, and their activity influences both excitatory and inhibitory synaptic inputs to a ganglion cell. Instead we compared responses with and without inhibitory input using the dynamic clamp approach (see Materials and Methods), which mimics light-evoked changes in voltage by injecting currents corresponding to the light-evoked synaptic conductances. Dynamic clamp experiments replicated several key properties of a cell’s light responses (Murphy and Rieke, 2006; Cafaro and Rieke, 2010) and allowed manipulation of the input conductances. As described below, these experiments indicate that feedforward inhibition regulates the kinetics and amplitude of On midget ganglion cell responses to full-field stimuli, while crossover inhibition plays a surprisingly modest role in shaping responses of On parasol cells to the same stimuli.
We started with dynamic clamp experiments using conductances elicited by sinusoidally modulated full-field stimuli as in Figure 2, C and F. We compared the spike responses produced by the measured excitatory conductance in the presence or absence of the measured inhibitory conductance. For midget ganglion cells, responses in the absence of inhibitory input were considerably stronger than those when inhibitory input was present (Fig. 4A,B). Across cells, inhibitory input suppressed firing during the positive phase of the stimulus (Fig. 4B,C; see Materials and Methods for identification of positive phase), while modulation of excitatory input alone was sufficient to completely suppress firing during the opposite phase of the stimulus (Fig. 4B,D). The mean firing rate measured across the entire stimulus period was suppressed strongly by inhibitory input (Fig. 4E), as expected given the strong suppression of firing during the positive phase of the stimulus. We quantified the effect of inhibitory input on the response kinetics using the duty cycle—i.e., the fraction of the time during the positive phase of the stimulus that the firing rate was greater than half-maximal (see Materials and Methods; Fig. 4B, top). Inhibitory input substantially decreased the duty cycle (Fig. 4F), consistent with a role for feedforward inhibition in truncating spike responses.
Figure 4.
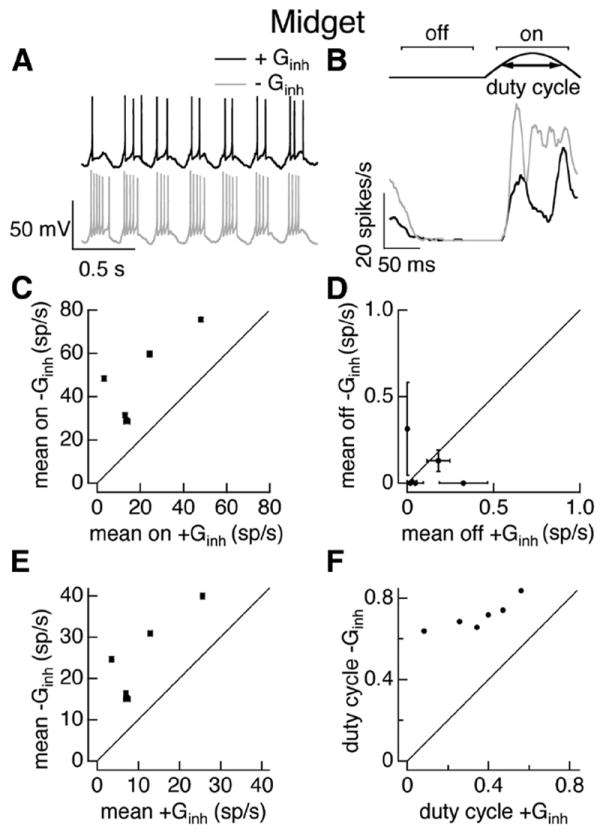
Inhibitory input strongly regulates midget cell responses to full-field sinusoidal stimuli. A, Example voltage responses of an On midget cell during a dynamic clamp experiment. Top, Response to injection of currents corresponding to excitatory and inhibitory conductances elicited in a different cell by 100% contrast full-field sinusoidal stimuli. Bottom, Response to excitatory conductance alone. B, Average firing rate for one cycle of the conductances corresponding to the sinusoidal stimulus. Top shows schematic of firing rate and measures used to quantify impact of inhibition. C, Mean firing rate during the responsive phase of the stimulus in the presence and absence of the inhibitory conductance.D, Mean firing rate during the nonresponsive phase of the stimulus in the presence and absence of the inhibitory conductance. E, Mean firing rate in the presence and absence of the inhibitory conductance. F, Duty cycle (see Materials and Methods) in the presence and absence of the inhibitory conductance. Error bars in C–E are SEM computed across 10–25 dynamic clamp trials.
On parasol ganglion cells exhibited quite different behavior (Fig. 5). The hyperpolarization between periods of spiking was more pronounced when the inhibitory conductance was present (Fig. 5A), but the spike responses with and without inhibition were quite similar (Fig. 5B). Inhibitory input had little effect on firing during the positive phase of the stimulus (Fig. 5B,C), but provided some additional suppression of firing during the negative phase (Fig. 5B,D). Inhibition had little effect on the mean firing rate (Fig. 5E), as the changes in firing rate during the negative phase (Fig. 5D) were small compared with the cells’ overall firing rate; inhibition similarly had little effect on the duty cycle (Fig. 5F).
Figure 5.
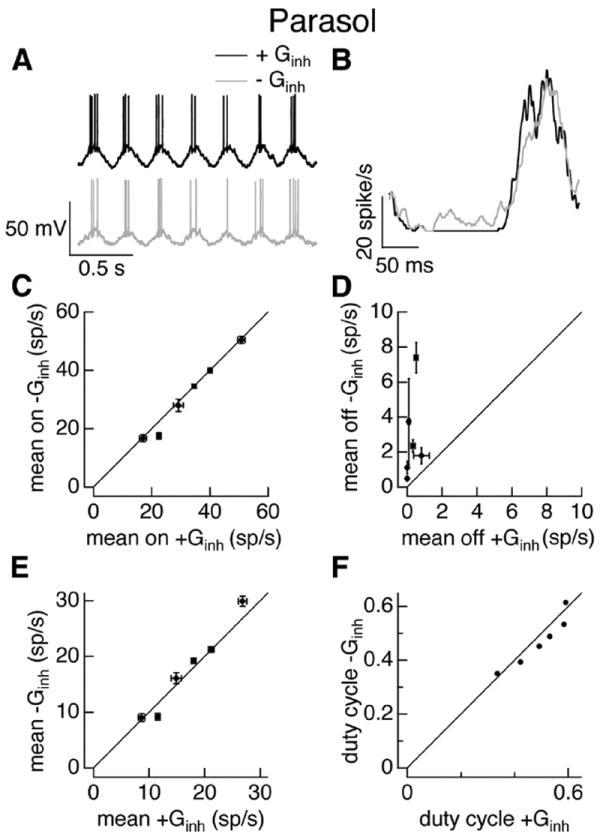
Inhibitory input weakly regulates parasol cell responses to full-field sinusoidal stimuli. A–F as in Figure 4 but for On parasol cell dynamic clamp experiments. Excitatory and inhibitory conductances were in response to a 25% contrast full-field sinusoidal stimulus.
Dynamic clamp experiments using conductances measured from full-field Gaussian noise stimuli further reinforced the different roles of inhibitory input in regulating midget and parasol spike responses (Fig. 6A,D). For midget ganglion cells, the inhibitory conductance suppressed the mean firing rate (ratio without and with inhibition was 0.81 ± 0.05, mean ± SEM, n = 7) and abbreviated the firing events. The latter effect can be seen from the smaller width of the autocorrelation of the average spike response to repetitions of the excitatory and inhibitory conductance compared with the excitatory conductance alone (Fig.6B,C; ratio of width at half-maximum of 0.7 ± 0.1).
Figure 6.
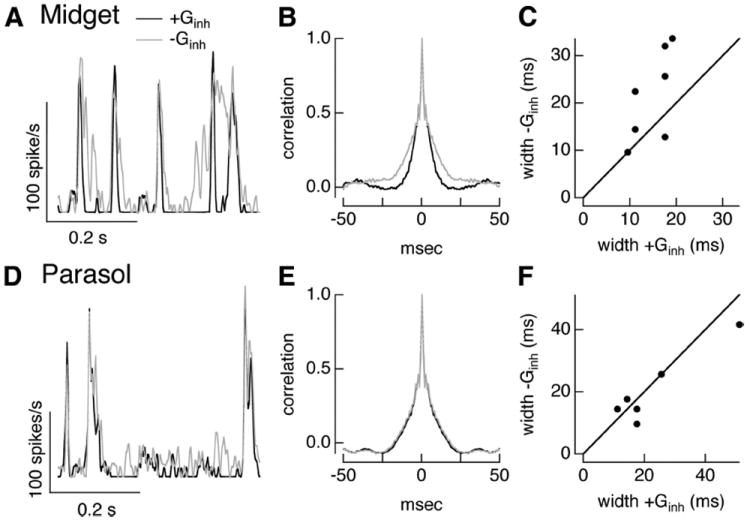
Inhibitory input shapes timing of responses to full-field noise stimuli in midget but not parasol cells. A, Spike rate of example On midget cell during dynamic clamp experiments using conductances elicited by full-field Gaussian noise stimuli. Firing rate for repeated trials injecting currents corresponding to both excitatory and inhibitory conductances (black) or excitatory conductance alone (gray). B, Autocorrelation function of firing rates for dynamic clamp experiments with and without inhibitory conductance for same cell as in A. C, Autocorrelation width with and without inhibitory conductance for population of cells. D–F, As in A–C but for On parasol cell dynamic clamp experiments.
Similar experiments using full-field noise conductances for On parasol ganglion cells indicated that inhibitory synaptic input suppressed overall excitability but played a minor role in regulating the timing of spike generation. Inhibitory input slightly reduced the mean spike rate (ratio 0.92 ± 0.03, mean ± SEM, n = 11) but had little effect on the width of the autocorrelation function (Fig. 6E,F; ratio 1.06 ± 0.11).
The above results indicate that feedforward inhibition plays an expected role in regulating the strength and duration of the responses of midget ganglion cells to full-field light stimuli. However, although On parasol cells receive abundant inhibitory input, it appears largely dispensable for explaining their responses to full-field stimuli.
Spatially structured stimuli can cause crossover inhibitory input to overlap in time with excitatory input
The insensitivity of On parasol responses to removal of inhibitory input suggests that the increase in excitatory input produced by full-field stimuli is sufficient by itself to control action potential generation for these stimuli, and that during time periods where inhibitory input is large, the excitatory input is already sufficiently small that the cell is unlikely to be spiking. Hence we sought other stimuli that might reveal a role for inhibitory input in shaping On parasol responses.
Thus far we have ignored the nonlinearities that shape the excitatory and inhibitory inputs that a ganglion cell receives. Such nonlinearities—i.e., for an On cell the larger absolute amplitude of responses to light increments than decrements—strongly influence ganglion cell responses. Such nonlinearities cause, for example, the non-sinusoidal responses to sinusoidally modulated stimuli in Figure 2, B and D. Overall, inputs to On parasol cells exhibited greater rectification than those to On midget cells, and inhibitory inputs exhibited greater rectification than excitatory inputs. Because nonlinearities in the inputs individual bipolar cells provide to ganglion cells have long been known to alter spatial selectivity (Hochstein and Shapley, 1976; Demb et al., 2001a), including in On parasol cells (Chichilnisky and Kalmar, 2002; Petrusca et al., 2007; Crook et al., 2008), we considered whether spatially structured stimuli could alter the interactions between excitatory and inhibitory inputs.
Rectification suggests that different regions of space could near-independently control excitatory and inhibitory inputs, as illustrated in Figure 7A. Specifically, regions of the receptive field in which the light input increases could cause large increases in excitatory input with at most modest decreases in inhibitory input, while regions in which the light input decreases would do the opposite (Fig. 7A, left). Thus, stimuli in which some regions of the receptive field experience decreases in light input and other regions experience increases should cause changes in excitatory and inhibitory inputs of the same polarity, promoting interactions between them. The simplest example is a split-field stimulus (Fig. 7A, right).
Figure 7.
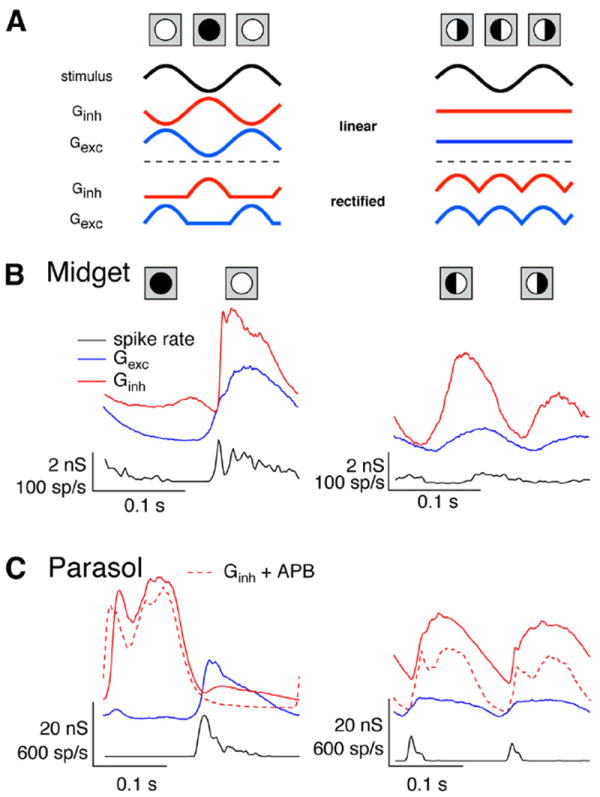
Responses to full- and split-field stimuli. A, Illustration of effect of rectification on excitatory and inhibitory conductances elicited by full-field (left) and split-field (right) field stimuli. B, Average conductances and firing rate elicited by 100% contrast full- and split-field sinusoidal stimuli for an On midget cell. C, Average conductances and firing rate elicited by full- and split-field stimuli for an On parasol cell.
We centered split-field stimuli over a cell’s receptive field by minimizing the response at the temporal frequency with which the stimulus intensity was modulated. Thus, if the modulation frequency was 4 Hz, we chose a spatial position that minimized the 4 Hz response modulations. Responses at the modulation frequency are produced by the linear receptive field and, thus, indicate an imbalance in the responses produced by the two halves of the stimulus—i.e., the increase in response from one half of the stimulus is not fully cancelled by the decrease in response from the other half. Minimizing the linear response revealed responses at twice the modulation frequency (frequency-doubled responses; Hochstein and Shapley, 1976), which are produced by the nonlinear component of the cell’s receptive field, as in Figure 7A (right).
Figure 7, B and C, shows spike responses and synaptic inputs recorded from On midget and On parasol ganglion cells elicited by sinusoidally modulated full- and split-field stimuli. On midget ganglion cells responded robustly to full-field stimuli, but had relatively weak spike responses to centered split-field stimuli (Fig. 7B; ratio of split-field to full-field response 0.20 ± 0.04, mean ± SEM, n = 6). Excitatory and inhibitory synaptic inputs to On midget cells were positively correlated for both full- and split-field stimuli (n = 7). Two factors appeared to work together to cause weak modulation of a midget cell’s spike output for split-field stimuli. First, excitatory inputs elicited by split-field stimuli were considerably weaker than those elicited by full-field stimuli (ratio of peak excitatory conductances 0.29 ± 0.07), consistent with modest rectification. Second, the ratio of the maximal inhibitory input to the maximal excitatory input was larger for split-field than full-field stimuli, likely due to greater rectification of the inhibitory inputs (inh/exc ratio 2.5 ± 0.4 for split field vs 1.6 ± 0.2 for full field).
On parasol ganglion cells responded robustly to both full- and split-field stimuli (Fig. 7C). However, the temporal relationship between excitatory and inhibitory inputs was very different for the two stimuli: excitatory and inhibitory inputs were negatively correlated for full-field stimuli, but positively correlated for split-field stimuli (n = 7). The polarity of the correlations between excitatory and inhibitory input was unchanged by APB (dashed lines in Fig. 7C), indicating that crossover inhibition dominated for both full- and split-field sinusoidal stimuli.
The dependence of the temporal relationship between excitatory and inhibitory inputs to On parasol cells on spatial structure also held for noise stimuli. Thus, random modulation of the light intensity, with equal and opposite modulations on the two halves of the split field, also elicited positively correlated changes in excitatory and inhibitory conductances (Fig. 8A,B). Such positive correlations differ from the negatively correlated conductances elicited by full-field noise stimuli as described above (Fig. 3D,E). Changes in excitatory input in response to split-field noise led changes in inhibitory input (Fig. 8B; time to peak of cross-correlation −9 ± 4 ms, mean ± SEM, n = 5); a similar delay between excitatory and inhibitory input characterizes the more classic feedforward inhibition exhibited by On midget ganglion cells (Fig. 3B). The pre-spike conductances for On parasol cell responses to split-field noise revealed a similar picture: excitatory and inhibitory conductances both increased before a spike (Fig. 8C, inset), with changes in excitatory input leading changes in inhibitory input (Fig. 8C, cross-correlation peak −5 ± 3 ms, mean ± SEM, n = 4).
Figure 8.
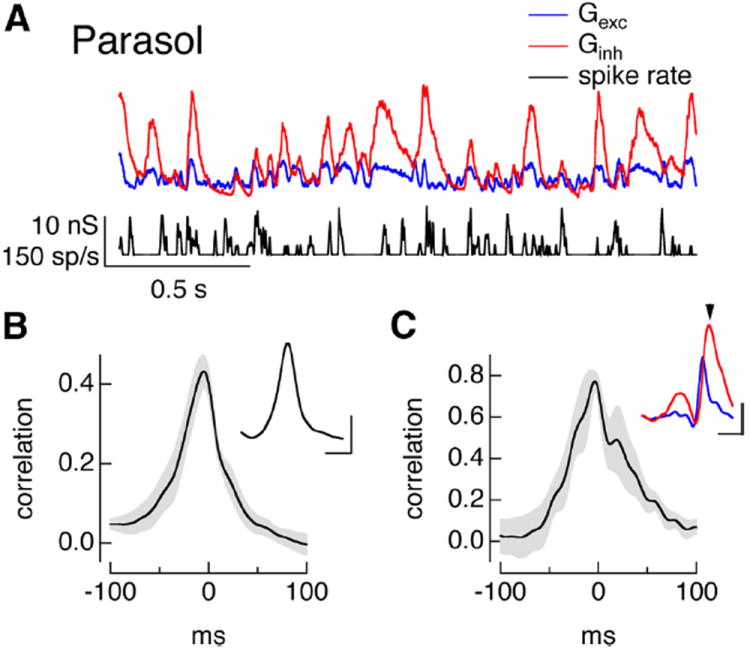
Split-field noise stimuli cause positive correlations between excitatory and inhibitory inputs to parasol cells. A, Conductances and firing rate in response to a random split-field stimulus. Changes in light intensity on one half of the split field were matched by equal and opposite changes on the other half. B, Cross-correlation function for mean excitatory and inhibitory conductances as in A. The main panel shows mean ± SEM for 5 cells, and the inset shows the cell from A. Calibration: Inset, 50 ms, correlation 0.2. C, Cross-correlation of pre-spike conductances, mean ± SEM for 4 cells. Inset shows trajectories of excitatory (blue) and inhibitory (red) conductances before a spike. Calibration: 1 nS, 50 ms.
The difference in the temporal relationship between excitatory and inhibitory input elicited by full- and split-field stimuli is consistent with the situation illustrated in Figure 7A, and suggested that inhibitory input might play a stronger role in regulating On parasol cell responses to split-field stimuli than full-field stimuli. The remainder of the paper tests this hypothesis.
Crossover inhibition regulates spike responses to spatially structured stimuli
The experiments illustrated in Figures 7 and 8 show that spatially structured stimuli can cause positively correlated changes in excitatory and inhibitory synaptic inputs to On parasol cells. The temporal relationship between excitatory and inhibitory inputs for these stimuli resembles that for feedforward inhibition—e.g., the inputs to On midget cells elicited by full-field stimuli (Figs. 2, 3). This suggests that crossover inhibition might shape the kinetics and amplitude of responses to spatially structured stimuli, much as feedforward inhibition to On midget cells does for full-field stimuli.
We first characterized the excitatory and inhibitory inputs to On parasol cells for both full- and split-field sinusoidal stimuli across a range of contrasts (Fig. 9A,B). For all contrasts tested (12.5–100%), excitatory and inhibitory inputs were negatively correlated for full-field stimuli and positively correlated for split-field stimuli. Both excitatory and inhibitory inputs elicited by split-field stimuli were smaller than those elicited by full-field stimuli. However, the ratio of the maximal inhibitory input to the maximal excitatory input was larger for split-field than full-field stimuli (Fig. 9D), particularly at low contrast. This likely reflects greater cancellation of excitatory inputs generated from the two halves of the stimulus and corresponding weaker rectification of excitatory inputs compared with inhibitory inputs.
Figure 9.
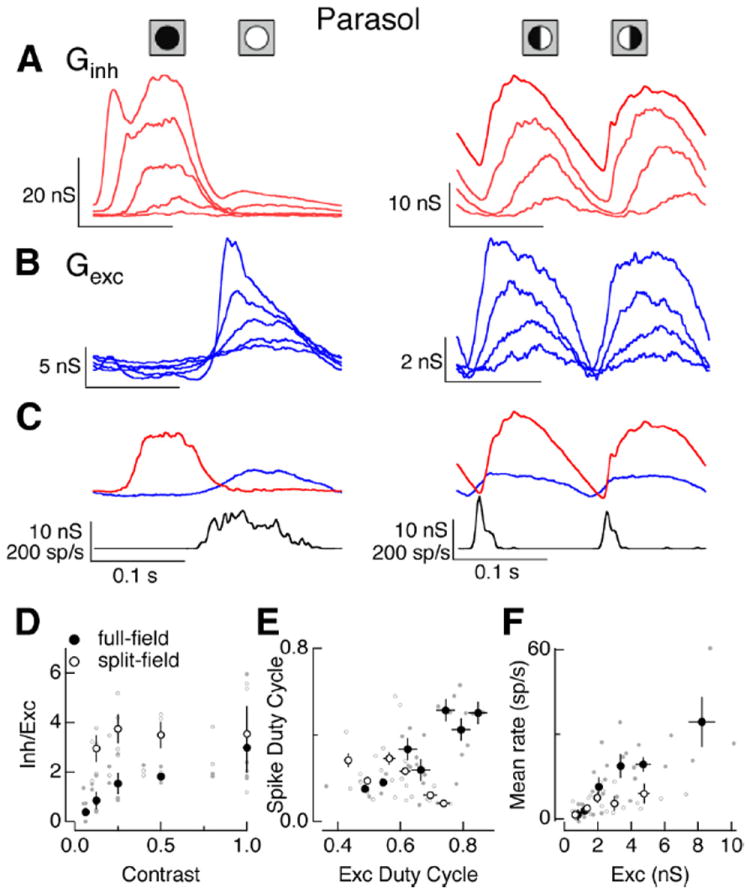
Contrast dependence of On parasol responses to full- and split-field stimuli. A, Average inhibitory conductances elicited by full (left, 6.25, 12.5, 25, 50 and 100% contrast) and split (right, 12.5, 25, 50, 100% contrast) field sinusoidal stimuli. B, Average excitatory conductances to the same stimuli as in A. C, Average excitatory conductances and firing rate for 25% contrast full field (left) and 100% contrast split field (right) stimuli. These contrasts elicited similar amplitude excitatory inputs. D, Ratio of peak amplitude of inhibitory input to excitatory input for full- and split-field stimuli. Small dots represent data from individual cells. E, Spike rate duty cycle (see Materials and Methods) plotted against duty cycle for excitatory synaptic inputs. F, Mean firing rate as a function of mean excitatory conductance for full- and split-field stimuli. Error bars in D–F are SEM computed across cells.
To test for a role of inhibitory input in regulating a cell’s spike output, we compared spike responses generated by full- and split-field stimuli that elicited similar amplitude excitatory inputs. Figure 9C shows one such comparison. The selected full-field (25% contrast) and split-field (100% contrast) stimuli produced near-identical amplitude modulation of excitatory input, but the full-field stimulus produced a considerably longer lasting spike response. The increased transience of the spike response to the split-field stimulus was not due to an increased transience of the excitatory synaptic input; instead it is likely due to the larger amplitude of the inhibitory input elicited by the split-field stimulus and its increased temporal overlap with excitatory input.
We used the duty cycle to quantify the difference in the kinetics of the spike response relative to that of excitatory input. Figure 9E plots the duty cycle of the spike response against that of the excitatory inputs for full- and split-field stimuli. Excitatory inputs elicited by split- and full-field stimuli had comparable duty cycles. However, the duty cycle for full-field spike responses increased steadily as the duty cycle for the excitatory input increased, while the duty cycle for split-field spike responses remained constant or decreased as the duty cycle for excitatory input increased. Similarly, for all but the weakest contrast stimuli, equal amplitude excitatory inputs produced approximately twice the modulation of mean firing rate for full-field stimuli compared with split-field stimuli (Fig. 9F). These differences indicate a prominent role of inhibitory input in regulating responses to spatially structured stimuli.
Dynamic clamp experiments using conductances from the sinusoidal split-field stimuli provided another means of delineating a role for inhibitory input (Fig. 10A,B). We used full- and split-field conductances measured for contrasts that produced similar amplitude excitatory synaptic inputs, as in Figure 9C. We then compared spike responses with and without the inhibitory conductance, as in Figures 4 and 5. Both the mean and duty cycle of the spike responses of On parasol cells were substantially attenuated by the inhibitory conductance, unlike the case for full-field stimuli (compare open and closed symbols in Fig. 10C,D).
Figure 10.
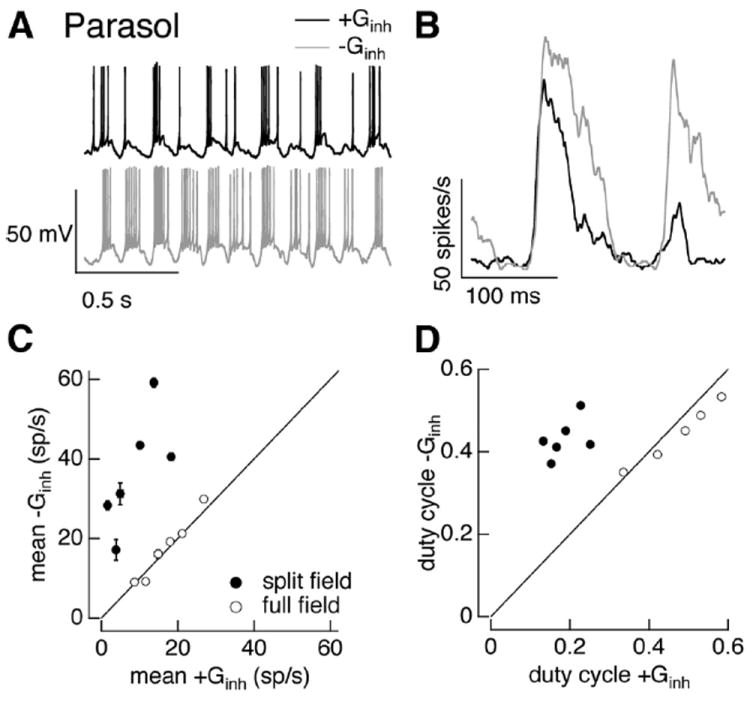
Inhibitory input regulates On parasol cell responses to split-field sinusoidal stimuli. A, Example voltage responses to dynamic clamp injection of conductances elicited by a 100% contrast split-field sinusoidal stimulus. Top, Response with both excitatory and inhibitory conductances. Bottom, Response with excitatory conductance alone. B, Average firing rate for conductances corresponding to one cycle of stimulus from the same cell as in A. C, Mean firing rate with and without inhibitory conductance. Data from the same experiment using full-field conductances from Figure 5 is replotted for comparison. Error bars are SEM across 10–25 dynamic clamp trials. D, Duty cycle (see Materials and Methods) with and without inhibitory conductance.
Dynamic clamp experiments using conductances elicited by noise stimuli similarly showed a more pronounced interaction between excitatory and inhibitory inputs for split-field compared with full-field stimuli (Fig. 11A). Specifically, inhibitory input abbreviated and decreased the amplitude of firing events (Fig. 11B,C; ratio of autocorrelation width 0.7 ± 0.1, and ratio of mean firing rates 0.77 ± 0.03, mean ± SEM, n = 6). When full-field conductances were used in the same cells (open circles in Fig. 11C, data from Fig. 6F), inhibitory input had little or no effect on the width of the autocorrelation function.
Figure 11.

Inhibitory input shapes timing of parasol responses to split-field noise stimuli. A, Firing rate for dynamic clamp experiment using conductances elicited by split-field noise measured as in Figure 8. Black line shows firing rate with both excitatory and inhibitory conductances and gray line shows firing rate without inhibitory conductance. B, Autocorrelation of firing rate from the same cell as A. C, Autocorrelation width with and without inhibitory conductance. Data from the full-field noise dynamic clamp experiments in Figure 6 is replotted for comparison.
Discussion
Inhibitory synaptic inputs to On midget and On parasol ganglion cells differ considerably. On midget cells receive mostly feedforward inhibition originating via On bipolar cells, while On parasol cells receive mostly crossover inhibition originating via Off bipolar cells. Our primary aim here was to determine how the resulting difference in the temporal relation between excitatory and inhibitory input shapes the cells’ encoding of light inputs. Below we relate our results to other work on similar forms of synaptic integration in retina and in other neural circuits.
On midget cells and feedforward inhibition
Increases in excitatory input to On midget ganglion cells were followed, with a short delay, by increases in inhibitory input. This type of relationship has been described in primary auditory cortex (Wehr and Zador, 2003), and in pyramidal cells in hippocampus (Pouille and Scanziani, 2001), piriform cortex (Luna and Schoppa, 2008), and barrel cortex (Gabernet et al., 2005; Wilent and Contreras, 2005; Okun and Lampl, 2008). These cortical studies show that feedforward inhibition can create a short time window over which excitatory input dominates synaptic integration; the resulting requirement that excitatory input increase rapidly to effectively drive spike output creates a selectivity for tightly synchronized excitatory input and a precise correspondence between spike timing and such synchronized input.
Feedforward inhibition in retina has been described in studies in mouse On alpha-like ganglion cells (Murphy and Rieke, 2006; Münch et al., 2009), guinea pig On brisk-transient ganglion cells (Zaghloul et al., 2003), several types of ganglion cell in rabbit (Roska et al., 2006), and primate midget ganglion cells (Cafaro and Rieke, 2010; Crook et al., 2011). Ganglion cell responses are often considerably more transient than those of photoreceptors or bipolar cells. Although feedforward inhibition is well poised to contribute to transient responses, direct evidence for such a role in shaping spike output has been largely lacking. One exception comes from ablation of a class of amacrine cells in mouse retina. Removal of these amacrine cells caused ganglion cell responses to a light increment to change from transient to sustained (Nirenberg and Meister, 1997). Amacrine cells could shorten the duration of the spike response via feedback inhibition to bipolar cells or feedforward inhibition directly to ganglion cells.
Here we measured the inhibitory synaptic inputs to On midget ganglion cells and manipulated those inputs using the dynamic clamp approach. This approach revealed a clear role of feedforward inhibition in controlling the timing and amplitude of the On midget responses to temporally modulated light inputs. Interestingly, On parasol ganglion cells, which generate more transient responses than midget cells, received relatively little feedforward inhibitory input; further, inhibitory input did not substantially contribute to the transience of the On parasol cell light responses to full-field stimuli. Thus while feedforward inhibition can contribute to transient responses, other mechanisms that shape the transience of excitatory synaptic inputs before reaching a ganglion cell can be at least as important.
Feedforward inhibition also shaped how On midget cells integrated inputs across space. Midget cells are classically characterized by linear spike responses to grating stimuli (Petrusca et al., 2007). For a linear cell, it should be possible to find a position of a split-field stimulus that does not modulate a cell’s response. We found that we could not fully null On midget responses to split-field stimuli; the degree of nonlinearity, determined from the ratio of the split-field to full-field responses, was consistent with recordings from cells in parvocellular layers of the lateral geniculate nucleus that receive midget cell input (Derrington and Lennie, 1982). Excitatory synaptic inputs to On midget cells tended to exhibit stronger nonlinearities than spike outputs. Consistent with this result, inhibitory synaptic inputs to On midget cells also exhibited strong nonlinear spatial integration, and these nonlinear inhibitory inputs appeared to partially cancel the nonlinear excitatory input and increase the linearity of the spike response. Supporting this interpretation, On midget cell dynamic clamp experiments like those performed using On parasol cells in Figure 10 indicated that inhibitory synaptic input approximately halved the midget response to split-field sinusoidal stimuli (data not shown). This suggests that nonlinear spatial integration in On midget cells may be revealed by other stimuli that favor excitatory input over inhibitory input.
Multiple functional roles of crossover inhibition
On parasol ganglion cells received primarily crossover inhibition—such that for full-field stimuli increases in excitatory input occurred together with decreases in inhibitory input. Crossover inhibition has been proposed to shape the receptive fields of simple cells in visual cortex (Ferster, 1988) and of several types of ganglion cells (Roska et al., 2006). In both guinea pig (Manookin et al., 2008) and primate (Manookin et al., 2010), crossover inhibition extends the range over which some ganglion cell types encode light inputs. Crossover inhibition has also been suggested to make ganglion cell spike responses more linear than the cells’ excitatory inputs (Werblin, 2010) and to shape responses to second-order motion (Demb et al., 2001b). In mouse Off alpha-like ganglion cells, using an approach similar to ours here, crossover inhibition was found to play a gatekeeper role—such that excitatory input could modulate spike output only during times when inhibitory input was small (Murphy and Rieke, 2006).
Here we found that inhibitory input to primate On parasol cells played at most a minor role in shaping responses to full-field light stimuli. This was surprising given that the inhibitory conductance could be several times larger than the excitatory conductance; apparently the lack of excitatory conductance alone was sufficient to suppress spiking, and additional inhibitory input during those time periods had little effect. Inhibitory synaptic input did increase membrane hyperpolarization between epochs of spiking (Fig. 5A); unlike other ganglion cell types (Weick and Demb, 2011), such hyperpolarization did not strongly engage voltage-activated conductances that then altered excitability. In general, crossover inhibition will cause increases in inhibitory input to occur together with decreases in excitatory input for inputs derived from the same region of space. The anticorrelation of the conductances, and the sensitivity of the excitatory conductance to subtle changes in light input, appears to minimize the impact of inhibitory input derived from the same region of space as excitatory input.
Spatially dependent role of inhibition in shaping response kinetics
Rectification of excitatory inputs from bipolar cells is well known to affect ganglion cell spatial integration. Specifically, increments in one spatial location and decrements in another cancel in cells that integrate over space linearly but fail to cancel in cells with rectifying bipolar inputs. Nonlinear spatial integration, first observed in cat (Enroth-Cugell and Robson, 1966; Hochstein and Shapley, 1976), is a distinguishing feature of specific ganglion cell types in many retinas (for review, see Schwartz and Rieke, 2011).
Both excitatory and inhibitory synaptic inputs to On parasol cells were strongly rectified. Further, excitatory synaptic inputs elicited by equal and opposite stimuli in different regions of space failed to fully cancel, indicating nonlinear summation. Inhibitory synaptic inputs similarly showed nonlinear summation. Although the amacrine cells providing inhibitory input have not been identified, the nonlinear spatial summation indicates that much of the inhibitory input comes from cells with small receptive fields compared with that of the parasol cell. This is consistent with the importance of narrow-field glycinergic amacrine cells in producing crossover inhibition (Werblin, 2010).
Rectification suggested that different regions of space could dominate excitatory and inhibitory synaptic input, and hence that the temporal relationship between excitatory and inhibitory input could be shaped by the spatial structure of the light inputs. Indeed, we found that stimuli with equal and opposite changes in intensity for two halves of a cell’s receptive field altered the temporal relationship between excitatory and inhibitory inputs to On parasol cells, such that increases in excitatory input were followed, with a brief delay, by increases in inhibitory input. For these stimuli inhibitory input played a functional role like that of feedforward inhibition—causing the responses to split-field stimuli to be more transient than responses to full-field stimuli (Fig. 9C,E).
Split-field stimuli were chosen to explore how the temporal relationship between excitatory and inhibitory inputs depended on spatial structure. More generally, inputs with fine spatial structure—such as textures—should elicit positively correlated excitatory and inhibitory inputs as bright regions will dominate excitatory input and dark regions will dominate inhibitory input. By analogy with its effect on split-field stimuli, crossover inhibitory input to On parasol cells should make responses to such stimuli weaker and more transient than expected from excitatory input alone. It will be interesting in future experiments to extend such analysis to conductances in the receptive field center and surround to provide a more complete description of how parasol responses to spatial structure are controlled.
Multiple-component input provides mechanisms for stimulus-dependent light responses
Several anatomically distinct types of amacrine cells make synapses onto On parasol ganglion cell dendrites (Jacoby et al., 1996; Marshak et al., 2002). In agreement with these observations, our measurements of excitatory and inhibitory synaptic input to these cells also suggest that they are composed of multiple components. On parasol ganglion cells received both crossover and feedforward inhibition. Further, suppression of signaling in On bipolar cells with APB during split-field stimuli revealed a faster crossover inhibitory component (Fig. 7C); this component appears to be suppressed under control conditions by activation of On bipolar cells. Application of APB similarly reveals a suppressed crossover excitatory input (Ala-Laurila et al., 2011). Together these observations indicate that both excitatory and inhibitory synaptic inputs to On parasol cells consist of several distinct components, some of which are actively suppressed or seemingly unimportant (e.g., feedforward inhibition) during particular light stimuli.
As observed here, changing the stimulus can significantly change the contribution of a particular input component to shaping the light response. Other ostensibly irrelevant inputs may similarly be important under some circumstances. This suggests approaching synaptic integration by searching stimulus space with the expressed goal of revealing a role for each identifiable synaptic component. Such experiments may better reveal the visual stimulus space that a given type of ganglion cell has evolved to discriminate.
Acknowledgments
This work was supported by the National Institutes of Health (Grant EY11850) and the Howard Hughes Medical Institute. We thank Vikas Bhandawat, Sid Kuo, Mike Manookin, and Greg Schwartz for comments on the manuscript, and Mark Cafaro, Daniel Carleton, Eric Martinson, and Paul Newman for excellent technical support.
Footnotes
Author contributions: J.C. and F.R. designed research; J.C. and F.R. performed research; J.C. and F.R. analyzed data; J.C. and F.R. wrote the paper.
References
- Ala-Laurila P, Greschner M, Chichilnisky EJ, Rieke F. Cone photoreceptor contributions to noise and correlations in the retinal output. Nat Neurosci. 2011;14:1309–1316. doi: 10.1038/nn.2927. [DOI] [PMC free article] [PubMed] [Google Scholar]
- Baylor DA, Nunn BJ, Schnapf JL. The photocurrent, noise and spectral sensitivity of rods of the monkey Macaca fascicularis. J Physiol. 1984;357:575–607. doi: 10.1113/jphysiol.1984.sp015518. [DOI] [PMC free article] [PubMed] [Google Scholar]
- Baylor DA, Nunn BJ, Schnapf JL. Spectral sensitivity of cones of the monkey Macaca fascicularis. J Physiol. 1987;390:145–160. doi: 10.1113/jphysiol.1987.sp016691. [DOI] [PMC free article] [PubMed] [Google Scholar]
- Cafaro J, Rieke F. Noise correlations improve response fidelity and stimulus encoding. Nature. 2010;468:964–967. doi: 10.1038/nature09570. [DOI] [PMC free article] [PubMed] [Google Scholar]
- Chichilnisky EJ, Kalmar RS. Functional asymmetries in ON and OFF ganglion cells of primate retina. J Neurosci. 2002;22:2737–2747. doi: 10.1523/JNEUROSCI.22-07-02737.2002. [DOI] [PMC free article] [PubMed] [Google Scholar]
- Crook JD, Peterson BB, Packer OS, Robinson FR, Troy JB, Dacey DM. Y-cell receptive field and collicular projection of parasol ganglion cells in macaque monkey retina. J Neurosci. 2008;28:11277–11291. doi: 10.1523/JNEUROSCI.2982-08.2008. [DOI] [PMC free article] [PubMed] [Google Scholar]
- Crook JD, Manookin MB, Packer OS, Dacey DM. Horizontal cell feedback without cone type-selective inhibition mediates “red-green” color opponency in midget ganglion cells of the primate retina. J Neurosci. 2011;31:1762–1772. doi: 10.1523/JNEUROSCI.4385-10.2011. [DOI] [PMC free article] [PubMed] [Google Scholar]
- Dacey DM, Packer OS. Colour coding in the primate retina: diverse cell types and cone-specific circuitry. Curr Opin Neurobiol. 2003;13:421–427. doi: 10.1016/s0959-4388(03)00103-x. [DOI] [PubMed] [Google Scholar]
- Demb JB, Zaghloul K, Haarsma L, Sterling P. Bipolar cells contribute to nonlinear spatial summation in the brisk-transient (Y) ganglion cell in mammalian retina. J Neurosci. 2001a;21:7447–7454. doi: 10.1523/JNEUROSCI.21-19-07447.2001. [DOI] [PMC free article] [PubMed] [Google Scholar]
- Demb JB, Zaghloul K, Sterling P. Cellular basis for the response to second-order motion cues in Y retinal ganglion cells. Neuron. 2001b;32:711–721. doi: 10.1016/s0896-6273(01)00484-6. [DOI] [PubMed] [Google Scholar]
- Derrington AM, Lennie P. The influence of temporal frequency and adaptation level on receptive field organization of retinal ganglion cells in cat. J Physiol. 1982;333:343–366. doi: 10.1113/jphysiol.1982.sp014457. [DOI] [PMC free article] [PubMed] [Google Scholar]
- Dunn FA, Lankheet MJ, Rieke F. Light adaptation in cone vision involves switching between receptor and post-receptor sites. Nature. 2007;449:603–606. doi: 10.1038/nature06150. [DOI] [PubMed] [Google Scholar]
- Enroth-Cugell C, Robson JG. The contrast sensitivity of retinal ganglion cells of the cat. J Physiol. 1966;187:517–552. doi: 10.1113/jphysiol.1966.sp008107. [DOI] [PMC free article] [PubMed] [Google Scholar]
- Ferster D. Spatially opponent excitation and inhibition in simple cells of the cat visual cortex. J Neurosci. 1988;8:1172–1180. doi: 10.1523/JNEUROSCI.08-04-01172.1988. [DOI] [PMC free article] [PubMed] [Google Scholar]
- Field GD, Chichilnisky EJ. Information processing in the primate retina: circuitry and coding. Annu Rev Neurosci. 2007;30:1–30. doi: 10.1146/annurev.neuro.30.051606.094252. [DOI] [PubMed] [Google Scholar]
- Gabernet L, Jadhav SP, Feldman DE, Carandini M, Scanziani M. Somatosensory integration controlled by dynamic thalamocortical feed-forward inhibition. Neuron. 2005;48:315–327. doi: 10.1016/j.neuron.2005.09.022. [DOI] [PubMed] [Google Scholar]
- Hochstein S, Shapley RM. Linear and nonlinear spatial subunits in Y cat retinal ganglion cells. J Physiol. 1976;262:265–284. doi: 10.1113/jphysiol.1976.sp011595. [DOI] [PMC free article] [PubMed] [Google Scholar]
- Isaacson JS, Scanziani M. How inhibition shapes cortical activity. Neuron. 2011;72:231–243. doi: 10.1016/j.neuron.2011.09.027. [DOI] [PMC free article] [PubMed] [Google Scholar]
- Jacoby R, Stafford D, Kouyama N, Marshak D. Synaptic inputs to ON parasol ganglion cells in the primate retina. J Neurosci. 1996;16:8041–8056. doi: 10.1523/JNEUROSCI.16-24-08041.1996. [DOI] [PMC free article] [PubMed] [Google Scholar]
- Luna VM, Schoppa NE. GABAergic circuits control input-spike coupling in the piriform cortex. J Neurosci. 2008;28:8851–8859. doi: 10.1523/JNEUROSCI.2385-08.2008. [DOI] [PMC free article] [PubMed] [Google Scholar]
- Manookin MB, Beaudoin DL, Ernst ZR, Flagel LJ, Demb JB. Disinhibition combines with excitation to extend the operating range of the OFF visual pathway in daylight. J Neurosci. 2008;28:4136–4150. doi: 10.1523/JNEUROSCI.4274-07.2008. [DOI] [PMC free article] [PubMed] [Google Scholar]
- Manookin MB, Crook JD, Dacey D. ARVO 2010 Abstracts. Fort Lauderdale, FL: 2010. May 6–10, Synaptic origins of excitatory and inhibitory conductances in midget and parasol ganglion cells of the macaque monkey retina. Program #1867/D748. [Google Scholar]
- Marshak DW, Yamada ES, Bordt AS, Perryman WC. Synaptic input to an ON parasol ganglion cell in the macaque retina: a serial section analysis. Vis Neurosci. 2002;19:299–305. doi: 10.1017/s0952523802192078. [DOI] [PMC free article] [PubMed] [Google Scholar]
- Merigan WH, Maunsell JH. How parallel are the primate visual pathways? Annu Rev Neurosci. 1993;16:369–402. doi: 10.1146/annurev.ne.16.030193.002101. [DOI] [PubMed] [Google Scholar]
- Mittmann W, Koch U, Häusser M. Feed-forward inhibition shapes the spike output of cerebellar Purkinje cells. J Physiol. 2005;563:369–378. doi: 10.1113/jphysiol.2004.075028. [DOI] [PMC free article] [PubMed] [Google Scholar]
- Münch TA, da Silveira RA, Siegert S, Viney TJ, Awatramani GB, Roska B. Approach sensitivity in the retina processed by a multifunctional neural circuit. Nat Neurosci. 2009;12:1308–1316. doi: 10.1038/nn.2389. [DOI] [PubMed] [Google Scholar]
- Murphy GJ, Rieke F. Network variability limits stimulus-evoked spike timing precision in retinal ganglion cells. Neuron. 2006;52:511–524. doi: 10.1016/j.neuron.2006.09.014. [DOI] [PMC free article] [PubMed] [Google Scholar]
- Nirenberg S, Meister M. The light response of retinal ganglion cells is truncated by a displaced amacrine circuit. Neuron. 1997;18:637–650. doi: 10.1016/s0896-6273(00)80304-9. [DOI] [PubMed] [Google Scholar]
- Okun M, Lampl I. Instantaneous correlation of excitation and inhibition during ongoing and sensory-evoked activities. Nat Neurosci. 2008;11:535–537. doi: 10.1038/nn.2105. [DOI] [PubMed] [Google Scholar]
- Petrusca D, Grivich MI, Sher A, Field GD, Gauthier JL, Greschner M, Shlens J, Chichilnisky EJ, Litke AM. Identification and characterization of a Y-like primate retinal ganglion cell type. J Neurosci. 2007;27:11019–11027. doi: 10.1523/JNEUROSCI.2836-07.2007. [DOI] [PMC free article] [PubMed] [Google Scholar]
- Pouille F, Scanziani M. Enforcement of temporal fidelity in pyramidal cells by somatic feed-forward inhibition. Science. 2001;293:1159–1163. doi: 10.1126/science.1060342. [DOI] [PubMed] [Google Scholar]
- Roska B, Molnar A, Werblin FS. Parallel processing in retinal ganglion cells: how integration of space-time patterns of excitation and inhibition form the spiking output. J Neurophysiol. 2006;95:3810–3822. doi: 10.1152/jn.00113.2006. [DOI] [PubMed] [Google Scholar]
- Schnapf JL, Nunn BJ, Meister M, Baylor DA. Visual transduction in cones of the monkey Macaca fascicularis. J Physiol. 1990;427:681–713. doi: 10.1113/jphysiol.1990.sp018193. [DOI] [PMC free article] [PubMed] [Google Scholar]
- Schwartz G, Rieke F. Nonlinear spatial encoding by retinal ganglion cells: when 1 + 1 ≠ 2. J Gen Physiol. 2011;138:283–290. doi: 10.1085/jgp.201110629. [DOI] [PMC free article] [PubMed] [Google Scholar]
- Sharp AA, O’Neil MB, Abbott LF, Marder E. Dynamic clamp: computer-generated conductances in real neurons. J Neurophysiol. 1993;69:992–995. doi: 10.1152/jn.1993.69.3.992. [DOI] [PubMed] [Google Scholar]
- Trong PK, Rieke F. Origin of correlated activity between parasol retinal ganglion cells. Nat Neurosci. 2008;11:1343–1351. doi: 10.1038/nn.2199. [DOI] [PMC free article] [PubMed] [Google Scholar]
- Victor JD, Purpura KP. Metric-space analysis of spike trains: theory, algorithms and application. Network Comput Neural Syst. 1997;8:127–164. [Google Scholar]
- Wehr M, Zador AM. Balanced inhibition underlies tuning and sharpens spike timing in auditory cortex. Nature. 2003;426:442–446. doi: 10.1038/nature02116. [DOI] [PubMed] [Google Scholar]
- Weick M, Demb JB. Delayed-rectifier K channels contribute to contrast adaptation in mammalian retinal ganglion cells. Neuron. 2011;71:166–179. doi: 10.1016/j.neuron.2011.04.033. [DOI] [PMC free article] [PubMed] [Google Scholar]
- Werblin FS. Six different roles for crossover inhibition in the retina: correcting the nonlinearities of synaptic transmission. Vis Neurosci. 2010;27:1–8. doi: 10.1017/S0952523810000076. [DOI] [PMC free article] [PubMed] [Google Scholar]
- Wilent WB, Contreras D. Stimulus-dependent changes in spike threshold enhance feature selectivity in rat barrel cortex neurons. J Neurosci. 2005;25:2983–2991. doi: 10.1523/JNEUROSCI.4906-04.2005. [DOI] [PMC free article] [PubMed] [Google Scholar]
- Zaghloul KA, Boahen K, Demb JB. Different circuits for ON and OFF retinal ganglion cells cause different contrast sensitivities. J Neurosci. 2003;23:2645–2654. doi: 10.1523/JNEUROSCI.23-07-02645.2003. [DOI] [PMC free article] [PubMed] [Google Scholar]


