Abstract
Low Reynolds number airflow in the pulmonary acinus and aerosol particle kinetics therein are significantly conditioned by the nature of the tidal motion of alveolar duct geometry. At least two components of the ductal structure are known to exhibit stress-strain hysteresis: smooth muscle within the alveolar entrance rings, and surfactant at the air-tissue interface. We hypothesize that the geometric hysteresis of alveolar duct is largely determined by the interaction of the amount of smooth muscle & connective tissue in ductal rings, septal tissue properties, and surface tension-surface area characteristics of surfactant. To test this hypothesis, we have extended the well-known structural model of the alveolar duct by Wilson and Bachofen (J. Appl. Physiol. 52(4): 1064–1070, 1982) by adding realistic elastic and hysteretic properties of 1) the alveolar entrance ring, 2) septal tissue, and 3) surfactant. With realistic values for tissue and surface properties, we conclude that: 1) there is a significant, and underappreciated, amount of geometric hysteresis in alveolar ductal architecture; and 2) the contribution of smooth muscle and surfactant to geometric hysteresis are of opposite senses, tending toward cancellation. Quantitatively, the geometric hysteresis found experimentally by Miki et al. (J. Appl. Physiol. 75(4): 1630–1636, 1993) is consistent with little or no smooth muscle tone in anesthetized rabbits in control conditions, and with substantial smooth muscle activation following methacholine challenge. The observed local hysteretic boundary motion of the acinar duct would result in irreversible acinar flow fields, which might be important mechanistic contributors to aerosol mixing and deposition deep in the lung.
Keywords: lung, surfactant, smooth muscle, connective tissue, geometric hysteresis, acinar kinematic irreversibility, finite element model, micromechanics
INTRODUCTION
The airflow patterns of low Reynolds number acinar gas flow and the fate of inhaled particles suspended therein are largely determined by acinar wall motion. Because of the characteristic structure of acinar duct, namely a thoroughfare channel surrounded by numerous dead-end air pockets, a central channel flow passing by alveoli induces a slowly rotating flow in a rhythmically expanding/contracting alveolus. The alveolar flow with recirculation can be chaotic under the effect of small disturbances (54). Perturbation includes 1) the effects of small nonzero Reynolds numbers (inertial effects) studied in e.g., Tsuda et al. (1995) and Henry et al. (2002, 2009), and 2) the effects of a small asynchrony between ductal flow oscillation and cyclic alveolar wall motion studied in e.g., Haber et al. (2000, 2003) and Haber & Tsuda (2006). The focus of this study is on the latter case.
Whereas the principal mode of lung expansion approximately satisfies geometric similarity (1,18,19,38,56,57), it is known that during tidal ventilation geometric hysteresis does exist, albeit small in magnitude (38). We have both experimentally and theoretically demonstrated that the presence of such wall motion irreversibility (i.e. temporal asynchrony), even if small in magnitude, can cause significant acinar flow kinematic irreversibility and consequently enhance aerosol mixing and deposition in the pulmonary acinus (8,21–25,50–55). The motivation for this study, therefore, was to identify and quantify the mechanical origins of acinar geometric hysteresis.
Wilson and Bachofen’s seminal work (1982) showed that acinar airway architecture is maintained by a balance between forces pulling the alveolar duct radially inward (hoop stresses associated with tension borne in the connective tissue and smooth muscle in the alveolar entrance ring), and forces retracting the duct radially outward (primarily associated with alveolar septal surface tension at the air-liquid interface, but which may also include septal tissue tension). Because under cyclic expansion and contraction, these forces behave hysteretically, (e.g., 27,43), the resulting acinar geometry will display geometric hysteresis depending upon the balance of stress hysteresis of these mechanical elements in series. For example, if all elements mechanically in series display the same time dependence of their stress relaxation or adaptation, then in spite of even large stress hysteresis, there will be no geometric hysteresis. By contrast, to the extent that the time courses of stress adaptation between the ductal connective tissue, surface tension, and septal tissue tension are not strictly proportional, then there will be geometric hysteresis, in the sense of a different fractionation of acinar volume between duct and alveoli on inspiration and expiration, at the same overall lung volume.
We quantified these ideas in the context of a simple geometric model of a rhythmically expanding/contracting alveolated duct, whose alveolar septa are in mechanical equilibrium as described above. We extended Wilson and Bachofen’s analytical model, using finite element computational techniques, to incorporate realistic, experimentally based, nonlinearly elastic and hysteretic behaviors of all stress bearing elements.
The analyses showed several patterns of geometric hysteresis (including loop sense reversals as found by Miki et al. 1993), depending on the magnitude of hysteretic characteristics of force bearing elements. In particular, smooth muscle tone in the alveolar entrance ring plays an important role in the geometrically hysteretic behavior of acinar architecture.
MATERIAL AND METHODS
Model geometry
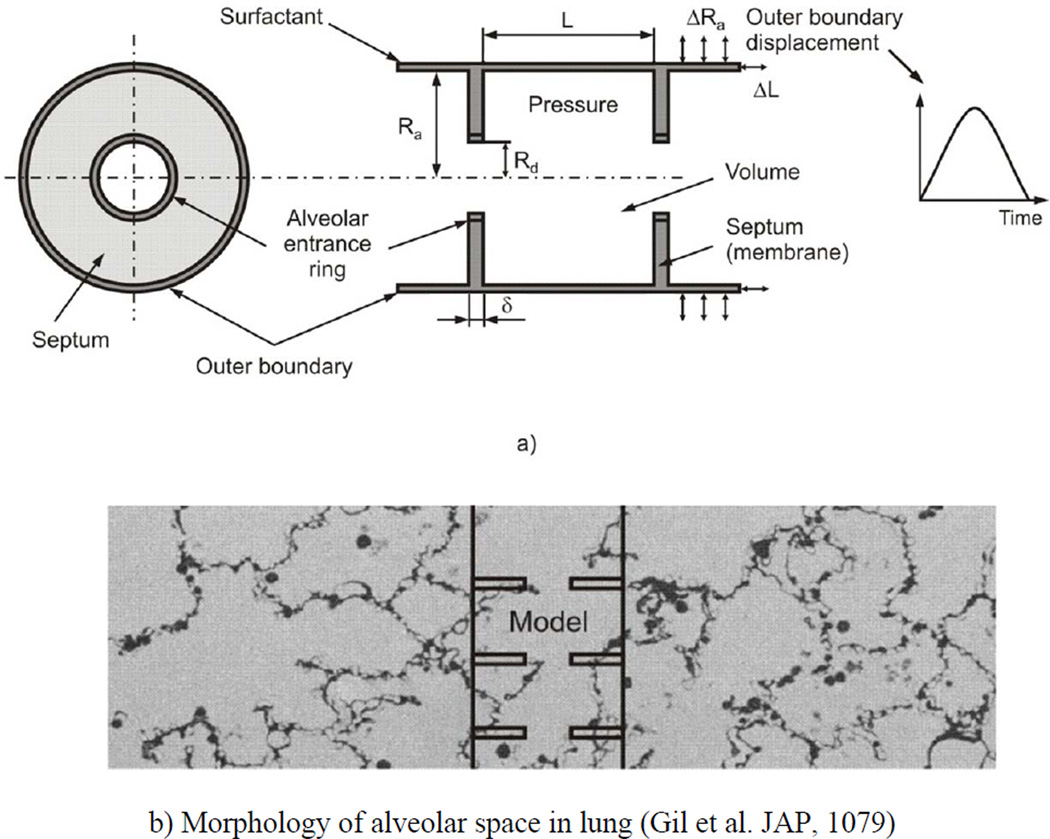
Our simplified geometric model of acinar architecture consists of three components (Fig. 1a). (1) The outer boundary of the acinus is represented by a long expandable closed-end cylindrical pipe whose kinematic motion is prescribed. The outer boundary corresponds to what is described as primary alveolar septa in development, here referred to as outer wall septa. (2) The septa connecting the outer wall with the alveolar duct (secondary septa developmentally) are represented by annular disks, here referred to as simply radial septa. (3) The duct proper is represented by stress bearing rings at the inner openings. In Fig. 1b, the manner in which this model represents actual parenchymal architecture is shown by the overlay of the model on a photomicrograph showing the morphology of the alveolar space. The model is axisymmetric, composed of repeated unit cells with outer (acinar) and inner (ductal) radii of Ra and Rd, respectively, and axial length L. Thus, the volume of the unit cell, bounded by the outer wall and two neighboring radial septa (extended to closed disks), is πRa2L; the surface S of the radial septa is 2π(Ra2− Rd2) (the factor of 2 arises from two radial septa facing the interior of each unit cell). The thickness of the radial septa is denoted by δ.
Figure 1.
(a) Schematic of the model of alveolar duct: left panel – cross-section in the plane orthogonal to the duct longitudinal axis, right panel – axial cross-section of duct; and (b) representative geometric location of the model in the acinus, with morphology of alveolar space in lung (19).
Material models
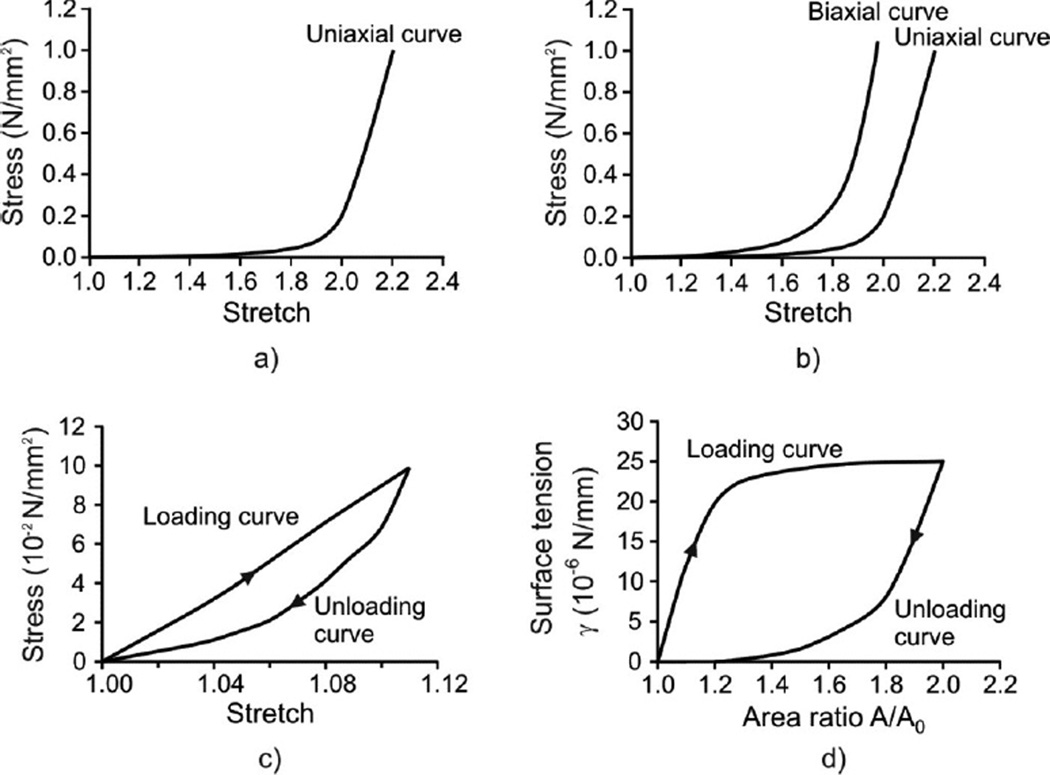
The material properties of each model component are as follows. First, the major material constituents of the alveolar entrance ring are connective tissue and smooth muscle (39–41). The connective tissue exhibit a nonlinear constitutive law, and is hysteretic with a weak power law dependence on frequency (49,60). But at breathing frequencies, its hysteresis is low, which we neglect in comparison with that of the smooth muscle. In short, we take the connective tissue to be essentially elastic (i.e. history independent). By contrast, the smooth muscle response is both nonlinear and displays significant hysteresis (20,43,46). A typical uniaxial stress/stretch curve for entrance ring connective tissue of cat lung parenchyma is shown in Fig. 2a (16). Connective tissue within the radial and outer wall septa is described by representative uniaxial and biaxial stress/stretch curves in Fig. 2b (16,26); this is described in more detail below. Stress/stretch behavior of smooth muscle is shown in Fig. 2c, taken from Sasaki and Hoppin (1979); note the hysteresis present. The fractionation of the stress born in parallel within the ductal ring between muscle and connective tissue is quantified by a fraction m approximated by the ductal ring volume density of muscle), where 0 < m < 1. This is a functional fractionation, related to both the morphometric volume fraction and to the degree of activation of the smooth muscle.
Figure 2.
Material models used in the analysis. a) Uniaxial model for connective tissue of alveolar ring (16); b) Biaxial model for septum tissue (16,26); c) Hysteretic model of muscle constituent of ring material (43); d) Hysteretic characteristic of surfactant (58).
The radial septum is modeled as a membrane made of a nonlinear elastic material with hardening characteristics. The constitutive law for the mechanical behavior of homogeneous isotropic membranes can be deduced from uniaxial or biaxial loading experiments (e.g., 26,35). First, we adopted the uniaxial curve of Fukaya et al. (1968) (Figs. 2a and 2b (right curve)). Because the biaxial curve for alveolar septa has never been measured, we estimated it from the material characteristics of a similar biological membrane, cat mesentery, obtained by Hildebrandt et al. (1969). Assuming that the ratio between the biaxial and uniaxial stresses at a given stretch is similar in both tissues, we estimated the biaxial curve of alveolar septa (Fig. 2b (left curve)) based on the uniaxial curve measured by Fukaya et al. (1968). For general loading, the stress/stretch states lie between the biaxial and uniaxial curves. Our algorithm (see Appendix) computes stresses for in-plane stretches in the principal strain directions; in our case these are circumferential (or hoop) and radial directions.
The surface of the model is covered by surfactant (Fig. 1a). The air-liquid interface generates surface tension γ, which is an external load on the tissue surface. We assume a no-slip condition between the surfactant layer and the underlying tissue; this implies that the surface tension may vary locally as it follows potentially nonuniform strain in the radial septa. The surface tension-surface area relationship exhibits hysteretic behavior during cyclic motion. It has been measured surfactometrically from bronchoalveolar lavage (BAL) fluid extracts (27), by models and inferences from pressure-volume (PV) curves and morphometry in excised and intact lungs (34,45,47,58), and by direct observation of the spread of liquid droplets (5,45). The constitutive relationship (Fig. 2d), calculated by Wilson (1982) based on PV curves and morphometry in rabbits (4,19) is used in this study. Note that all material models shown in Fig. 2 rely on data obtained under quasi-static conditions. The above is a simplification; indeed, the hysteretic behavior of surfactant during quiet breathing remains controversial (42, 44). Nevertheless, to the extent that we choose to lump all the septal hysteresis in the surfactant layer, given that it is mechanically in parallel with septal tissue with a no-slip condition, this artificial compartmentalization is likely to give rise to only minor differences in behavior.
Boundary conditions
The outer wall septa of the model expand and contract in a geometrically similar fashion, representing the principal mode of lung expansion (1,18,19,38,56,57). We take the time dependence to be sinusoidal, although the temporal evolution in this work is entirely a sequence of quasi-steady states; there are no dynamics per se, and time plays only a role of a parameter which labels the volume. We write the radial and axial motions of the outer acinar boundary, Ra(t) and L(t), as
| (1) |
where Rmean and ΔRa are the mean radius and the peak-to-peak amplitude of the outer boundary radial displacement, which we take numerically to be 328 µm and 176 µm respectively. Note that the peak-to-peak amplitude of radial displacement corresponds to the volume change from minimal volume to total lung capacity, similar to simulations by Denny and Schroter (2000). We take the aspect ratio of alveoli to approximate spherical symmetry, and set L(0) = Ra(0) − Rd(0). The initial radius of the duct Rd(0) is taken as 120 µm. The initial thicknesses of both the radial and outer wall septa are taken to be 5 µm, and the initial cross-sectional area of the alveolar entrance ring to be 25 µm 2 (34,39). As noted above, time is only a parameter in this model, for convenience we take the period as 2π. Minimal volume occurs at time zero, at which point all elements (including surfactant) of the microstructure are assumed to be stress free. This corresponds to the zero transpulmonary state in an excised preparation.
Note that we are taking displacements as boundary conditions. From the whole organ point of view, lung displacements are driven by variations in pleural pressure, and therefore pressure boundary conditions would be most appropriate. On the other hand, at this level of modeling the geometric characteristics of the acinus, and in particular its geometric hysteresis, there is necessarily a unique relationship, albeit history dependent, between volume displacements and pressure. In that sense, dealing with volume displacements as boundary conditions as in Eq. 1 and computing the resulting pressures, is equivalent to setting pressure variations as the independent variable and computing the resulting volume displacements.
The governing equations for the radial septa
The quasi-static deformations of the radial septum and entrance ring can be determined by solving the two equilibrium equations for stresses σxx, σyy, σxy, in local Cartesian coordinates x and y in the septal plane:
| (2) |
The task in our analysis is to calculate, for a given radial displacement and history of the outer wall (the independent variable), the radial displacements of the alveolar entrance ring and septum in a way that satisfy these equilibrium equations together with the stresses and strains within the tissue and surfactant obeying the (hysteretic) constitutive laws.
Numerical model
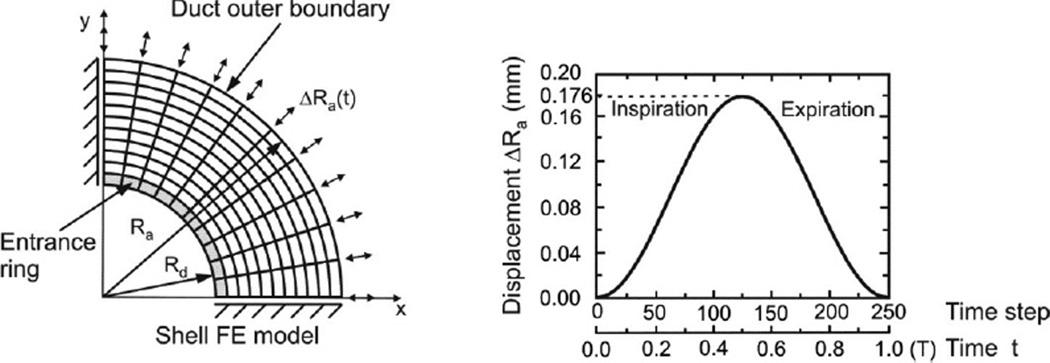
The magnitude of strains that we simulate is too large for use of a linear approximation schemes. We use a displacement based finite element numerical method (6,30,32) and implement the features of nonlinear, hysteretic materials into the finite element program PAK (29). One quarter of the septum is considered with imposed symmetric boundary conditions along the x and y axes (Fig. 3). Note that by virtue of circumferential symmetry of the radial boundary conditions at Rd and Ra, the solution inherits this same symmetry. We specify the radial displacement at the outer septum radius as shown in Fig 3 as arrows indicating displacements of Ra at the boundary.
Figure 3.
Finite element model of alveolar duct. Septum is modeled by membrane (shell) finite elements and ring is modeled by line finite elements. Deformations of ring and septum are calculated for prescribed radial displacement of the outer (acinar) boundary ΔRa = ΔRa,max sin t. Time is a parameter controlling volume history; no dynamics are associated with it. Solution is obtained incrementally using 250 steps over the breathing cycle.
Briefly, the alveolar entrance ring is modeled by line finite elements connecting the finite element nodes on the internal rim. In calculating the nodal forces resulting from the alveolar ring deformation, we use the material characteristics of each constituent, shown in Fig. 2c for muscle and in Fig. 2a for connective tissue. The alveolar septal membrane is modeled by isoparametric shell/membrane finite elements, with a biaxial material model (Fig. 2b). Surfactant is modeled by calculation of stresses in tissue due to surfactant, and then the nodal forces of the line and shell finite elements generated by surface tension (Fig. 2d) are evaluated. The stresses in tissue at a given point, caused by surface tension, depend on the history dependent local surfactant area strain of the surfactant surface at that point (see Appendix for details).
Our model consisted of 70 membrane elements and 10 line elements for the entrance ring with 88 nodal points. Number of steps in the incremental analysis was 250 (125 for inspiration and 125 for the expiration regime). Implicit incremental procedure (6,32) and implicit stress integration scheme of the constitutive relations (30,31) where implemented as the methods which provide the best solution accuracy; details are given in Appendix. We used tight equilibrium iteration tolerance of 10−6 in order to secure solution accuracy at each load step.
Quantifying geometric hysteresis
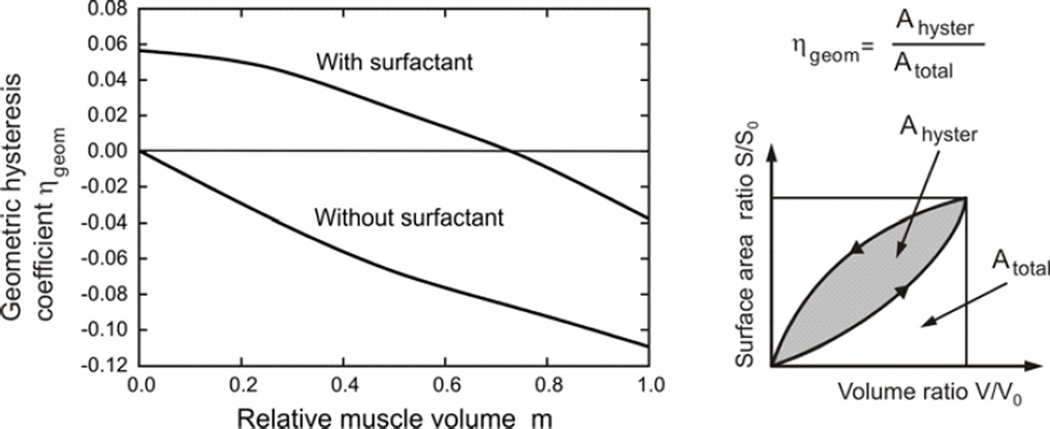
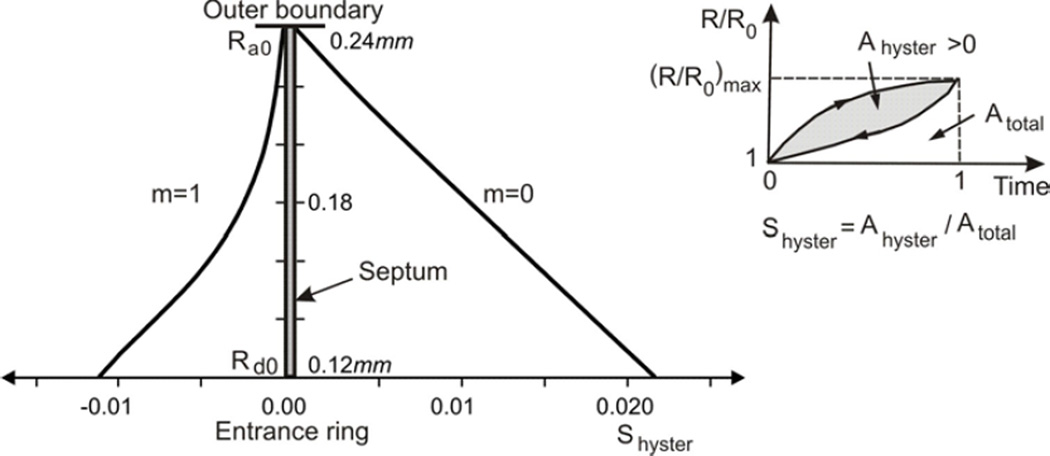
We define a coefficient of geometric hysteresis ηgeom by the ratio of the loop area on the surface area-volume plot to the area of the bounding rectangle enclosing the loop. This definition is an exact analogy to the shape factor for pressure-volume hysteresis introduced by Bachofen and Hildebrandt (1971) and extended to non-elliptical curves by Fredberg and Stamenovic (1989). (This construction is shown graphically as a cartoon in Fig. 5). Trajectories of material points on the internal architecture display hysteretic character over breathing cycles (Fig. 7) and we have introduced a measure of hysteresis in displacements, the displacement hysteresis coefficient Shyster (Fig. 8), in an analogous way as for the area-volume hysteresis.
Figure 5.
Coefficient of geometric hysteresis ηgeom plotted against m; its geometric construction is shown in the cartoon. In the absence of muscle contribution, the hysteresis loop is entirely controlled by surfactant, and the loop is counterclockwise with positive ηgeom. Its value progressively decreases with muscle activation, crossing zero into a regime dominated by muscle, where the loops are clockwise and ηgeom is negative. Also shown is the hysteretic behavior in the absence of surfactant, showing the uniformly negative ηgeom.
Figure 7.
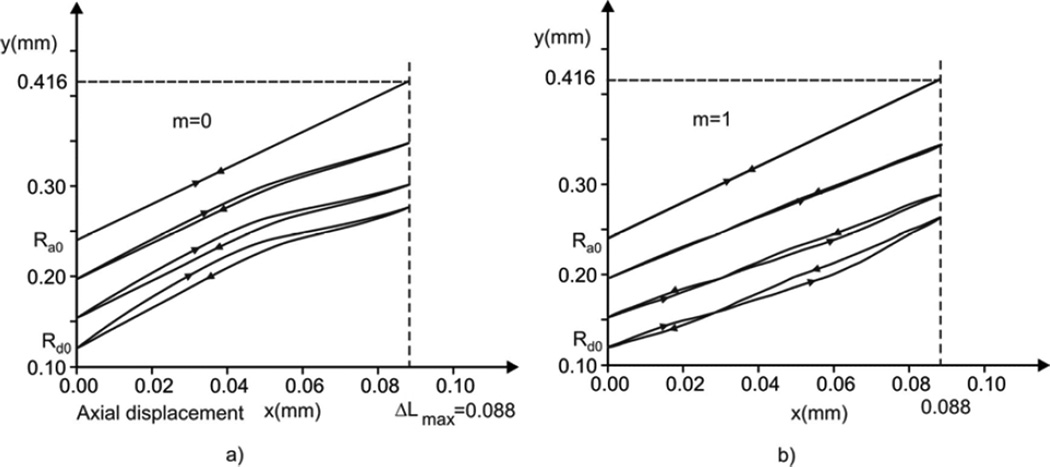
Particle trajectories within radial plane (x-y) of material points at outer boundary, internal rim and at two membrane radii. Axial maximum displacement is (ΔL)max = 0.5 (ΔRd)max following form geometrical similarity during alveolar deformation (see equation 1). a) Case with no muscle constituent (m = 0): the trajectories display clockwise hysteretic loops due to dominant surfactant action during inspiration (see Fig. 2d), with loops diminishing from the internal to the external membrane boundary; b) Case m = 1: The muscle hysteresis acts in the opposite sense form the surfactant effects (see Fig. 2c), and hysteretic loops become counterclockwise in the regime where muscle hysteretic effect is dominant (expiration regime); the loops diminish when approaching to external boundary.
Figure 8.
Distribution of displacement hysteresis coefficient Shyster. The ratio R(t) / R(0) displays a hysteretic character over a breathing cycle, and a measure of this hysteresis is defined as the ratio Shyster = Ahyster / Atotal. a) Case without muscle content within the ring (m = 0): the hysteretic loops are clockwise (considered positive) since displacements are larger during inspiration, and diminish toward the external boundary; b) Case m = 1: the overall hysteretic muscle characteristic is dominant and the surface Ahyster is negative (see Fig. 7b).
RESULTS
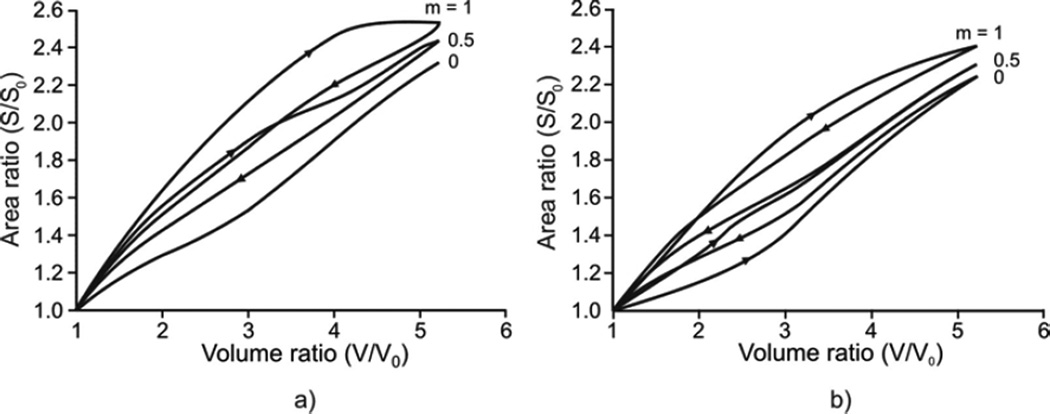
Geometric hysteresis represented by a septal surface – duct volume relationship is shown in Fig. 4. When surfactant is absent (Fig. 4a), the degree of geometric hysteresis in the S-V loop depends entirely on the amount of muscle constituent in the alveolar entrance ring; no S-V geometric hysteresis occurs with m = 0. As the amount of muscle fraction increases, the magnitude of geometric hysteresis increases (see m = 0.5, 1 in Fig. 4a). Note that the S-V hysteresis associated with muscle is clockwise in the S-V loop. By contrast, the S-V hysteresis associated with surfactant (in the absence of muscle, m = 0) is counterclockwise in the S-V loop (see m = 0 in Fig. 4b). A mechanism responsible for these opposing loop directions is described in the Discussion. With surfactant, the extent of geometric hysteresis decreases as the amount of muscle increases (e.g., m = 0.5), but is still dominated by the hysteretic characteristics of surfactant seen because the overall S-V loop remains counterclockwise (see m = 0.5 in Fig. 4b). With further increase in the amount of muscle (the limit m = 1), however, the S-V loop changes its direction to largely clockwise, showing a dominant role of muscle-driven hysteresis over surfactant-driven hysteresis (see m = 1 in Fig. 4b). Finally, it should be noted that these directional changes of geometric hysteresis due to the relative contribution of muscle-driven hysteresis to surfactant-driven hysteresis have indeed been observed in the lungs of live rabbits by Miki et al. (1993); see the Discussion.
Figure 4.
Geometric hysteresis within the alveolar duct. a) Case without surfactant. Geometric hystersesis is due to hysteresis of muscle constituent within the alveolar entrance ring and it increases with increasing m. The S-V hysteresis loop has a clockwise direction for one breathing cycle. b) Case with surfactant. The S-V hysteresis loop due to surfactant has counterclockwise direction (condition with no muscle constituent, m = 0). Since S-V hysteresis loops corresponding to muscle and surfactant have the opposite senses, the resulting hysteresis is smaller when m = 0.5 with respect to m=0 and the loop changes the direction for m = 1.
In Fig. 5, the coefficient of geometric hysteresis ηgeom is plotted with respect to muscle fraction in alveolar duct, m, for cases with and without surfactant. Note that our sign convention is to take Ahyster and hence ηgeom positive or negative as the S-V loop is counterclockwise or clockwise, respectively. Without surfactant, ηgeom is negative, and quantifies the clockwise S-V hysteresis entirely due to the hysteretic characteristics of muscle in the alveolar entrance ring. With surfactant present, on the other hand, ηgeom is positive for lower m values, consistent with the counterclockwise S-V hysteresis being dominated by surfactant; however, ηgeom becomes negative for higher m values, showing a progressive domination by muscle. These two effects are balanced at a muscle fraction of m ≈ 0.72, at which no net geometric hysteresis is observed.
Geometric hysteresis observed in the S-V loop (Figs. 4 and 5) are indeed originated from the hysteresis (or asynchrony) in radial septal displacements. This will be shown next in detail. We present change of the septal radii over one cycle, trajectories of material points of the septum, and radial displacement hysteresis, in Figs. 6–8, respectively. The results are obtained assuming that the septum is covered by surfactant, and that the alveolar entrance ring consists of two extreme cases of the muscle content: m=0 (no muscle) and m=1 (purely muscle).
Figure 6.
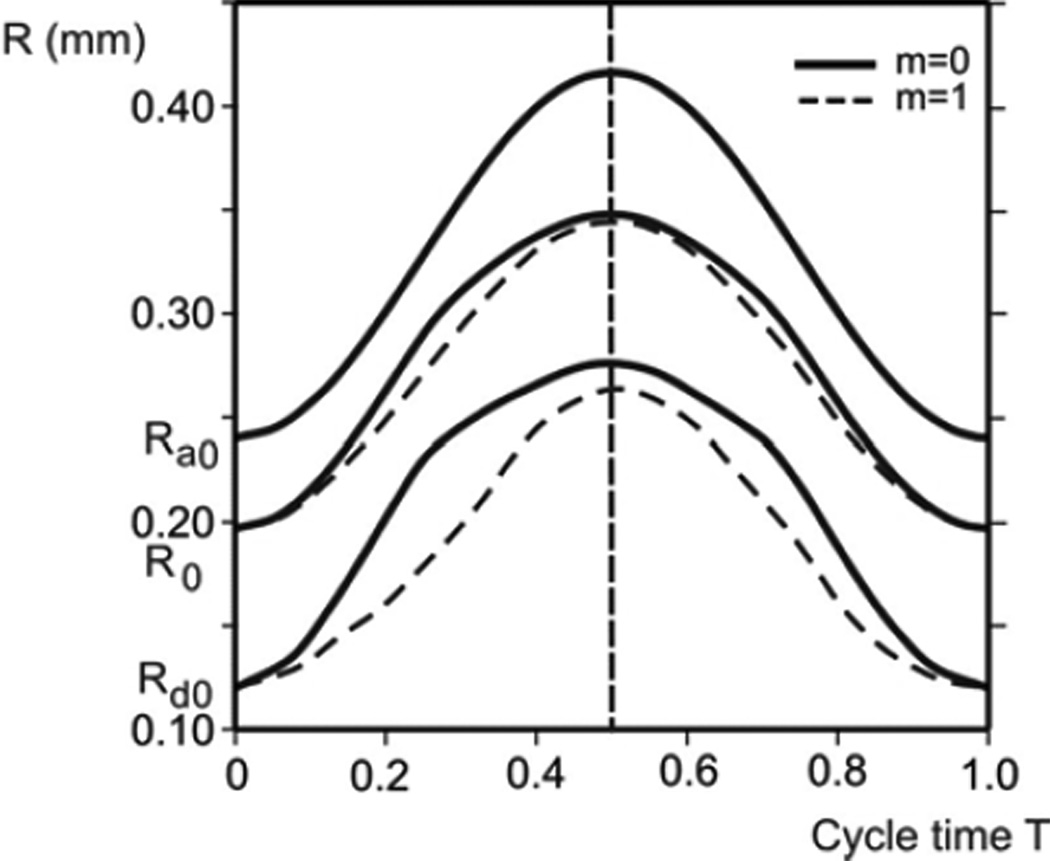
Radial displacements of internal rim (radius Rd), outer boundary (radius Ra), and points at initial radius R0 = 190 µm during one cycle; for two extreme cases: condition with no muscle constituent (m = 0), and with only muscle constituent within the ring (m = 1). Due to hysteretic characteristic of surfactant, radial displacement curves are not symmetric with respect to the middle line (end of inspiration), except for the outer boundary, with asymmetry more pronounced for the domain closer to internal rim. Displacements and asymmetry are smaller for m = 1.
Considering hysteresis In displacements, we first show radial displacements of the alveolar entrance ring (radius Rd), the model outer boundary (radius Ra), and a point close to the middle radius (initial radius R0 = 190 µm) during a breathing cycle (Fig. 6 ). While the time course of the outer boundary (Ra) is exactly symmetric with respect to the middle line (T = 0.5), which is dividing inspiration-expiration regimes, representing the imposed condition (see Equation (1) and Fig. 3), the time course of other material points at any radial position R (Ra ≤ R < Rd) on the septum exhibits asymmetry. The maximum asymmetry occurs at the inertial rim (Rd) and the extent of asymmetry monotonically decreases as R approaches Ra. The cases of no muscle content at the entrance ring, m = 0, are shown by solid lines, while the cases of m = 1 (totally muscle) are represented by dashed lines. A comparison between two cases shows that displacements and asymmetry are smaller for m = 1, indicating that hysteresis driven by smooth muscle acts in the opposite sense with respect to the surfactant hysteretic action.
Trajectories of septal material points in a radial x-y plane are shown in Fig. 7. Radial displacements of selected points (shown in the y-direction in the figure) are obtained from the FE model, while axial displacements (in the x-direction in the figure) are calculated using equation (1). Trajectories in Fig. 7a (no muscle content, m = 0) have hysteretic character of surfactant (except for the outer boundary with prescribed displacements), with the clockwise hysteretic loop. This clockwise loop characteristic is in agreement with the counterclockwise S-V hysteresis in Fig. 4a since smaller septal surface corresponds to larger radial displacements. Similarly to the phenomenon shown in Fig. 6, the hysteresis becomes smaller when the material points approach the outer boundary.
In Fig. 7b are shown trajectories of septal material points assuming m = 1. With the presence of both surfactant and muscle, the hysteretic effects of surfactant and muscle are superimposed. We have hysteretic trajectories with loops which change sign over the cycle. The loop of the inner rim is clockwise at the start of inspiration since the surfactant effects are dominant; contrary, toward the end of expiration, the muscle effect dominates and the loop becomes counterclockwise. As in case m = 0, the loops become smaller when approaching the duct boundary because the harmonic radial displacements are prescribed at the outer boundary.
An insight into a distribution of hysteresis in displacements along the septum radius can be seen from Fig. 8. In analogy to the definition of the coefficient of geometric hysteresis ηgeom (see Fig. 5), we introduce the displacement hysteresis coefficient Shyster as the ratio of the loop area on the displacement-time curve to the area of the bounding rectangle enclosing the loop. Here we have plotted values of the Shyster over the septum radius. In case of hysteresis due to surfactant only [with no muscle content (m = 0)], Shyster approximately linearly increases from no hysteresis (Shyster =0) at the external boundary to the maximum hysteresis at the internal radius; Shyster is positive showing that hysteresis loops are clockwise (graph on the right). Conversely, when with m = 1, Shyster is negative (graph on the left), indicating that the hysteresis due to the muscle dominates over to that due to the surfactant, Shyster is negative and nonlinearly increases (in value) from Shyster =0 at the outer boundary to the internal rim.
DISCUSSION
The principal findings of this study are: 1) the alveolar architecture exhibits geometric hysteresis due to the stress hysteretic characteristics of smooth muscle and surfactant. The hystereses of smooth muscle and surfactant act in opposing senses in terms of inducing geometric hysteresis, and tend toward quantitative cancellation. 2) The hysteretic characteristics of smooth muscle and/or surfactant produce asynchrony and hysteresis in radial septum displacements.
Methodology – a brief overview of past models & our basic computational approach and model limitation
In the past, a number of acinar microstructural models have been reported. Traditionally, it was first considered that the major load-carrying structural elements were the alveolar walls and the alveolar air-liquid interface covering the septal wall membranes. These types of “membrane” models with various configurations of space-filling polyhedrons were widely discussed [see a review by Fung (1990)]. In the early 80’s, the importance of the cables of fibers weaving through the alveolar ducts, especially through the alveolar entrance rings, was stressed as the other major load-carrying elements maintaining the alveolar microstructure (59). Since then, several “line” (or “line-membrane”) models have been proposed (e.g., 7,9–13,28,33). Among them, there are a few analytical models reported [exceptions include Budiansky and Kimmel (1987); Kimmel and Budiansky (1990)], chiefly due to analytic limitations associated with the nonlinearity of material characteristics. An alternative computational approach, especially in terms of incorporating experimentally obtained material properties (through constitutive laws) of microstructural elements into the structural model, has become more popular. For instance, one of the most complete computational models currently available in the literature includes the finite element model of Denny and Schroter (2000, 2006). The model consists of 36 truncated octahedra, with line elements (composed of elastin and collagen) located at septal borders and within the septal walls. Surfactant with hysteretic characteristics is also included, as well as geometric hysteresis (a main difference between these and our model, besides that our model includes smooth muscle with hysteretic characteristics in the alveolar entrance ring, is discussed below).
In the present study, the fundamental model design is based on the idea of Wilson and Bachofen (1982) that there are competing force-bearing structures in acinar microstructural architecture. Four dominant force bearing elements of acinar architecture were stretched into their nonlinear regime and the quasi-static motion of the model alveolar microstructure was solved numerically using state-of-the-art custom built finite element (FE) computational techniques (see e.g. 31,32). In particular, our model, unlike others (including the model by Denny and Schroter), is designed to probe the following specific characteristic: Because a force balance between the alveolar entrance ring inward force and alveolar septal outward surface force is demanded by equilibrium and because the hysteretic constitutive laws of the ductal tissue and radial septa (including surfactant) are different, the alveolar entrance ring and septum expand and contract asynchronously with respect to the motion of the ductal outer boundary. The consequence of this asynchrony is that the acinar architecture at the microstructural level does not deform in a geometrically similar fashion to the boundary deformation. This is likely to have a significant effects on aerosol mixing and deposition in the pulmonary acinus (8, 21–25, 50–55).
The model limitations rely on several simplifications, which might be classified into two groups – geometrical and material. It is assumed that the duct is an ideal circular cylinder, with the septum and internal ring also being axisymmetric and circular. It is taken that the material of septum and ring is isotropic with hardening and hysteretic characteristics, described by idealized constitutive curves; representation of surfactant mechanical response is also taken using idealized hysteretic constitutive curves.
Geometric hysteresis
The principal contribution of our model is in the quantitative fractionation of geometric hysteresis among the stress hysteretic behavior of smooth muscle and surfactant.
Mechanical response of the alveolar duct internal architecture during duct expansion and relaxation cycles is determined as a result of the superposition effects between: a) hardening character – nonlinear increase of stiffness with deformation - of the septal tissue (Fig. 2a); hardening and hysteretic characteristic of the ring two-component material (Figs. 2b,c); and hysteretic character of the surfactant (Fig. 2d).
During breathing cycles the ducts harmonically expand & extend and then come back to the initial (undeformed) configuration, producing deformation of internal architecture. The membrane and ring, used in our model as the structural elements of the duct interior, deform over cycles. Surfactant, which covers the tissue, changes its surface area (as the septal area changes) and produces a distributed loading on the tissue due to surface tension at the liquid-tissue interface. The surface tension has a hysteretic character and therefore the loading within a cycle is hysteretic: The surface tension is higher during inspiration than during expiration (Fig. 2d), thus it tends to produce larger deformation, hence larger radial displacements during inspiration. Therefore, an amount of surface area change due to surfactant force tends to be more pronounced in inspiration than in expiration.
On the other hand, the muscle is tensed during inflation and relaxing during deflation. The stresses within the alveolar entrance ring are larger during inspiration (Fig. 2c) so that the alveolar ring muscle produces larger resistance for the septum to deform, and therefore its hysteresis acts in the opposite sense with respect to the surfactant hysteresis. The resulting hysteretic response of the internal duct elements depends on which hysteretic action is dominant at a certain moment within the breathing cycle.
Septal surface – duct volume (S-V) hysteresis
The observation that hysteresis induced by smooth muscle is manifested as a clockwise S-V loop (Fig. 4a) is consistent with the fact that muscle tension is increased during inflation compared with expiration. The structural stiffness is larger during radial expansion of the duct during inflation, promoting an increased area of the radial septa relative to that at the same volume during expiration. Thus, the net effect results in a clockwise rotation in the S-V loop. By contrast, surface tension hysteresis has the opposite effect. Septal surface tension at the air-liquid interface acts to retract the duct radially outward. Therefore, the sharply increased surface tension of surfactant during its areal expansion phase of inspiration compared with the low surface tension during areal compression in expiration implies an increased septal radial expansion associated with decreased area during inspiration compared with expiration. This results in a counterclockwise rotation in the S-V loop.
We express the overall geometric hysteresis by the index ηgeomgiven by the ratio of (signed) geometric loop area to the bounding rectangle area of the surface area - volume relationship (Fig 5, cartoon). Under the physiologically realistic conditions when both muscle and surfactant effects are present, the S-V loop exhibits a combination of the two extreme cases described above, sometimes resulting in a complex pattern, such as a figure “8” (Fig. 4b) depending on the different histories/combinations of muscle and surfactant contributions. Interestingly, the S-V hysteresis due to these competing elements are counterbalanced at a muscle fraction of approximately 0.72; resulting in no overall geometric hysteresis (ηgeom = 0). In addition to the global index of hysteresis given by ηgeom through the area history), we note that our technique here also gives unambiguous predictions about the history of local material points as well, in particular, the irreversible trajectories of the boundary surfaces of the alveolar duct (Fig. 7).
Finally, it is important to note that the complex interplay between the two hysteretic components described above was observed in experiments. Miki et al. (1993) found that geometric hysteresis does exist, albeit small in magnitude, in live adult rabbits. Quantitatively, they found that, at isovolume points during tidal breathing, the fractional change in optical mean free path for diffuse light scattering was roughly −.16 (using the opposite sign convention from here). Using the approximate inverse quadratic dependence of mean free path on surface to volume ratio, and using the relationship between hysteresis measured as fractional differences at isovolume points and the loop area ratios, their results translate into a geometric hysteresis index of ηgeom ≈ + 0.06. This value is strikingly close to the limiting value that we compute for essentially complete domination of geometric hysteresis by surface tension behavior of surfactant, with little role for smooth muscle. By contrast, Miki et al. (1993) also found loop reversals when the animals were challenged with the contractile agonist methacholine. In that circumstance, their results translate to a geometric hysteresis index of ηgeom ≈ − 0.05, indicating that in this case there is a substantial contribution from activated smooth muscle, of a comparable but larger magnitude (the loop is reversed) compared with the contribution from surfactant.
The role of smooth muscle at the alveolar level
The role of smooth muscle in lung mechanics has been extensively studied at the level of airways in the bronchial tree, especially in the context of asthma. Less is known, however, about the quantification and role of smooth muscle in the alveolated duct (but see 14,41,56). Statically, it is believed to play a role in maintaining alveolar microarchitecture (e.g., Smith and Stamenovic 1986, Stamenovic and Smith 1986), but its contribution to geometric hysteresis in compensating for that associated with surfactant has not been probed. Here we have made a first attempt to address this question. On the other hand, while we are confident of the extremes we have computed for the displacements and surface-volume relationship, we note that serious caution must be exercised with respect to the quantification in terms of muscle fraction m. (Note that the value of m appears to be species dependent; for instance, guinea pigs apparently have more muscle than other small animals (41).) Not only is the morphometric distribution of m given by a limited database, but it is largely unknown how to translate such morphometric measurements directly into stress bearing implications. We thus suggest interpreting numerical values of m as a functional index of the contribution to mechanical equilibrium in the duct.
Hysteresis in Radial Displacements
The asymmetry in radial displacements with respect to inspiration vs. expiration (Fig. 6), and the hysteretic trajectories (Fig. 7) found in this study result in asynchronous motion of the surfaces of the acinar structure. This has an important consequence. Because the surfaces of the acinar structural element represent the boundaries of the air domain in the alveolar microstructure, its motion is directly coupled to air flow. Especially, its asynchronous motion induces aerosol mixing and deposition deep in the lung.
These asynchronous motion of the acinar structure are results of the effects of hystereses of surfactant and muscle. We present results for the two extreme conditions corresponding to m = 0 (no muscle constituent within the alveolar entrance ring) and m = 1 (only muscle constituent, with no connective tissue); all other cases will fall between these two extremes. It is interesting to note that the hysteretic effects of the surfactant and muscle content tend to cancellation.
The effects of geometric hysteresis on acinar flow
The effects of geometric hysteresis on acinar fluid mechanics, consequently aerosol mixing and deposition are substantial; such a phenomenon has been demonstrated previously (8, 21–25, 50–55). In particular, the presence of geometric hysteresis is crucial in the case when an alveolar flow exhibits recirculation because it can break alveolar flow into chaos (e.g., 50,54). In this regard, the occurrence, rather than its extent, of geometric hysteresis is important as a source of perturbation (54). The detailed discussion regarding the onset of chaos in the pulmonary acinus is beyond the scope of this paper; such a discussion can be found elsewhere (Tsuda et al., 2011a,b).
Summary
In this study, we probed the origins of geometric hysteresis at the level of the pulmonary acinus. We used realistic experimental relationships for the constitutive laws of parenchymal tissue, smooth muscle, and surfactant in a Wilson-Bachofen type model of the alveolar duct. With finite element techniques, we solved for the resulting behavior during vital capacity maneuvers, focusing especially on the displacement hysteresis and the surface area – volume history dependence. We found striking agreement between our results in the area - volume hysteresis and the magnitude of geometric hysteresis observed by Miki et al. (1993), including hysteretic loop reversal phenomena with smooth muscle stimulation by contractile agonist. These results, including quantified hysteresis in displacements and local irreversibility of the boundary surfaces of the duct, are important not only for elucidating acinar micromechanics but also for forming the foundation for coupling local hysteretic boundary motion with irreversible acinar flow fields, which in turn are important mechanistic contributors to aerosol mixing and deposition deep in the lung.
ACKNOWLEDGEMENT
This study was supported by NIH Grants HL054885, HL070542 and HL074022; and by Grants: ON 174028 and III 41007, Ministry of Education and Science of Serbia.
APPENDIX
Finite Element Model of Duct and Computational Procedure
Basic Equations
The basic steps of the numerical procedure are as follows. By applying the principle of virtual work, the equilibrium equations are derived for a finite element at some current state of deformation, with appropriate linearizations due to geometric and material nonlinearities (6,30,32). These equations are combined to obtain the equilibrium equations for the whole FE model. The matrix form of equilibrium equation for a finite element in an incremental-iterative solution procedure is, at fixed volume (indexed by time),
| (A1) |
where Κ(i−1) is the element stiffness matrix, ΔU(i) is the change in nodal point displacements at the ith iteration, Fext is the vector of external forces, and is the internal element nodal force vector. Note that ΔU(i) is determined by the stiffness and internal forces at iteration i-1. Iterations continue until the differences of external and internal forces are smaller than a selected error tolerance (at which the displacement increments become correspondingly small).
The solution accuracy depends on the accuracy of the calculation of internal forces (30,32). These are given, for each i, by
| (A2) |
where is the matrix relating the strain increments and increments of nodal displacements, and T denotes matrix transpose. σ(i) is the stress tensor, and the integration is performed over the FE volume V(i). The stresses are calculated at material points of tissue and surfactant, following the corresponding constitutive law which is represented by a material model (Fig. 2). Values of the stresses at any time step (equivalently, any volume step) depend on the current state of deformation (Fig. A1).
Figure A1.
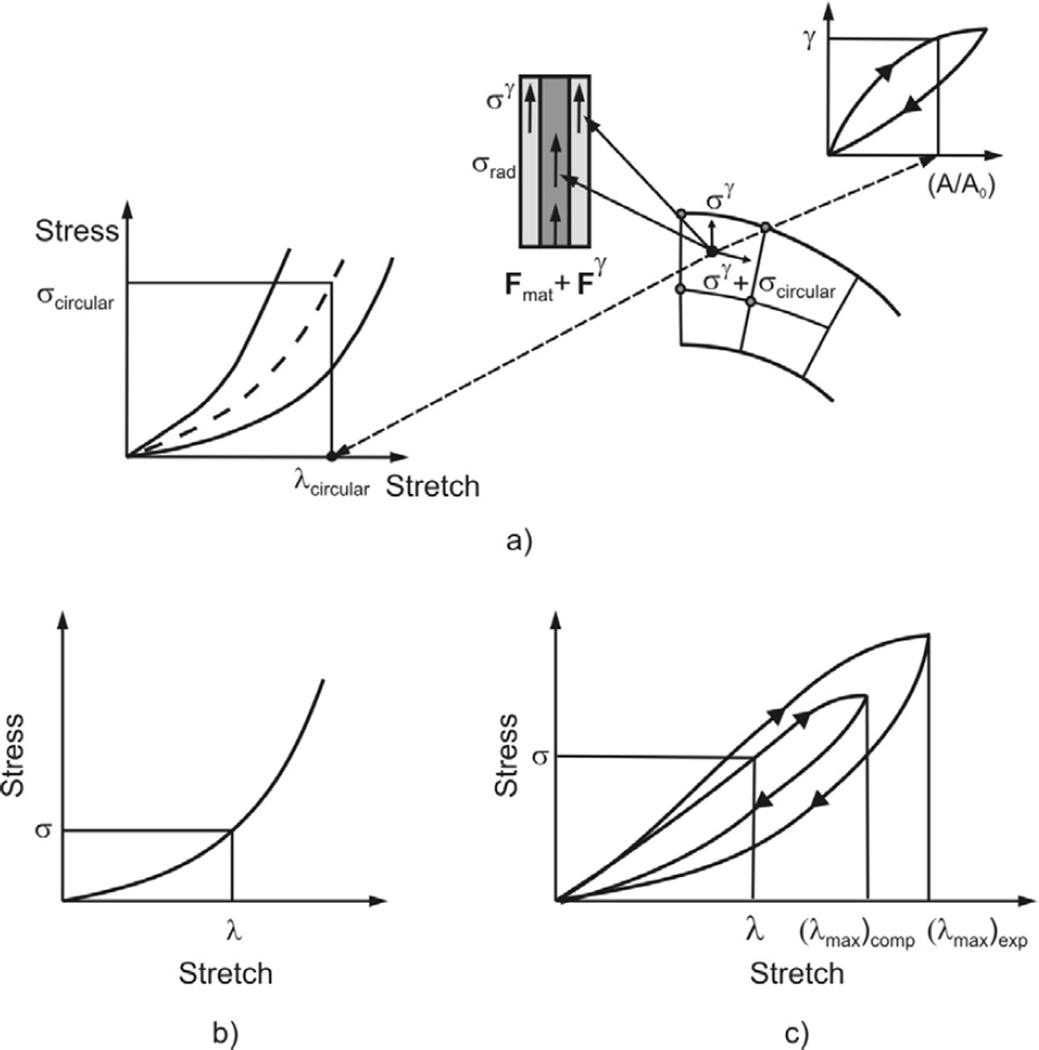
Sketch of stress calculation. Stresses correspond to the previous iteration (indexed by i-1 in equation A1). a) At each material point of the radial septum the stress is represented as a sum of the stresses due to material deformation (radial stress σrad and circumferential stress σcircular) and due to surfactant σγ. These stresses are evaluated from constitutive laws for material (biaxial model) and surfactant (hysteretic model). The stresses produce the finite element nodal forces Fint = Fmat + Fγ entering the equilibrium equations for the finite element assemblage. b) and c) Stresses within the ring evaluated for nonlinear elastic and hysteretic material models.
Stress Calculation
The stress calculation at a material point of septum is graphically shown in Fig. A1a and corresponds to the previous iteration’s configuration. The septum is biaxially stretched during duct deformation, and the circumferential and radial stresses are evaluated using the biaxial material model shown in Fig. 2b. Besides the stresses due to material deformation we have the stress due to surfactant. This is expressed by surface tension γ (as a force per unit length), but it also can be represented by the stress σγ (=2γ / δ, where δ is the septum thickness) acting at each material point of tissue. It is assumed that the stress tensor σγ is isotropic, and hence has the same value σγ in all directions within the surfactant surface. Therefore, the total radial and circumferential stresses used for calculation of nodal forces are represented by sum of stress due to material deformation (σrad and σcircular) and the stress σγ.
For the entrance ring modeling we follow experimental results which show that the ring consists of connective tissue and smooth muscle, with material characteristics and hysteretic constitutive law shown in Figs. 2a and 2c. If the volumetric ratio of muscle, or the relative muscle volume, is m = Vm / Vring, where Vm and Vring are the volumes of muscle and ring, then the stress σring in the direction normal to the ring cross-section is
| (A3) |
where σmuscle and σtissue are stresses within the muscle and connective tissue, respectively. For any given stretch of ring, the stresses σmuscle and σtissue are evaluated from the constitutive laws as schematically shown in Fig. A1b and A1c. The stress σγ is added to stress σring to calculate the nodal forces according to equation (A2).
Computational details for stress evaluation for all material models and surfactant are given in Kojic et al. (2006, 2008).
Finite Element Model Verification
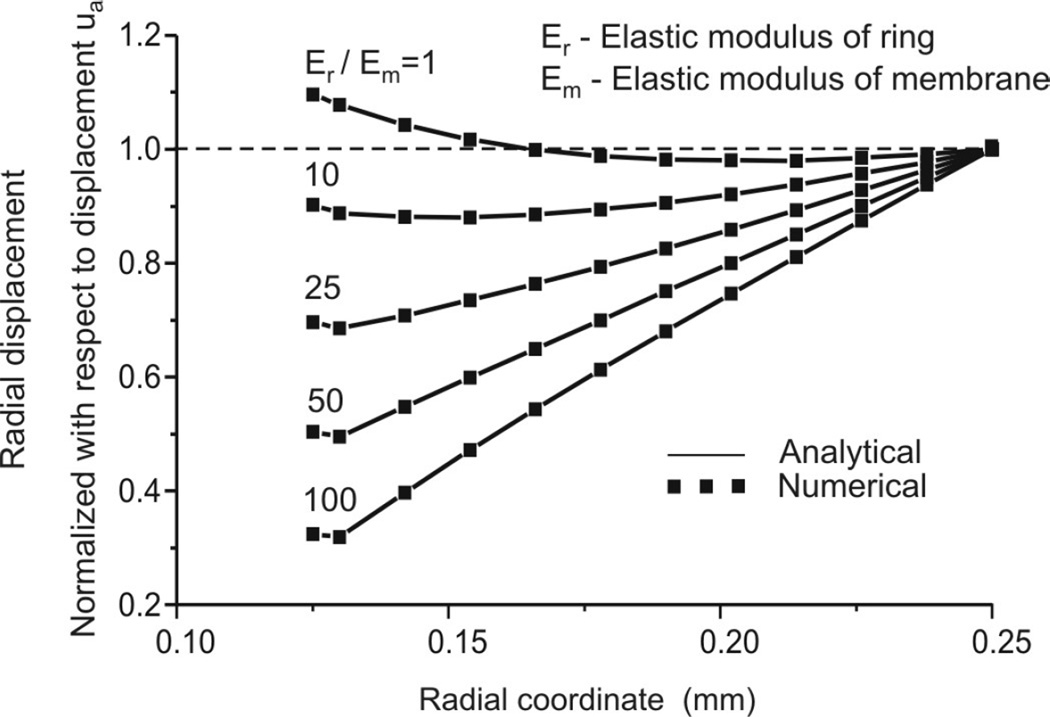
Although finite element methodology is well established and confirmed, even for very complex nonlinear problems, for the sake of completeness we give here a comparison of analytical solutions (37) and our numerical solutions obtained with the FE package PAK (29). Figure A2 shows agreement between analytical and FE solutions for distributions of radial displacements in case of linear elastic material models for ring and septum, for several values of Young’s modulus ratios.
Figure A2.
Validation of methodology: Comparison of analytic and finite element solutions for distribution of radial displacements along the radius.
REFERENCES
- 1.Ardila R, Horie Y, Hildebrandt J. Macroscopic isotropy of lung expansion. Respir. Physiol. 1974;20:105–115. doi: 10.1016/0034-5687(74)90100-5. [DOI] [PubMed] [Google Scholar]
- 2.Bachofen H, Hildebrandt J, Bachofen M. Pressure-volume curves of air and liquid-filled lungs. Surface tension in situ. J. Appl. Physiol. 1970;29:422–431. doi: 10.1152/jappl.1970.29.4.422. [DOI] [PubMed] [Google Scholar]
- 3.Bachofen H, Hildebrandt J. Area analysis of pressure-volume hysteresis in mammalian lungs. J. Appl. Physiol. 1971;30(4):493–497. doi: 10.1152/jappl.1971.30.4.493. [DOI] [PubMed] [Google Scholar]
- 4.Bachofen HP, Gehr P, Weibel ER. Alterations of mechanical properties and morphology in excised rabbit lungs rinsed with detergent. J. Appl. Physiol: Respirat. Environ. Excercise Physiol. 1979;47:1002–1010. doi: 10.1152/jappl.1979.47.5.1002. [DOI] [PubMed] [Google Scholar]
- 5.Bachofen HP, Schurch H. Alveolar surface forces and lung architecture. Comp. Biochem. Physiol. Part A. 2001;129:183–193. doi: 10.1016/s1095-6433(01)00315-4. [DOI] [PubMed] [Google Scholar]
- 6.Bathe, J K. Finite Element Procedures. Englewood Cliffs: Prentice-Hall; 1996. [Google Scholar]
- 7.Budiansky B, Kimmel E. Elastic moduli in lungs. J. Appl. Mech. Trans. ASME. 1987;54:351–358. [Google Scholar]
- 8.Butler JP, Tsuda A. Logistic trajectory maps and aerosol mixing due to asynchronous flow at airway bifurcations. Respir. Physiol. Neurobiol. 2005;148:195–206. doi: 10.1016/j.resp.2005.06.001. [DOI] [PubMed] [Google Scholar]
- 9.Dale PJ, Matthews FL, Shroter RC. Finite element analysis of lung alveolus. J. Biomechanics. 1980;13:865–873. doi: 10.1016/0021-9290(80)90174-8. [DOI] [PubMed] [Google Scholar]
- 10.Denny E, Schroter RC. The mechanical behavior of mammalian lung alveolar duct model. J. Biomech. Engrg. Trans. ASME. 1995;117:254–261. doi: 10.1115/1.2794178. [DOI] [PubMed] [Google Scholar]
- 11.Denny E, Schroter RC. Relationships between alveolar size and fibre distribution in a mammalian lung alveolar duct model. J. Biomech. Engrg. Trans. ASME. 1997;119:289–297. doi: 10.1115/1.2796093. [DOI] [PubMed] [Google Scholar]
- 12.Denny E, Schroter RC. Viscolelastic behavior of a lung alveolar duct model. J. Biomech. Engrg. Trans. ASME. 2000;122:143–151. doi: 10.1115/1.429644. [DOI] [PubMed] [Google Scholar]
- 13.Denny E, Schroter RC. A model of non-uniform lung parenchyma distortion. J. Biomech. 2006;39:652–663. doi: 10.1016/j.jbiomech.2005.01.010. [DOI] [PubMed] [Google Scholar]
- 14.Dickie R, Wang YT, Butler JP, Schulz H, Tsuda A. Distribution and quantity of contractile tissue in postnatal development of rat alveolar interstitium. Anatomical Record: Advances in Integrative Anatomy and Evolutionary Biology. 2008;291(1):83–93. doi: 10.1002/ar.20622. [DOI] [PubMed] [Google Scholar]
- 15.Fredberg JJ, Stamenovic D. On the imperfect elasticity of lung tissue. J. Appl. Physiol. 1989;67(6):2408–2419. doi: 10.1152/jappl.1989.67.6.2408. [DOI] [PubMed] [Google Scholar]
- 16.Fukaya H, Martin CJ, Young AC, Katsura S. Mechanical properties of alveolar walls. J. Appl. Physiol. 1968;25(6):689–695. doi: 10.1152/jappl.1968.25.6.689. [DOI] [PubMed] [Google Scholar]
- 17.Fung YC. Biomechanics – Motion, Flow, Stress, and Growth. New York: Springer-Verlag; 1990. [Google Scholar]
- 18.Gil J, Weibel ER. Morphological study of pressure-volume hysteresis in rat lungs fixed by vascular perfusion. Resp. Physiol. 1972;15:190–213. doi: 10.1016/0034-5687(72)90098-9. [DOI] [PubMed] [Google Scholar]
- 19.Gil J, Bachofen H, Gehr P, Weibel ER. Alveolar volume-surface area relation in air- and saline-filled lungs fixed by vascular perfusion. J. Appl. Physiol: Respirat. Environ. Excercise Physiol. 1979;47(5):990–1001. doi: 10.1152/jappl.1979.47.5.990. [DOI] [PubMed] [Google Scholar]
- 20.Gunst SJ. Contractile force of canine airway smooth muscle during cyclical length changes. J. Appl. Physiol: Respirat. Environ. Excercise Physiol. 1983;55(3):759–769. doi: 10.1152/jappl.1983.55.3.759. [DOI] [PubMed] [Google Scholar]
- 21.Haber S, Butler JP, Brenner H, Emanuel I, Tsuda A. Flow field in self-similar expansion on a pulmonary alveolus during rhythmical breathing. J. Fluid Mech. 2000;405:243–268. [Google Scholar]
- 22.Haber S, Yitzhak D, Tsuda A. Gravitational deposition in a rhythmically expanding and contracting alveolus. J. Appl. Physiol. 2003;95:657–671. doi: 10.1152/japplphysiol.00770.2002. [DOI] [PubMed] [Google Scholar]
- 23.Haber S, Tsuda A. Cyclic model for particle motion in the pulmonary acinus. J. Fluid Mech. 2006;567:157–184. [Google Scholar]
- 24.Henry FS, Butler JP, Tsuda A. Kinematically irreversible flow and aerosol transport in the pulmonary acinus: a departure from classical dispersive transport. J. Appl. Physiol. 2002;92:835–845. doi: 10.1152/japplphysiol.00385.2001. [DOI] [PubMed] [Google Scholar]
- 25.Henry FS, Laine-Pearson FE, Tsuda A. Hamiltonian chaos in a model alveolus. ASME J. Biomech. Eng. 2009;131(1):011006. doi: 10.1115/1.2953559. [DOI] [PubMed] [Google Scholar]
- 26.Hildebrandt J, Fukaya H, Martin CJ. Stress-strain relations of tissue sheets undergoing uniform two-dimensional stretch. J. Appl. Physiol. 1969;27(5):758–762. doi: 10.1152/jappl.1969.27.5.758. [DOI] [PubMed] [Google Scholar]
- 27.Ingenito EP, Mark L, Morris J, Espinosa FF, Kamm RD, Johnson M. Biophysical chracterization and modeling of lung surfactant components. J. Appl. Physiol. 1999;86(5):1702–1714. doi: 10.1152/jappl.1999.86.5.1702. [DOI] [PubMed] [Google Scholar]
- 28.Kimmel E, Budiansky B. Surface tension and the dodecahedron model for lung elasticity. J. Bioemd. Engrg. Trans. ASME. 1990;112:160–167. doi: 10.1115/1.2891167. [DOI] [PubMed] [Google Scholar]
- 29.Kojic M, Slavkovic R, Zivkovic M, Grujovic N, Filipovic N. PAK-Finite Element Program for Linear and Nonlinear Analysis. Kragujevac, Serbia: Mech. Eng. Dept. Univ. Kragujevac; 1998. [Google Scholar]
- 30.Kojic M, Bathe KJ. Inelastic Analysis of Solids and Structures. Berlin: Springer; 2005. [Google Scholar]
- 31.Kojic M, Vlastelica I, Stojanovic B, Rankovic V, Tsuda A. Stress integration procedures for a biaxial isotropic material model of biological membranes and hysteretic models of muscle fibers and surfactant. Int. J. Num. Meth. Engrg. 2006;68:893–909. [Google Scholar]
- 32.Kojic M, Filipovic N, Stojanovic B, Kojic N. Computer Modeling in Bioengineering – Theoretical Background, Examples and Software. Chichester: J. Wiley and Sons; 2008. [Google Scholar]
- 33.Kowe R, Schroter RC, Matthews FL, Hitchings D. Analysis of elastic and surface tension effects in the lung alveolus using finite element methods. J. Biomechanics. 1986;19(7):541–549. doi: 10.1016/0021-9290(86)90127-2. [DOI] [PubMed] [Google Scholar]
- 34.Krueger MA, Gaver DP., III A theoretical model of pulmonary surfactant multilayer collapse under oscillating area conditions. J. Colloid. Interf. Sc. 2000;229:335–364. doi: 10.1006/jcis.2000.7029. [DOI] [PubMed] [Google Scholar]
- 35.Lee CG, Hoppin FG., Jr . Lung elasticity. In: Fung YC, Perrone N, Anliker M, editors. Biomechanics – Its Foundations and Objectives. Englewood Cliffs: Prentice-Hall; 1972. pp. 317–335. [Google Scholar]
- 36.Matsuda M, Fung YC, Sobin SS. Collagen and elastin fibers in human pulmonary alveolar mouths and ducts. J. Appl. Physiol. 1987;63(3):1185–1194. doi: 10.1152/jappl.1987.63.3.1185. [DOI] [PubMed] [Google Scholar]
- 37.Mijailovic S. Private communication. 2003 [Google Scholar]
- 38.Miki H, Butler JP, Roger RA, Lehr JL. Geometric hysteresis in pulmonary surface-to-volume ratio during tidal breathing. J. Appl. Physiol. 1993;75(4):1630–1636. doi: 10.1152/jappl.1993.75.4.1630. [DOI] [PubMed] [Google Scholar]
- 39.Oldmixon EH, Butler JP, Hoppin FG., Jr Lengths and topology of alveolar septal borders. J. Appl. Physiol. 1989;67(5):1930–1940. doi: 10.1152/jappl.1989.67.5.1930. [DOI] [PubMed] [Google Scholar]
- 40.Oldmixon EH, Hoppin FG., Jr Distribution of elastin and collagen in canine lung alveolar parenchyma. J. Appl. Physiol. 1989;67(5):1941–1949. doi: 10.1152/jappl.1989.67.5.1941. [DOI] [PubMed] [Google Scholar]
- 41.Oldmixon EH, Carlsson K, Kuhn C, III, Butler JP, Hoppin FG., Jr α-Actin: disposition, quantities, and estimated effects on lung recoil and compliance. J. Appl. Physiol. 2001;91:459–473. doi: 10.1152/jappl.2001.91.1.459. [DOI] [PubMed] [Google Scholar]
- 42.Sakai H, Ingenito EP, Mora R, Abbay S, Cavalcante FS, Lutchen KR, Suki B. Hysteresivity of the lung and tissue strip in the normal rat: Effects of heterogeneities. J Appl Physiol. 2001;91:737–747. doi: 10.1152/jappl.2001.91.2.737. [DOI] [PubMed] [Google Scholar]
- 43.Sasaki H, Hoppin FG., Jr Hysteresis of contracted airway smooth muscle. J. Appl. Physiol: Respirat. Environ. Excise Physiol. 1979;47(6):1251–1262. doi: 10.1152/jappl.1979.47.6.1251. [DOI] [PubMed] [Google Scholar]
- 44.Schürch S, Bachofen H, Goerke J, Green F. Surface properties of rat pulmonary surfactant studied with the captive bubble method: Adsorption, hysteresis, stability. Biochim Biophys Acta. 1992;1103:127–136. doi: 10.1016/0005-2736(92)90066-u. [DOI] [PubMed] [Google Scholar]
- 45.Schurch S, Bachofen H, Possmayer F. Surface activity in situ, in vivo, and in captive bubble surfactometer. Comp. Biochem. Physiol. Part A. 2001;129:195–207. doi: 10.1016/s1095-6433(01)00316-6. [DOI] [PubMed] [Google Scholar]
- 46.Shen H, Wu MF, Tepper RS, Gunst SJ. Mechanisms for the mechanical response of airway smooth muscle to length oscillation. J. Appl. Physiol. 1997;83(3):731–738. doi: 10.1152/jappl.1997.83.3.731. [DOI] [PubMed] [Google Scholar]
- 47.Smith JC, Stamenovic D. Surface forces in lungs. I. Alveolar surface tension-lung volume relationships. J. Appl. Physiol. 1986;60(4):1341–1350. doi: 10.1152/jappl.1986.60.4.1341. [DOI] [PubMed] [Google Scholar]
- 48.Stamenovic D, Smith JC. Surface forces in lungs. II. Microstructural mechanics and lung stability. J. Appl. Physiol. 1986;60(4):1351–1357. doi: 10.1152/jappl.1986.60.4.1351. [DOI] [PubMed] [Google Scholar]
- 49.Suki B, Barabási AL, Lutchen KR. Lung tissue viscoelasticity: a mathematical framework and its molecular basis. J Appl Physiol. 1994;76(6):2749–2759. doi: 10.1152/jappl.1994.76.6.2749. [DOI] [PubMed] [Google Scholar]
- 50.Tsuda A, Henry FS, Butler JP. Chaotic mixing of alveolated duct flow in rhythmically expanding pulmonary acinus. J. Appl. Physiol. 1995;79(3):1055–1063. doi: 10.1152/jappl.1995.79.3.1055. [DOI] [PubMed] [Google Scholar]
- 51.Tsuda A, Otani Y, Butler JP. Acinar flow irreversibility caused by boundary perturbation of reversible alveolar wall motion. J. Appl. Physiol. 1999;86(3):977–984. doi: 10.1152/jappl.1999.86.3.977. [DOI] [PubMed] [Google Scholar]
- 52.Tsuda A, Rogers RA, Hydon PE, Butler JP. Chaotic mixing deep in the lung. Proc. Natl. Acad. Sci. USA. 2002;99:10173–10178. doi: 10.1073/pnas.102318299. [DOI] [PMC free article] [PubMed] [Google Scholar]
- 53.Tsuda A, Henry FS, Butler JP. Gas and aerosol mixing in the acinus. Respir. Physiol. Neurobiol. 2008;163(1–3):139–149. doi: 10.1016/j.resp.2008.02.010. [DOI] [PMC free article] [PubMed] [Google Scholar]
- 54.Tsuda A, Laine-Pearson FE, Hydon PE. Why Chaotic mixing of particles is inevitable in the deep lung. J. Theor. Biol. 2011a;286:57–66. doi: 10.1016/j.jtbi.2011.06.038. [DOI] [PMC free article] [PubMed] [Google Scholar]
- 55.Tsuda A, Henry FS, Butler JP. Particle transport and deposition. In: Fredberg J, Sieck G, Gerthoffer W, editors. Comprehensive Physiology, Respiratory Physiology Section. Amer. Physiol. Soc.; 2011b. in press. [Google Scholar]
- 56.Weibel ER, Gil J. Alveolar structure-function relationships. In: West JB, editor. Bioengineering Aspects of the Lung. New York: Marcel Dekker; 1977. [Google Scholar]
- 57.Weibel ER. Functional morphology of lung parenchyma. In: Fishman AP, editor. Handbook of Physiology, The Respiratory System. Bethesda, MD: Am. Physiol. Soc.; 1986. pp. 89–111. Sect. 3, vol III, Chapt. 8. [Google Scholar]
- 58.Wilson TA. Surface tension-surface area curves calculated from pressure-volume loops. J. Appl. Physiol: Respirat. Environ. Excercise Physiol. 1982;53(6):1512–1520. doi: 10.1152/jappl.1982.53.6.1512. [DOI] [PubMed] [Google Scholar]
- 59.Wilson TA, Bachofen H. A model for mechanical structure of alveolar duct. J. Appl. Physiol: Respirat. Environ. Excercise Physiol. 1982;52(4):1064–1070. doi: 10.1152/jappl.1982.52.4.1064. [DOI] [PubMed] [Google Scholar]
- 60.Yuan H, Westwick DT, Ingenito EP, Lutchen KR, Suki B. Parametric and nonparametric nonlinear system identification of lung tissue strip mechanics. Ann Biomed Eng. 1999;27(4):548–562. doi: 10.1114/1.217. [DOI] [PubMed] [Google Scholar]


