

Abstract
Sudden changes in the acoustic environment enhance perceptual processing of subsequent visual stimuli that appear in close spatial proximity. Little is known, however, about the neural mechanisms by which salient sounds affect visual processing. In particular, it is unclear whether such sounds automatically activate visual cortex. To shed light on this issue, the present study examined event-related brain potentials (ERPs) that were triggered either by peripheral sounds that preceded task-relevant visual targets (Experiment 1) or were presented during purely auditory tasks (Experiments 2, 3, and 4). In all experiments the sounds elicited a contralateral ERP over the occipital scalp that was localized to neural generators in extrastriate visual cortex of the ventral occipital lobe. The amplitude of this cross-modal ERP was predictive of perceptual judgments about the contrast of co-localized visual targets. These findings demonstrate that sudden, intrusive sounds reflexively activate human visual cortex in a spatially specific manner, even during purely auditory tasks when the sounds are not relevant to the ongoing task.
The number of objects within our field of view typically exceeds our capacity to recognize and remember them. Observers often deal with this surfeit of information by attending to specific regions of the visual field (Carrasco, 2011; Reynolds & Chelazzi, 2004). Although attention can be deployed voluntarily, the ability to orient attention reflexively to sudden environmental events is also essential for survival (Itti & Koch, 2001; Wright & Ward, 2008). Sudden sounds are especially effective at capturing attention (Näätänen, 1992), and in natural settings, observers tend to move their eyes reflexively towards an unexpected sound in order to visualize its source. In the laboratory, a salient auditory cue can enhance the perceptual and neural processing of a subsequent, co-localized visual stimulus even when observers do not move their eyes – that is, when attention is oriented to the sound source covertly (Frassinetti et al., 2002; McDonald et al., 2000, 2003, 2005; Störmer et al., 2009b; reviewed in McDonald et al. 2012).
The modulatory influence of spatially nonpredictive auditory cues on visual perception has been well documented, but there has been considerable debate about how such cross-modal influences are established in the human brain (e.g., see McDonald et al., 2001; Macaluso, Frith, & Driver, 2001). Specifically, it is unknown whether salient sounds affect vision by automatically activating neurons in the visual cortex or by influencing neurons in multisensory convergence zones (e.g., in parietal cortex). Auditory-evoked occipital activations have been reported (Cate et al., 2009; Wu et al., 2007), but those activations were contingent on the engagement of voluntary attention mechanisms – the occipital activations were absent when participants did not actively attend to the sounds.
The present study used electrophysiological recordings to investigate whether salient sounds activate visual cortex automatically, even when those sounds do not convey task-relevant information. In Experiment 1, a spatially non-predictive auditory cue was presented prior to the appearance of a pair of sinusoidal visual gratings (Gabors), one at the cued location and the other on the opposite side of fixation. The participants’ task was to judge which of the two Gabors was higher in contrast. Previously, we showed that observers perceived the Gabor at the cued location as being higher in contrast, even when the physical contrasts of the two Gabors were identical (Störmer et al., 2009b). In the present study, we examined the event-related brain potentials (ERPs) elicited by the auditory cues themselves to determine whether such salient but spatially uninformative sounds would activate visual cortex, and whether this activation would be predictive of the perceptual contrast enhancement. Surprisingly, we found clear evidence for activation of visual cortex contralateral to the sound’s location, not only in the visual-target task (Experiment 1) but also in unimodal auditory tasks in which no visual stimuli were presented and the salient, activating sounds were irrelevant to task performance (Experiments 2, 3 and 4). These results provide direct evidence that the cross-modal connectivity of the human brain enables even irrelevant sounds to activate the visual cortex over a precisely timed interval.
MATERIALS AND METHODS
The Human Research Protections Program of the University of California San Diego approved all experimental procedures.
Participants
A total of 44 neurologically healthy observers participated in the study after giving informed consent. Data from four participants were excluded due to excessive EEG artifacts (affecting 30% of trials or more). Of the remaining 40 participants (23 female, age range of 19–32 years), 16 participated in Experiment 1, 12 participated in Experiment 2, and 12 participated in both Experiments 3 and 4. None of the participants from Experiment 1 (with visual targets) participated in any of the follow-up auditory experiments. All participants reported normal or corrected-to-normal vision and normal hearing.
Stimuli and apparatus
The experiments were conducted in a dimly lit, electrically shielded sound booth. Auditory stimuli were 83-ms bursts of pink noise (0.5–15kHz, 78dB SPL) delivered in stereo from a pair of loudspeakers mounted to the sides of a computer monitor. A small black cross (0.5° × 0.5°) at the center of an otherwise uniformly gray background served as a fixation point. The luminance of the display background was 10 cd/m2. Only the light from the computer monitor illuminated the sound booth.
In Experiment 1, the auditory stimuli were presented in stereo such that they appeared to emanate from locations 25° to the left or right of fixation. These served as attention-capturing peripheral cues. Visual target displays consisted of a simultaneous pair of Gabor patches (sinusoidal gratings enveloped by a Gaussian; 2 s.d.; 8° × 8°; 1 cpd), one presented 25° to the left of fixation and the other presented 25° to the right. For each target display, one of the Gabor patches was oriented horizontally and the other was oriented vertically. The contrast of one Gabor patch was fixed at 22% (standard) and the contrast of the other Gabor patch (test) varied between five log-increment levels (6% to 79% contrast).
Auditory targets were used in place of the visual targets in the remaining experiments. In Experiments 2 and 3, a pair of auditory targets was presented 25° to the left and right of fixation in rapid succession (8 ms inter-stimulus interval). One of the targets was a 2100-Hz tone and the other target was a 315-Hz tone. Each tone was 53 ms in duration, including 5-ms rise/fall times. The 2100-Hz (standard) tone was fixed at 68 dB SPL, and the 315-Hz (test) tone was 61, 66, 68, 70, or 73 dB SPL. To adjust for apparent loudness differences between high and low frequency tones, each participant adjusted the loudness of the 68 dB 315-Hz tones to be equally loud as the 2100-Hz tones prior to the experiment with a matching procedure. In Experiment 4, a single 1000-Hz target tone was delivered with equal intensity from both speakers so that it was perceived at the center of the visual display.
Procedure
The procedures for Experiment 1 were described fully elsewhere (Störmer et al., 2009b). Briefly, a spatially nonpredictive auditory cue (83-ms noise burst) was presented from the left or right after a variable inter-trial interval (ITI) of 1,890–2,390 ms. On two-thirds of the trials, a bilateral visual-target display (left and right Gabor patches) was presented after a 150-ms cue-target SOA. Participants were instructed to maintain eye fixation on the central cross and to indicate the orientation (vertical vs. horizontal) of the Gabor patch that appeared to be higher in contrast by pressing an upper or lower button on a game pad device. The contrast of the test patch was lower than the standard contrast (6% or 13%; on 16.7% of the trials), equal to the standard contrast (22%; on 33.3% of the trials), or higher than the standard contrast (37% or 78%; on 16.7% of the trials). The side of the auditory cue was randomized and did not predict which of the two targets was higher in contrast. The visual-target display was omitted or presented after a longer (630-ms) cue-target SOA on one-third of the trials to allow recording of the ERP to the cue separately from the otherwise overlapping ERP to the target. The entire experiment consisted of 15 blocks of 96 trials.
Experiment 2 was similar to Experiment 1 except that a pair of auditory targets was presented in lieu of the visual targets. The same auditory cue (83-ms noise burst) that was used in Experiment 1 was presented on each trial, after a slightly longer ITI (2,400–2,900 ms). The auditory targets were presented on 83.3% of the trials and were absent on 16.7% of trials. On target-present trials, the cue-target SOA was either 150 ms (on 66.7% of all trials) or 630 ms (on 16.7% of all trials). The a priori loudness levels of the left and right target stimuli were equal on half of the target-present trials. On the other half of the target-present trials, the loudness of the test target was lower or higher than that of the standard target. The location of the auditory cue did not predict which of the two target tones was louder. Participants were instructed to maintain eye fixation throughout each block of trials and to indicate the frequency (high vs. low) of the target tone that appeared to be louder in volume by pressing one of two buttons. Response buttons were counterbalanced between participants. All trial types were intermixed randomly.
In Experiments 3 and 4, the irrelevant 83-ms noise bursts and target tones were presented in random order with variable ISIs (2,000–2,500 ms). The proportions of noise bursts and tones were kept the same as in Experiment 2 (approximately 55% and 45%, respectively). Irrelevant noise bursts were presented randomly to the left and right of fixation, and target tones were presented from peripheral locations (Experiment 3) or from a central location (Experiment 4). In Experiment 3, participants were instructed to indicate the frequency (high vs. low) of the louder tone by pressing one of two buttons, just as in Experiment 2 (40% of the tone pairs were equal in a priori loudness). In Experiment 4, participants were required to press a single button each time they heard the central target tone, while ignoring the lateral noise bursts. Each of the experiments consisted of 5 blocks of 128 trials each. The order of Experiments 3 and 4 was counterbalanced across the 12 people who participated in both experiments.
Electrophysiological recordings and analysis
ERPs were recorded in each experiment from 62 tin electrodes using standard recording and analysis procedures reported previously, including rejection of trials contaminated by ocular artifacts (Di Russo et al., 2003; Green et al., 2008). ERPs from artifact-free epochs were averaged and digitally low-pass filtered (−3 dB cutoff at 25 Hz). ERPs to the lateral noise bursts on long-SOA and no-target (catch) trials in Experiments 1 and 2 were combined to create the cue-elicited ERP waveforms. Data from short-SOA trials were discarded from these analyses to avoid contamination of the cue ERPs by overlapping target ERPs. For all experiments the ERPs elicited by the left and right noise bursts were averaged separately and were then collapsed across sound position (left, right) and lateral position of the electrode (left, right) to obtain waveforms recorded contralaterally and ipsilaterally to the sound. Mean amplitudes were measured for each participant with respect to a 100-ms pre-stimulus period at two posterior electrode sites (PO7/PO8) with a measurement window of 260 to 360 ms after the onset of the sound. This window was chosen because the ACOP was near maximum amplitude at occipital sites by 260 ms in each experiment. The resulting mean amplitudes were analyzed in a repeated-measure analysis of variance (ANOVA) with a single factor for electrode lateralization (contralateral vs. ipsilateral relative to the sound location).
Topographical mapping and source analysis
Topographical voltage maps of the ERP waveforms were constructed by spherical spline interpolation (Perrin et al., 1989). To illustrate the scalp distribution of the contralateral positivity generated by the lateral sound, contralateral-minus-ipsilateral voltage differences were calculated for homologous left and right electrodes (e.g., PO7 & PO8). The resulting voltage differences were assigned to electrodes on the right side of the head and were copied to electrodes on the left side of the head after inverting the voltage polarities (antisymmetric mapping; Praamstra et al., 1996). Voltages at midline electrode were set to zero for the now symmetrical maps (Green et al., 2008). Since the maps were perfectly symmetrical, only the non-inverted voltages over the right side of the scalp are displayed here. Topographical maps of the original cue- and target-elicited ERPs were plotted prior to hemispheric subtraction in Experiment 1 to help assess the degree to which the ERPs activity were lateralized. These maps were created by collapsing over left- and right-side cues (or high-contrast target Gabor) and left and right electrodes such that the electrodes on the left and right sides were ipsilateral and contralateral to the eliciting stimulus, respectively.
Anatomical sources of lateralized ERP components were modeled by fitting symmetrical pairs of equivalent current dipoles to the symmetrical voltage maps within specified time intervals (for general dipole-modeling methods, see McDonald et al., 2005). A standardized head model was used for source analysis (BESA 5.3). Source locations were also estimated by distributed linear inverse solutions based on a local auto-regressive average (LAURA; Grave de Peralta Menendez et al., 2004). LAURA estimates three-dimensional current density distributions using a realistic head model with a solution space of 4024 nodes equally distributed within the gray matter of the average template brain of the Montreal Neurological Institute. It makes no a priori assumptions regarding the number of sources or their locations and can deal with multiple, simultaneously active sources. LAURA analyses were implemented using CARTOOL software (http://brainmapping.unige.ch/cartool.php). To visualize the anatomical brain regions giving rise to the different components, the current source distributions estimated by LAURA were transformed into a standardized coordinate system (Talairach & Tournoux, 1988) and projected onto a structural brain image supplied by MRIcro (Rorden & Brett, 2000) using AFNI software (Cox, 1996). The positions of the best-fitting dipoles are shown on the same structural images.
RESULTS
Experiment 1: Sounds that precede visual targets activate visual cortex
On each trial a spatially non-predictive auditory cue was presented to the left or right of fixation, which was followed after a 150-ms SOA by a pair of bilateral visual targets on two-thirds of the trials (Fig. 1a, top). The target pair was omitted or presented after a longer (630-ms) cue-target SOA on one-third of the trials to allow separation of the overlapping ERPs elicited by cues and targets (Fig 1a, middle and bottom). In the present study, we averaged the ERPs elicited by the auditory cues over these long-SOA and no-target trials to track processing of the sound in the absence of a visual stimulus. The psychophysical data showing cue-induced enhancement of brightness contrast on short-SOA trials can be seen in Figure 1 of Störmer et al. (2009b).
Figure 1.

Experimental procedure and results from Experiment 1. (A) Illustration of auditory cue and visual target stimuli on short-SOA, long, SOA, and no-target catch trials. (B) Cue-elicited ERPs recorded over the fronto-central scalp, collapsed over scalp sites ipsilateral and contralateral to the side of stimulation. PAMR = Post-Auricular Muscle Response. (C) Averaged HEOG waveforms associated with left and right noise-burst cues. (D) Voltage topography of the late, lateralized phase of the cue-elicited N1, quantified as the contralateral minus ipsilateral difference amplitude over 120–140 ms. (E) Best-fitting dipole and distributed source activity underlying the lateralized N1 in the 120–140 ms.
As expected, several typical auditory ERP components were observed in the initial 200 ms following cue onset, including the N1 (90–100 ms) over the central scalp and a slightly later N1 (130–150 ms) over bilateral temporal scalp regions (Fig. 1b). These negative ERP components reflect modality-specific sensory processing within the auditory cortex (Picton, 2011). These N1 components were larger over the hemisphere contralateral to the cued location. The timing and amplitude of this lateral asymmetry can be seen in the difference waveform created by subtracting the ipsilaterally recorded ERP from the contralaterally recorded ERP (Fig 1b, dashed line). This lateralized difference started 50 ms after cue onset and peaked at around 150 ms post-cue. An auditory-evoked reflexive myogenic potential originating in the post-auricular muscle located behind each ear can also be seen in the initial 25 ms after stimulus onset (Picton, 2011). Because our EEG channels were referenced to electrodes positioned behind the ears (on the mastoids), this post-auricular muscle response (PAMR) was seen on all EEG channels.
In contrast, ERP waveforms recorded over the posterior scalp contralateral and ipsilateral to the auditory cue did not differ appreciably in the initial 200 ms following stimulus onset, but at around 200 ms the contralateral waveform became more positive than the ipsilateral waveform (Fig. 2a). This posterior contralateral positivity was sustained for over 200 ms and was maximal over the lateral occipital scalp (electrodes PO7/PO8; P < .0002). Consistent with the hypothesis that this occipital positivity elicited by the auditory cue was related to visual perceptual processing, its amplitude correlated significantly across subjects with the perceived contrast of the bilaterally presented Gabors on short-SOA trials (Fig. 2d). Specifically, the contralateral-minus-ipsilateral difference amplitude over 260–360 ms was correlated with the probability of choosing the Gabor patch on the cued side as having a higher contrast on trials where the left and right contrasts were actually equal (r = .51, p < .04). That is, participants with larger contralateral positive amplitudes over the occipital scalp also showed greater tendency to judge the Gabor patch on the cued side as being higher in contrast.
Figure 2.

Cue- and Target-elicited ERPs over the posterior scalp in Experiment 1. (A) ERPs elicited by the noise-burst cue, collapsed over occipital scalp sites ipsilateral and contralateral to the side of stimulation. Shaded area shows interval (260–360 ms) where ACOP was quantified as the contralateral minus ipsilateral difference amplitude. (B) Voltage topography and (C) estimated cortical source of the ACOP (dashed line in A), quantified as the contralateral minus ipsilateral difference amplitude over 260–360 ms. (D) Scatter plots between the perceptual bias and lateralized ERP components to cue (ACOP) and target (P1). The perceptual bias (ordinate) was measured as the difference between the probability of choosing the cued Gabor or the uncued Gabor as being higher in contrast. (E) Visual-target ERPs elicited at occipital sites on trials where one of the target Gabor patches was of maximal contrast (78%) and the standard contrast in the opposite field was 22%. The ERPs on the side contralateral to the 78% patch showed larger and shorter-latency P1 and N1 components than the ERPs on the ipsilateral side. (F) Voltage topography and (G) estimated cortical source of the visual-evoked P1 component shown in D. P1 was quantified as the contralateral minus ipsilateral mean difference amplitude over 110–130 ms.
Two additional checks were performed to buttress this conclusion. First, we sought to identify outliers in ERP amplitude or perceputal bias that might influence the correlation either positively or negatively. The criterion for exclusion was ±2 s.d.s from the respective mean. Critically, no outliers were found. Second, we formed two sub-groups of participants based on a median split of the auditory-evoked contralateral occipital positivity (ACOP) and compared the magnitudes of these groups’ perceptual biases. Consistent with the correlational result, the large-ACOP group was found to have significantly larger perceptual biases than the small-ACOP group, t(15) = 2.28, p = .046.
To isolate the ACOP from other ongoing ERP activity, the ERPs recorded ipsilaterally to the cued location were subtracted from the ERPs recorded contralaterally to the cued location, for all pairs of lateral electrodes (e.g., PO7 and PO8 over left and right occipital scalp; dashed waveform in Fig. 2a). The scalp topography of the resulting voltage differences is displayed in Figure 2b along with a topographical map of the cue-elicited ERP prior to hemispheric subtraction. The pre-subtraction map (Fig 2b, left) shows that activity over the positive scalp was biased toward the contralateral side in the 260–360 ms post-cue time range. The difference-wave map (Fig 2b, right) indicates that the ACOP was maximal over the lateral occipital scalp.
Lateralization coefficients were computed to quantify the degree to which the occipital activity was lateralized with respect to the overall level of ERP positivity in the waveforms. This was accomplished by dividing the contralateral ERP voltage by the average of the contralateral and ipsilateral ERP voltages in the 260–360 ms interval:
The ACOP lateralization coefficient in Experiment 1 was found to be 1.20, which indicates that the amplitude of the ACOP was 20% of the ‘baseline’ bilateral ERP positivity.
To gain information on the cortical sources giving rise to the ACOP we estimated the location of its neural generators using two different source-analysis approaches. First, the neural generators of the ACOP were modeled as a dipolar current source that was fit to the contralateral minus ipsilateral difference topography over the 260–360 ms interval. The best-fitting dipole was situated near the fusiform gyrus of the occipital lobe, Brodmann’s Area 19 (Talairach coordinates: x = ± 30, y = −73, z = −17; Fig 2c). This occipital dipole accounted for 91.8% of the scalp topography variance over the 260–360 ms fitting interval. Adding a dipole in the superior temporal lobe did not improve the fit appreciably (residual variance change of 1.4%), indicating that the auditory cortex did not contribute to the ACOP. Next, the neural generators were estimated using a distributed source analysis approach (LAURA; Grave de Peralta Menendez et al., 2004). The LAURA solution revealed source activity in the same region of the fusiform gyrus and no source activity in auditory cortex. Figure 2c displays the close correspondence between the estimated dipolar and distributed sources in the occipital lobe.
To confirm that ACOP arose in visual cortex, its topography and estimated neural sources were compared to those of two well-characterized ERP components that were also evident in this experiment. The first of these benchmark ERP components – the target-elicited P1 (latency 80–150 ms) – has been shown to originate from extrastriate visual cortex (Di Russo et al., 2003; Störmer et al., 2009b). Here we compared the ERPs elicited by visual targets in which the left and right Gabor patches differed in contrast, in order to isolate lateralized ERP activity associated with asymmetrical visual stimulation. As expected, the P1 component was larger over the hemisphere contralateral to the higher-contrast Gabor patch (Fig. 2e). The topography of this lateralized P1 closely resembled that of the ACOP, with a single focus over the occipital scalp (Fig. 2f), and its dipolar neural generators were also localized to the region of the fusiform gyrus, Brodmann’s Area 19 (Talairach coordinates: x = ±34, y = −70, z = −1; Fig 2g). This dipole model accounted for 92.4% of the ERP variance over the P1 interval. An independent LAURA analysis revealed distributed source activity in the same region of the fusiform gyrus (Figure 2g).
The other benchmark ERP component – the cue-elicited N1 – has been shown to originate from superior temporal auditory cortex (Picton, 2011). In contrast to the subsequent ACOP, the voltage topography of the N1 was focused tightly over the temporal scalp rather than more posterior scalp regions (Fig 1d). Consistent with this scalp topography, the dipolar sources of the contralateral N1 were situated in the superior temporal gyrus (STG), Brodmann’s Area 22 (x = ± 53, y = −10, z = 4; Fig 1e). The best-fitting dipole in temporal cortex accounted for 87.8% of the variance of the lateralized N1 topography over the 120–140 ms interval. An independent LAURA analysis revealed distributed source activity in the same region of STG (Fig 1e).
Participants were required to maintain visual fixation on a central cross throughout the cue-target interval so that cue processing could be assessed in the absence of eye movements. Trials contaminated by eye movements were flagged and discarded on the basis of deviations in the horizontal electro-oculogram (EOG; see Methods). Figure 1c displays the average EOGs to left and right cues, obtained from the remaining artifact-free trials. The EOG waveforms are largely flat, but contain small positive and negative deflections peaking at 80 ms and 140 ms, respectively. Of principal interest were the differences in EOG waveforms following left and right cues, because such differences might indicate that participants moved their eyes towards the cued locations. Both the residual EOG deflections and the lateralized differences were less than 0.5 μV, however, and previous calibration studies have shown that any associated residual eye movements would be on the average no larger than 0.1° of visual angle (McDonald & Ward, 1999). Importantly, the lateralized N1 differences recorded over the frontal scalp were larger in amplitude than the lateralized differences in the residual EOG waveform. This pattern indicates that evoked activity from auditory cortex was being picked up by the EOG electrodes lateral to the orbits as well as by fronto-temporal EEG electrodes (Fig 1d). In other words, the small deflections in the EOG reflected evoked brain activity, not residual eye movements.
Experiments 2–4: Visual cortex activation in unimodal auditory tasks
The results of Experiment 1 support the proposal that salient sounds activate visual cortex, at least in a situation where the sounds precede task-relevant visual stimuli. However, it is unclear whether this cue-induced activation of visual cortex is contingent upon the use of a visual task or whether it might also occur in the context of a purely auditory task. Accordingly, three additional experiments were carried out to determine whether the lateral sounds used in Experiment 1 would elicit the ACOP in purely unimodal auditory tasks.
Experiment 2 was similar to Experiment 1, except that a pair of pure tones was used in place of the visual-target display. One tone was presented at a standard volume, while the volume of the other tone could be lower, equal, or higher than the standard. The participants’ task was to indicate whether the tone perceived to be louder was low frequency (315 Hz) or high frequency (2.1 kHz). As in Experiment 1, there were short-SOA trials (66.6%), long-SOA trials (16.7%), and no-target trials (16.7%). Interestingly, unlike the case of visual targets (Experiment 1), the auditory cue did not influence the perceived intensity of the auditory targets when the cue-target SOA was short, p > .05.
As in Experiment 1, the cue-elicited ERPs were averaged over long-SOA and no-target trials (combined) to determine whether the auditory cue activated visual cortex. Once again, the contralateral occipital waveform became more positive than the ipsilateral waveform starting at approximately 220 ms (Fig. 3a, left; electrode sites P07/P08, p < .0002), and the topography of this ACOP was remarkably similar to that observed in the visual task of Experiment 1 (Fig. 3a, right). The lateralization coefficient for this ACOP was also similar to that in Experiment 1 (1.24). These results suggest that the auditory cue activated visual cortex despite the fact that participants were not preparing for visual targets in Experiment 2. This was further supported by the dipole analysis that localized the ACOP in Experiment 2 to the same ventral region of the visual cortex as the ACOP in Experiment 1 (Brodmann’s Area 19; dipole coordinates x = ± 38, y = −70, z = −17, R.V. = 8.0 %; Fig. 4).
Figure 3.

Occipitally recorded waveforms (left) and scalp topographies (right) of ACOP elicited by lateral noise bursts in tasks with auditory targets. Scalp topographies are of the mean contralateral minus ipsilateral difference amplitudes over 260–360 ms (dashed waveforms). (A) Data from Experiment 2: noise bursts preceded paired target tones on most trials. (B) Data from Experiment 3: noise bursts were presented in randomized sequence with paired target tones. (C) Data from Experiment 4: noise bursts occurred in randomized sequence with central target tones.
Figure 4.
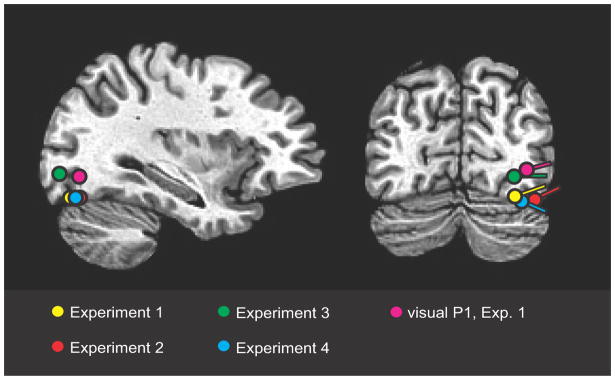
Estimated dipolar source locations of ACOP (contralateral minus ipsilateral difference amplitude over 260–360 ms) to lateral noise bursts in all four experiments together with the source of the visual P1 in Experiment 1. Dipoles are superimposed on a standard brain. All dipoles were localized to ventral-lateral visual cortex of the occipital lobe.
In Experiments 1 and 2 the lateral sounds that activated visual cortex were spatially nonpredictive, but they did convey useful temporal information, since a target appeared 150 ms after the cue on the majority of the trials. Thus, it is conceivable that the activation of visual cortex by the auditory cue was contingent upon there being a rapid, and predictable, cue-target sequence that might affect the way in which an observer reacts to the peripheral sounds. To assess this possibility, two further experiments were carried out in which there was no temporal linkage between the lateral noise bursts used previously as cues and the task-relevant target tones. Experiment 3 was identical to Experiment 2, except that the left and right noise bursts and the target tones were presented in completely random order with variable inter-stimulus intervals (range of ISIs: 2.0 – 2.5 s). In Experiment 4, the left and right noise bursts were presented in a randomized sequence along with centrally presented target tones. In this latter experiment, participants simply had to respond as quickly as possible whenever a central target tone was detected in the randomized sequence.
In Experiments 3 and 4 the spatially and temporally non-predictive noise bursts nonetheless elicited robust ACOPs (Experiment 3: p < .002; Experiment 4: p < .02) with time courses and scalp topographies very similar to those observed in Experiments 1 and 2 (Figs. 3b and 3c). Lateralization coefficients were 1.14 and 1.12, respectively. The best-fitting dipolar sources of these ACOPs were again localized to the ventral visual cortex within Brodmann’s Area 19 (dipole coordinates for Experiment 3, x = ± 26, y = −78, z = −4, R.V. = 10.1%; for Experiment 4, x = ± 30, y = −71, z = −14, R.V. = 9.1%). These estimated sources were situated near the sources of the ACOPs in Experiments 1 and 2 as well as the source of the visually evoked P1 from Experiment 1 (Fig. 4). These results demonstrate that the irrelevant sounds activated visual cortex even though the sounds did not act as spatial or temporal cues for the task-relevant targets, and all stimuli in the experiment were auditory.
DISCUSSION
Previous studies have shown that salient sounds can influence the way we perceive the visual world by modulating the neural responses evoked by visual stimuli (Frassinetti et al., 2002; McDonald et al., 2000, 2003, 2005; Störmer et al., 2009b). Here, we examined the neural-activity pattern evoked by the sounds themselves to determine whether they might activate visual-cortical regions that normally participate in visual perception. Surprisingly, salient sounds presented 25° to the left of right of fixation elicited a broad positive ERP over the contralateral occipital scalp – an ERP component that was labeled the auditory contralateral occipital positivity (ACOP). Notably, the amplitude of this ACOP was predictive of participants’ judgments about the perceived contrast of visual targets on short-SOA trials (Experiment 1). According to dipole source analyses, the neural generators of the ACOP were situated in ventral visual areas of the occipital cortex, in the same region as the generators of the visual-evoked P1 component. A very similar ACOP was elicited by lateral sounds when the visual targets were replaced by auditory targets (Experiment 2) and when the sounds were temporally, as well as spatially, non-predictive of the auditory target’s occurrence (Experiments 3 and 4). On the basis of these findings, we conclude that salient-but-irrelevant sounds activate visual cortex independently of an observer’s goals and intentions. That is, salient sounds activate visual cortex automatically.
A number of previous studies have reported activation of visual cortex when attention was directed voluntarily towards task-relevant auditory stimuli. In electrophysiological studies where symbolic cues directed attention to the location of a relevant target stimulus, a broad occipital positivity was elicited by the cue but at a longer onset latency (400–500 ms) than the present ACOP (Störmer et al., 2009a; Eimer et al., 2002; Green et al., 2005; Seiss et al., 2007). This late positivity was generally preceded by a negative deflection elicited in more anterior brain areas associated with attentional control, consistent with the hypothesis that these late components are consequences of the voluntary allocation of spatial attention. Neuroimaging studies using fMRI have also reported visual cortex activation during periods of expectancy and voluntarily directed attention towards auditory stimuli (Bueti & Macaluso, 2010; Cate et al., 2009; Johnson & Zatorre, 2005; Sabri et al., 2008; Saito et al., 2005; von Kriegstein et al., 2003; Wu et al., 2007; Zimmer et al., 2004). Electrophysiological and neuromagnetic recordings have also shown that interactions between auditory and visual signals occur in multiple brain regions including the visual cortex (Naue et al., 2011; Senkowski et al., 2011; Talsma, 2006; Van der Burg et al., 2011; Cappe, 2010; Raij et al., 2010), but these studies did not examine the possibility that salient, task-irrelevant sounds may activate the visual cortex automatically. Thus, while there is ample evidence that the visual cortex becomes engaged through top-down control mechanisms when attention is voluntarily directed to auditory stimuli, the present study provides the first direct evidence to our knowledge that salient sounds also engage the visual cortex automatically.
The ACOP was elicited over a circumscribed time interval beginning about 200 ms after sound onset and extending for 250–300 ms thereafter. This time frame appears to fit well with the location-specific facilitatory effects on visual perception that have been observed when the lateral sound preceded a visual target with an SOA of 150 ms (Störmer et al., 2009b) or 100–300 ms (McDonald et al., 2003, 2005). Specifically, the initial visual evoked response in ventral extrastriate cortex (P1 component) begins with a latency of about 100 ms after the visual targets in these studies (see also Di Russo et al., 2003), and thus the P1 coincides in time with the ACOP when the auditory-visual SOA is 100–300 ms. Such a temporal correspondence of the ACOP and the visual-evoked P1 may well be a pre-requisite for the enhanced perceptual processing of the visual target and the associated modulations of the ERP to the target (McDonald et al., 2003, 2005; Störmer et al., 2009b) as well as the correlation of the ACOP amplitude with the perceived contrast of the contralateral Gabor patch target (present study). An important goal for future studies will be to explore the time course of auditory influences on visual perception in relation to the time course of the ACOP.
As with other lateralized ERP components, it is not possible to specify with certainty whether the ACOP represents an enhancement of processing in the directly stimulated (contralateral) hemisphere or a suppression of processing in the opposite hemisphere. However, the bulk of the evidence is strongly indicative of an enhancement of processing in the contralateral visual cortex. As outlined in the Introduction, spatially non-predictive cues have been found to enhance the processing of co-localized visual stimuli in a number of ways: by enhancing their discriminability, by facilitating their access to conscious awareness, and by boosting their apparent contrast. Together with our present findings, such results strongly suggest that spatially nonpredictive sounds activate the contralateral visual cortex. It remains to be determined whether there is also a complementary de-activation of the opposite hemisphere.
The anatomical pathway mediating the ACOP remains to be determined. Several audio-visual pathways have been identified (for a review, see Cappe et al., 2012), including direct pathways between lower-level unimodal regions (Falchier et al., 2002; Rockland & Ojima, 2003) and indirect hierarchical feedback connections from higher-level multisensory regions to the unimodal sensory regions (Driver & Noesselt, 2008; Stein & Meredith, 1993). Several multisensory regions have been identified in primate cortex, including the superior temporal sulcus, posterior parietal cortex and subregions of the frontal and prefrontal lobes; additional multisensory convergence zones are known to exist in the superior colliculus, pulvinar nucleus of the thalamus and other sub-cortical structures (for review, see Driver & Noesselt, 2008). Interestingly, all of these multisensory regions have been implicated in covert spatial attention and overt orienting behaviours as well as in multisensory interactions (Wright & Ward, 2008). Given the long latency of the ACOP (200–250 ms after the auditory cue), it seems unlikely that it would be mediated by direct pathways between the auditory and visual cortices. Such direct pathways have been proposed to underlie crossmodal activations and audiovisual interactions that occur within the initial 40–60 ms after sound onset (Raij et al., 2010). In contrast, the timing of the ACOP suggests that longer hierarchical pathways are involved and that considerable processing is carried out in higher-level multisensory regions before the visual cortex is activated.
Acknowledgments
This research was supported by grants from the National Science Foundation (BCS-1029084) and the National Institute of Mental Health (1P50MH86385) (to SAH), and the Natural Sciences and Engineering Research Council of Canada and the Canada Foundation for Innovation (to JJM). VSS was supported by the International Max Planck Research School (LIFE). The authors thank Matthew Marlow for technical assistance.
Footnotes
AUTHOR CONTRIBUTIONS
JJM, VSS and SAH designed the experiments; JJM, VSS, AM and WF collected and analyzed the data; JJM, VSS and SAH wrote the paper.
COMPETING INTEREST STATEMENT
The authors declare no competing financial interests.
References
- Bueti D, Macaluso E. Auditory temporal expectations modulate activity in visual cortex. Neuroimage. 2010;51:1168–1183. doi: 10.1016/j.neuroimage.2010.03.023. [DOI] [PubMed] [Google Scholar]
- Cappe C, Rouiller EM, Barone P. Cortical and thalamic pathways for multisensory and sensorimotor interplay. In: Murray MM, Wallace MT, editors. Frontiers in the Neural Bases of Multisensory Processes. CRC Press; Boca Ratan, FL: 2012. pp. 15–30. [PubMed] [Google Scholar]
- Cappe C, et al. Auditory-visual multisensory interactions in humans: timing, topography, directionality and sources. J Neurosci. 2010;30:12572–12580. doi: 10.1523/JNEUROSCI.1099-10.2010. [DOI] [PMC free article] [PubMed] [Google Scholar]
- Carrasco M. Visual Attention: The past 25 years. Vision Res. 2011;51:1484–1525. doi: 10.1016/j.visres.2011.04.012. [DOI] [PMC free article] [PubMed] [Google Scholar]
- Cate AD, et al. Auditory Attention Activates Peripheral Visual Cortex. PLoS ONE. 2009;4:e4645. doi: 10.1371/journal.pone.0004645. [DOI] [PMC free article] [PubMed] [Google Scholar]
- Cox RW. AFNI: Software for analysis and visualization of functional magnetic resonance neuroimages. Computers Biomed Res. 1996;29:162–173. doi: 10.1006/cbmr.1996.0014. [DOI] [PubMed] [Google Scholar]
- Di Russo F, Martinez A, Hillyard SA. Source analysis of event-related cortical activity during visuo-spatial attention. Cereb Cortex. 2003;13:486–499. doi: 10.1093/cercor/13.5.486. [DOI] [PubMed] [Google Scholar]
- Driver J, Noesselt T. Multisensory interplay reveals crossmodal influences on ‘sensory-specific’ brain regions, neural responses, and judgments. Neuron. 2008;57:11–23. doi: 10.1016/j.neuron.2007.12.013. [DOI] [PMC free article] [PubMed] [Google Scholar]
- Eimer M, van Velzen J, Driver J. Cross-modal interactions between audition, touch, and vision in endogenous spatial attention: ERP evidence on preparatory states and sensory modulations. J Cogn Neurosci. 2002;14:254–271. doi: 10.1162/089892902317236885. [DOI] [PubMed] [Google Scholar]
- Falchier A, Clavagnier S, Barone P, Kennedy H. Anatomical evidence of multimodal integration in primate striate cortex. J Neurosci. 2002;22:5749–5759. doi: 10.1523/JNEUROSCI.22-13-05749.2002. [DOI] [PMC free article] [PubMed] [Google Scholar]
- Frassinetti F, Bolognini N, Làdavas E. Enhancement of visual perception by crossmodal visuo-auditory interaction. Exp Brain Res. 2002;147:332–343. doi: 10.1007/s00221-002-1262-y. [DOI] [PubMed] [Google Scholar]
- Grave de Peralta Menendez R, Murray MM, Michel CM, Martuzzi R, Gonzalez Andino SL. Electrical neuroimaging based on biophysical constraints. NeuroImage. 2004;21:527–539. doi: 10.1016/j.neuroimage.2003.09.051. [DOI] [PubMed] [Google Scholar]
- Green JJ, Conder JA, McDonald JJ. Lateralized frontal activity elicited by attention-directing visual and auditory cues. Psychophysiol. 2008;45:579–587. doi: 10.1111/j.1469-8986.2008.00657.x. [DOI] [PubMed] [Google Scholar]
- Green JJ, Teder-Sälejärvi WA, McDonald JJ. Control mechanisms mediating shifts of attention in auditory and visual space: a spatio-temporal ERP analysis. Exper Brain Res. 2005;166:358–369. doi: 10.1007/s00221-005-2377-8. [DOI] [PubMed] [Google Scholar]
- Itti L, Koch C. Computational modeling of visual attention. Nat Rev Neurosci. 2001;2:194–203. doi: 10.1038/35058500. [DOI] [PubMed] [Google Scholar]
- Johnson JA, Zatorre RJ. Attention to simultaneous unrelated auditory and visual events: behavioral and neural correlates. Cerebral Cortex. 2005;15:1609–1620. doi: 10.1093/cercor/bhi039. [DOI] [PubMed] [Google Scholar]
- Macaluso E, Frith C, Driver J. Response to McDonald, Teder-Sälejärvi, & Ward. Science. 2001;292:1791–1791. doi: 10.1126/science.292.5523.1791a. [DOI] [PubMed] [Google Scholar]
- McDonald JJ, Green JJ, Störmer VS, Hillyard SA. Cross-modal spatial cueing of attention influences visual perception. In: Murray MM, Wallace MT, editors. Frontiers in the Neural Bases of Multisensory Processes. CRC Press; Boca Ratan, FL: 2012. pp. 509–527. [PubMed] [Google Scholar]
- McDonald JJ, Teder-Sälejärvi WA, Di Russo F, Hillyard SA. Neural substrates of perceptual enhancement by cross-modal spatial attention. J Cogn Neurosci. 2003;15:10–19. doi: 10.1162/089892903321107783. [DOI] [PubMed] [Google Scholar]
- McDonald JJ, Teder-Sälejärvi WA, Di Russo F, Hillyard SA. Neural basis of auditory-induced shifts in visual time-order perception. Nat Neurosci. 2005;8:1197–1202. doi: 10.1038/nn1512. [DOI] [PubMed] [Google Scholar]
- McDonald JJ, Teder-Sälejärvi WA, Hillyard SA. Involuntary orienting to sound improves visual perception. Nature. 2000;407:906–908. doi: 10.1038/35038085. [DOI] [PubMed] [Google Scholar]
- McDonald JJ, Teder-Sälejärvi WA, Ward LM. Multisensory integration and crossmodal attention effects in the human brain. Science. 2001;292:1791–1791. doi: 10.1126/science.292.5523.1791a. [DOI] [PubMed] [Google Scholar]
- McDonald JJ, Ward LM. Spatial relevance determines facilitatory and inhibitory effects of auditory covert spatial orienting. J Exper Psychol Hum Percept Perform. 1999;25:1234–1252. [Google Scholar]
- Näätänen R. Attention and brain function. Lawrence Erlbaum Associates; Hillsdale, NJ: 1992. [Google Scholar]
- Naue N, et al. Auditory event-related response in visual cortex modulates subsequent visual responses in humans. J Neurosci. 2011;31:7729–7736. doi: 10.1523/JNEUROSCI.1076-11.2011. [DOI] [PMC free article] [PubMed] [Google Scholar]
- Perrin F, Pernier J, Bertrand O, Echallier JF. Spherical splines for scalp potential and current density mapping. Electroencephalogr Clin Neurophysiol. 1989;72:184–187. doi: 10.1016/0013-4694(89)90180-6. [DOI] [PubMed] [Google Scholar]
- Picton TW. Human Auditory Evoked Potentials. Plural Publishing; San Diego: 2011. [Google Scholar]
- Praamstra P, Stegeman DF, Horstink MWIM, Cools AR. Dipole source analysis suggests selective modulation of the supplementary motor area contribution to the readiness potential. Electroencephalogr Clin Neurophysiol. 1996;98:468–477. doi: 10.1016/0013-4694(96)95643-6. [DOI] [PubMed] [Google Scholar]
- Raij T, et al. Onset timing of cross-sensory activations and multisensory interactions in auditory and visual sensory cortices. Eur J Neurosci. 2010;31:1772–1782. doi: 10.1111/j.1460-9568.2010.07213.x. [DOI] [PMC free article] [PubMed] [Google Scholar]
- Reynolds JH, Chelazzi L. Attentional Modulation of Visual Processing. Annu Rev Neurosci. 2004;27:611–647. doi: 10.1146/annurev.neuro.26.041002.131039. [DOI] [PubMed] [Google Scholar]
- Rockland KS, Ojima H. Multisensory convergence in calcarine visual areas in macaque monkey. Int J Psychophysiol. 2003;50:19–26. doi: 10.1016/s0167-8760(03)00121-1. [DOI] [PubMed] [Google Scholar]
- Rorden C, Brett M. Stereotaxic display of brain lesions. Behav Neurol. 2000;12:191–200. doi: 10.1155/2000/421719. [DOI] [PubMed] [Google Scholar]
- Sabri M, et al. Attentional and linguistic interactions in speech perception. Neuroimage. 2008;39:1444–1456. doi: 10.1016/j.neuroimage.2007.09.052. [DOI] [PMC free article] [PubMed] [Google Scholar]
- Saito DN, et al. Cross-modal binding and activated attentional networks during audio-visual speech integration: a functional MRI study. Cerebral Cortex. 2005;15:1750–1760. doi: 10.1093/cercor/bhi052. [DOI] [PubMed] [Google Scholar]
- Seiss E, Gherri E, Eardley AF, Eimer M. Do ERP components triggered during attentional orienting represent supramodal attentional control? Psychophysiol. 2007;44:987–990. doi: 10.1111/j.1469-8986.2007.00591.x. [DOI] [PMC free article] [PubMed] [Google Scholar]
- Senkowski D, et al. Multisensory interactions in early evoked brain activity follow the principle of inverse effectiveness. NeuroImage. 2011;56:2200–2208. doi: 10.1016/j.neuroimage.2011.03.075. [DOI] [PubMed] [Google Scholar]
- Stein BE, Meredith MA. The merging of the sense. MIT Press; Cambridge, MA: 1993. [Google Scholar]
- Störmer VS, McDonald JJ, Hillyard SA. Cross-modal cueing of attention alters appearance and early cortical processing of visual stimuli. Proc Natl Acad Sci USA. 2009;106:22456–22461. doi: 10.1073/pnas.0907573106. [DOI] [PMC free article] [PubMed] [Google Scholar]
- Störmer VS, Green JJ, McDonald JJ. Tracking the voluntary control of auditory spatial attention with event-related brain potentials. Psychophysiol. 2009;46:357–366. doi: 10.1111/j.1469-8986.2008.00778.x. [DOI] [PubMed] [Google Scholar]
- Talairach J, Tournoux P. Co-planar stereotaxic atlas of the human brain. Vol. 147. Thieme; New York: 1988. [Google Scholar]
- Talsma D, et al. Selective attention and audiovisual integration: Is attending to both modalities a prerequisite for early integration? Cerebral Cortex. 2006;17:691–701. doi: 10.1093/cercor/bhk016. [DOI] [PubMed] [Google Scholar]
- Van der Burg E, et al. Early multisensory interactions affect the competition among multiple objects. NeuroImage. 2011;55:1208–1218. doi: 10.1016/j.neuroimage.2010.12.068. [DOI] [PubMed] [Google Scholar]
- von Kriegstein K, Eger E, Kleinschmidt A, Giraud AL. Modulation of neural responses to speech by directing attention to voices or verbal content. Cogn Brain Res. 2003;17:48–55. doi: 10.1016/s0926-6410(03)00079-x. [DOI] [PubMed] [Google Scholar]
- Wright RD, Ward LM. Orienting of attention. Oxford University Press; New York: 2008. [Google Scholar]
- Wu CT, Weissman DH, Roberts KC, Woldorff MG. The neural circuitry underlying the executive control of auditory spatial attention. Brain Res. 2007;1134:187–198. doi: 10.1016/j.brainres.2006.11.088. [DOI] [PMC free article] [PubMed] [Google Scholar]
- Zimmer U, Lewald J, Erb M, Grodd W, Karnath HO. Is there a role of visual cortex in spatial hearing? Eur J Neurosci. 2004;20:3148–3156. doi: 10.1111/j.1460-9568.2004.03766.x. [DOI] [PubMed] [Google Scholar]