Abstract
Recent studies show that acute neuromodulation of the prefrontal cortex with transcranial direct current stimulation (tDCS) can decrease food craving, attentional bias to food, and actual food intake. These data suggest potential clinical applications for tDCS in the field of obesity. However, optimal stimulation parameters in obese individuals are uncertain. One fundamental concern is whether a thick, low-conductivity layer of subcutaneous fat around the head can affect current density distribution and require dose adjustments during tDCS administration. The aim of this study was to investigate the role of head fat on the distribution of current during tDCS and evaluate whether dosing standards for tDCS developed for adult individuals in general are adequate for the obese population. We used MRI-derived high-resolution computational models that delineated fat layers in five human heads from subjects with body mass index (BMI) ranging from “normal-lean” to “super-obese” (20.9 to 53.5 kg/m2). Data derived from these simulations suggest that head fat influences tDCS current density across the brain, but its relative contribution is small when other components of head anatomy are added. Current density variability between subjects does not appear to have a direct and/or simple link to BMI. These results indicate that guidelines for the use of tDCS can be extrapolated to obese subjects without sacrificing efficacy and/or treatment safety; the recommended standard parameters can lead to the delivery of adequate current flow to induce neuromodulation of brain activity in the obese population.
Keywords: tDCS, finite-element modeling, obesity, body mass index, head fat
1. Introduction
Obesity is a major public health concern worldwide. In the United States alone, 78 million adults and approximately 12.5 million children and adolescents were obese between 2009–2010 [1]. Research indicates that these numbers will continue to rise. The largest increase will be in severe obesity, with its accompanying surge in comorbid conditions and related healthcare costs [2, 3]. The medical, social, and economic consequences of obesity have focused global attention on the condition and spawned numerous public health initiatives. Still, therapeutic options remain limited. New treatment strategies are required to halt the rise in obesity and limit future economic and societal costs.
A growing body of evidence, mostly from human neuroimaging studies, suggests that dysregulation in brain regions that process cognitive and reward aspects of food and eating behavior may be a key component of obesity [4–9]. Thus, modulating brain activity with neurotechnologies may open new therapeutic avenues. Compared to other neuromodulatory techniques, transcranial direct current stimulation (tDCS) offers significant advantages due to its relative safety, noninvasiveness, low-cost, and portability [10].
By delivering a weak direct current to the scalp via two electrodes—anode and cathode—tDCS can modulate the transmembrane potential of neurons, modify excitability, and induce plasticity changes. Over time, these can translate into clinical effects in diverse patient populations [10–12]. Preliminary, single-session data support a potential role for tDCS in the modulation of appetite and eating behavior in humans. In a randomized, sham-controlled, crossover study conducted in 23 subjects, Fregni et al [13] reported an acute decrease in food craving, as well as a reduction in snack consumption and eye gaze fixation to food following 20 minutes of tDCS applied over the prefrontal cortex. Similarly, a study in 19 subjects by Goldman et al [14] found that prefrontal tDCS caused a transient increase in the self-reported ability to resist food and a reduction in food cravings, particularly for sweet foods and carbohydrates; however there was no effect on ad libitum food intake. More recently, Montenegro et al [15] replicated the reduction of the desire to eat in 9 overweight subjects following a single session of prefrontal tDCS, and they also found an enhancement of the effect when tDCS was combined with a bout of aerobic exercise. Altogether, these three small studies provide initial rationale for the use of tDCS in clinical trials in the field of obesity.
To optimize stimulation parameters in obese subjects requires knowing the potential influence of head fat on current density distribution. It is well-established that head anatomy and variations in tissue layers, including fat [16, 17], affect how current density is distributed in the brain [18–21]. The identical tDCS montage applied to subjects with different head anatomy can produce varied intensity and pattern of current flow, which in turn may influence efficacy or safety. Even across anatomically typical adults, variation in peak cortical current density can vary >two-fold [22].
Therefore, the presence of a thickened layer of fat around the head in obese individuals could influence brain current flow and resulting neuromodulation during tDCS administration. Investigating if and how to alter tDCS dose to accommodate variations in BMI is timely. Interest in the use of this technology in obese subjects is growing, for both the modulation of craving-related processes, and more broadly, for neuropsychiatric treatment of patients who often have obesity as a comorbidity. The purpose of this study was to systematically examine the role of head fat on the distribution of current during tDCS using MRI-derived high-resolution computational models, and to evaluate whether tDCS dosing standards developed for adults in general are adequate for the obese population.
2. Methods
2.1. Subjects
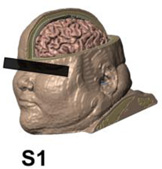
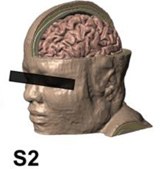
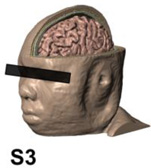
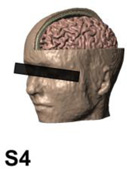
To determine the effect of head fat on current density distribution during tDCS, we created models from MRI images of five human subjects categorized according to BMI, from normal (18.5–24.9 kg/m2) to super obese (>50 kg/m2). Subjects were a 35-year-old female with a BMI of 53.5 kg/m2 (S1), a 47-year-old female with a BMI of 43.4 kg/m2 (S2), a 22-year-old female with a BMI of 38.3 kg/m2 (S3), and a 25-year-old female with a BMI of 20.9 kg/m2 (S4). We also included a 36-year-old male subject with a BMI of 25.1 kg/m2 (S#) who participated in prior tDCS computational modeling studies [22, 23]. Subjects S1-S4 underwent an MRI as part of research studies related to eating behavior and obesity. Study procedures were approved by the Institutional Review Board of Beth Israel Deaconess Medical Center.
2.2. MRI data collection and segmentation
We performed high-resolution T1-weighted magnetization prepared rapid gradient echo (MPRAGE) MRI scans at the Center for Biomedical Imaging, Boston University School of Medicine, using a 3-T Philips Achieva scanner (Philips Medical Systems, Best, The Netherlands) equipped with a Synergy-L Sensitivity Encoding (SENSE) head coil. Acquisition parameters were: TE = 3.2 ms; TR = 6.92 ms; flip angle = 8°; FOV = 256 mm; resolution = 256 × 256; slice thickness = 1.2 mm; no gap; and voxel size of 1 × 1 × 1.2 mm. The scans were segmented into 7 tissues: air, skin, fat, skull, cerebral spinal fluid (CSF), gray matter, and white matter. Automated segmentation algorithms from Statistical Parametric Mapping (SPM8, Wellcome Trust Centre for Neuroimaging, London, UK) were used in conjunction with updated tissue probability maps [24] to generate an initial segmentation of air, skin, skull, CSF, gray matter, and white matter. Additional post-processing algorithms smoothed artifacts and corrected for discontinuities [25]. We added fat segmentation through a threshold flood fill of skin (fat has high signal intensity on T1-weighted MRI images) and manually corrected lingering errors in continuity and detail in all tissues with ScanIP 4.2 (Simpleware Ltd, Exeter, UK). Tissue continuity was verified after the results of the automatic segmentation, visualizing the data extensively. Further manual adjustments were performed to guarantee continuity and improve the accuracy of the segmentation so that the tissue masks matched closely the real anatomy of the individual. All these procedures were carried out by two team members using the visualization options and tools provided in the ScanIP 4.2 software.
Two models (S# and S4) were artificially “fattened” by dilating the segmentation of fat. Fat was merged with the outer surface of skin, and then dilated isometrically up to 10 mm. This dilation caused fat to overtake the original skin surface by expanding outward. To recover the skin we made a duplicate of this merged fat and skin segmentation mask and dilated it an additional 3 mm to form the new skin surface. As a result of this transformation skin and fat were still distinct segmentation masks; fat became thicker, and the thickness of skin was fixed at 3mm. No tissues other than skin and fat were altered in these models.
We measured the thicknesses of skin, fat, bone, and CSF for each model from the segmentation data. Measurements were performed over both motor strips (C3 and C4), 5 times each, and averaged. Tissue thickness was measured in three-dimensions by sampling a patch of tissue with a bounding box. The volume of the tissue within the bounding box was determined by summating the segmentation voxels (1mm3). This volume was then projected from the area of the diagonal plane within the bounding box so that thickness (length ‘L’) equals tissue volume divided by plane area (L = V/A). The measurements were recorded from 10–20 positions C3 and C4 where the plane was tangential to the scalp in a coronal slice.
2.3. Modeling of tDCS
Stimulation electrodes, sponge pads, and gels were modeled in SolidWorks (Dassault Systèmes Corp., Waltham, MA) and imported into ScanIP for meshing. Three montages were modeled: 5×7 cm pads with anode over the motor strip (C3) and cathode over the contralateral supraorbital (M1-SO); 5×7cm pads with anode over the inferior frontal gyrus (F8) and cathode over the contralateral supra-orbital (IFG-SO); and a high-definition (HD) electrode ring configuration designed for anodal stimulation over the motor strip (4×1 over C3; 5 cm radius from center electrode to outer electrodes). An adaptive tetrahedral meshing algorithm was used in ScanIP to generate meshes between 6×10⁶ to 14×106 quadratic elements.
Finite element method (FEM) models were created in COMSOL multiphysics 3.5a (COMSOL, Inc., Burlington, MA) using the aforementioned meshes. Models were created using electrostatic volume conductor physics with material conductivities defined as follows: (in S/m): air, 1×10⁻¹⁵; skin, 0.465; fat, 0.025; skull, 0.01; CSF, 1.65; gray matter, 0.276; white matter, 0.126; electrode, 5.99×10⁷; saline-soaked sponge, 1.4; and conductive gel, 0.3. These conductivity values used were the same as previously published modeling work drawing on data from a combination of in vivo and in vitro measurements [26, 27]. We applied boundary conditions to simulate direct current stimulation. Internal boundaries between tissues were assigned the continuity condition (n*(J1-J2) = 0), and the Laplace equation (∇ *(σ∇ V) = 0) was solved. The resulting cortical electric field was interpreted as a correlate for modulation [28, 29]. The surfaces of the cathodes were grounded (V=0), while the surfaces of the anodes had a current density of 1A/m2. All other exterior surfaces were electrically insulated. Peak electric field data are provided in the text as absolute values or as mean (μ) and standard deviation (σ).
To examine the role of head fat and other tissue thickness in current distribution, we multiplied conductivity values by the average tissue thickness measured under C3 and C4 for each subject model. Also, a “weighted thickness” measure was calculated by summing each tissue thickness weighted by the associated conductivity. Linear associations between peak current intensity, tissue thickness and BMI were evaluated using Spearman's rank correlation coefficient as the data did not follow a normal distribution.
3. Results
3.1. Optimized segmentation, including fat delineation
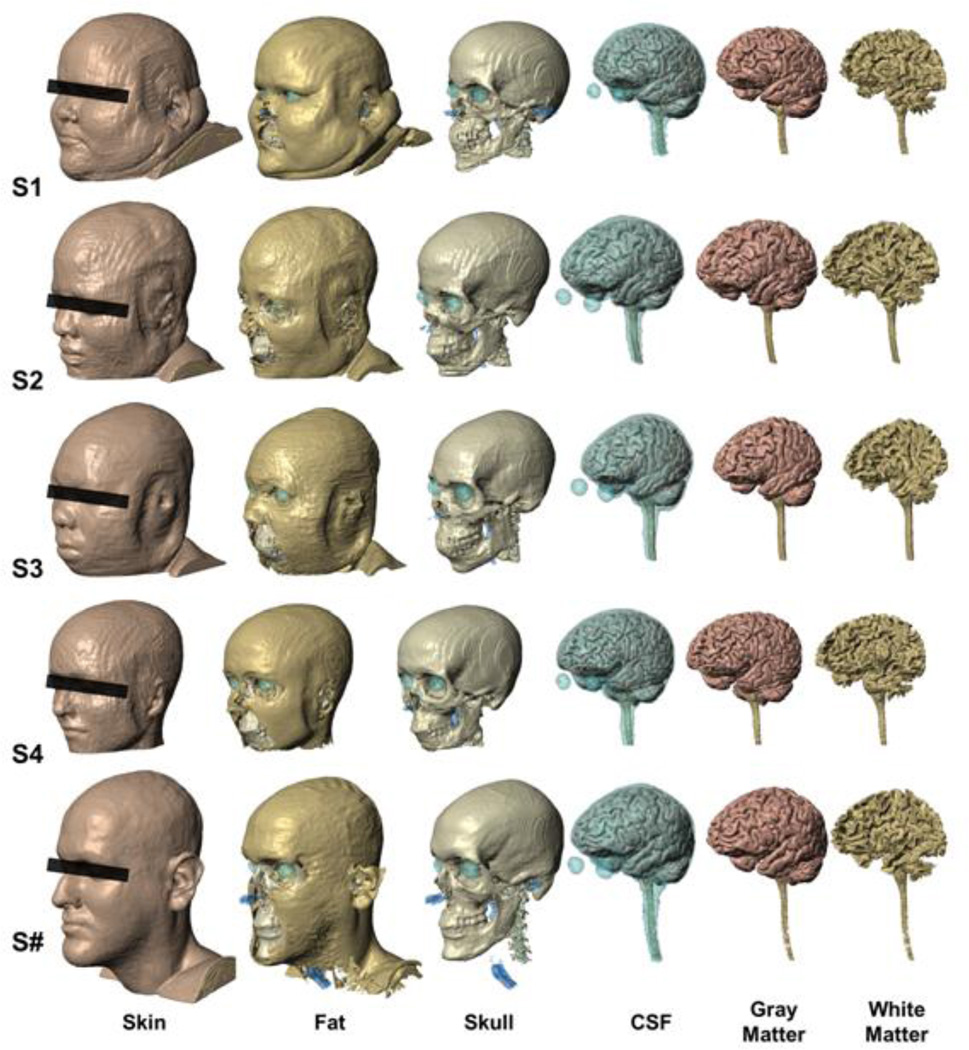
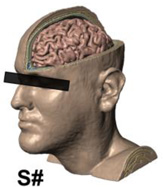
Fig. 1 shows the segmentation of all head tissue layers for each of the five subjects. We were able to delineate essential tissues, including the fat layer, with great detail in all cases. In all the tissue layers, including fat, we observed a high degree of interindividual variability in head anatomy.
Figure 1.
Segmentation of five subjects with varying BMI (S1, S2, S3, S4, S#), six tissue compartment models [skin, fat, skull, cerebral spinal fluid (CSF), gray matter and white matter]. High-resolution MRI scans were segmented using a combination of automated and manual techniques. Specific anatomical considerations, such as continuity of CSF, were verified or corrected. Images are shown on the same scale.
3.2. Current distribution in three tDCS montages
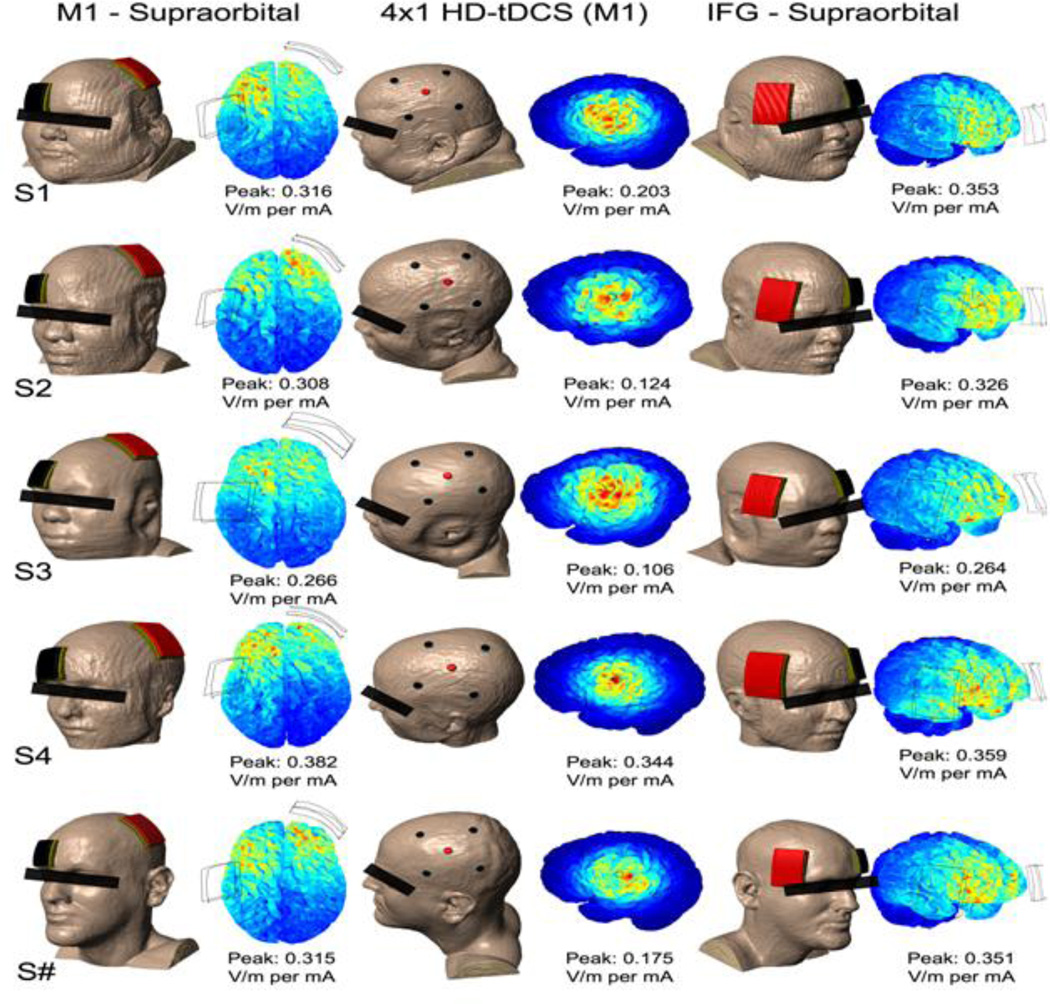
We tested two standard (5×7 cm pads) tDCS montages and a HD-tDCS montage with the ring (4×1) electrode configuration, using 1 mA total current injection in each case. Models predicted substantial interindividual variability in current peak values and distribution (Fig. 2). 4×1-Ring HD-tDCS resulted in more focal and consistent distribution of electric currents. From lowest to highest peak amplitude (sensitivity), the individuals ranked S3, S2, S#, S1, and S4; this ranking was the same in each of the montages.
Figure 2.
Resulting peak electric field magnitude simulated in three montages (M1-SO, 4×1 HD-tDCS over M1, IFG-SO) across subjects. Variations in intensity occur across individuals, but these individual variations are consistent in ranking across montages (S3<S2<S#<S1<S4). For each of the models, scale is adjusted to the current density peak, which is also provided as value for reference.
Our results corroborate previous modeling studies using single heads showing diffuse and clustered brain current flow with conventional tDCS pad montages, while 4×1 HD-tDCS produces focal current flow with moderately lower peak electric field for the same total applied current [30, 31]. Comparing across subjects, we observed differences in both peak brain electric field intensity and individual variation between montages. 4×1 HD-tDCS was the least intense on average (μ = 0.190 V/m) with the most variation in peak electric field (σ = 0.094 V/m). However, spatial targeted was controlled across subjects to within the ring. Conventional tDCS M1-SO and IFG-SO montages were comparable in intensity with relatively less variation in peak electric field across subjects (μ = 0.317 and 0.330 V/m; σ = 0.041 and 0.039 V/m); the location of the peak and indeed overall distribution varied across subjects.
Given the differences across montages, it is notable that ranking of sensitivity, at least for this sample set, remained fixed across the montages evaluated. Simultaneously, differences across subjects were as significant as across montages. Implications of these findings for rational tDCS design are considered in the discussion.
3.3. Role of head fat and other tissue thickness in current distribution
Table 1 shows individual data for specific tissue thicknesses as well as total thickness weighed by conductivity. We observed a positive trend between BMI and head fat thickness (Spearman’s rho=0.8; p=0.107), but did not predict a consistent monotonic (linear) association between current intensity and subject BMI, or thickness of either skin, fat, skull, or CSF. For example, though the highest predicted peak was in the individual with the lowest BMI (S4; 20.9 kg/m2), the subject with the intermediate BMI in the sample (S3; BMI: 38.3 kg/m2) corresponded to the lowest overall predicted intensity. Ranking order of sensitivity to tDCS was thus not consistent with increasing/decreasing ranking order for either BMI, fat or other tissue thickness, or total tissue thickness (distance of the electrode to brain).
Table 1.
Quantifying individual differences. BMI and thickness of tissues surrounding the brain were measured at EEG 10–20 positions C3 and C4. Total thickness and total thickness weighted by conductivity are also listed. Images are shown on the same scale.
 |
 |
 |
 |
 |
|
|---|---|---|---|---|---|
| BMI | 53.5 | 43.4 | 38.3 | 20.9 | 25.1 |
| Skin (mm) | 3.79 | 5.38 | 5.23 | 3.10 | 5.79 |
| Fat (mm) | 4.98 | 5.18 | 2.30 | 1.83 | 2.43 |
| Bone (mm) | 3.17 | 4.90 | 5.68 | 4.79 | 4.75 |
| CSF (mm) | 2.71 | 2.45 | 2.71 | 2.26 | 2.30 |
| Total (mm) | 14.65 | 17.91 | 15.92 | 11.97 | 15.26 |
|
Weighted Conductance (mS) |
6.39 | 6.72 | 7.02 | 5.26 | 6.60 |
In post-hoc analysis, in this sample, we observed that the rank of sensitivity to tDCS was consistent with decreasing “weighted thickness” - which was calculated by summing each tissue thickness weighted by the associated conductivity (Spearman’s rho=−1; p=0.044). This empirical “weighted thickness” metric is more influenced by relatively conductive layers (Skin and CSF) that may reflect the role of shunting through these tissues in decreasing peak cortical electric field.
3.4. Effect of intrasubject fat layer dilation
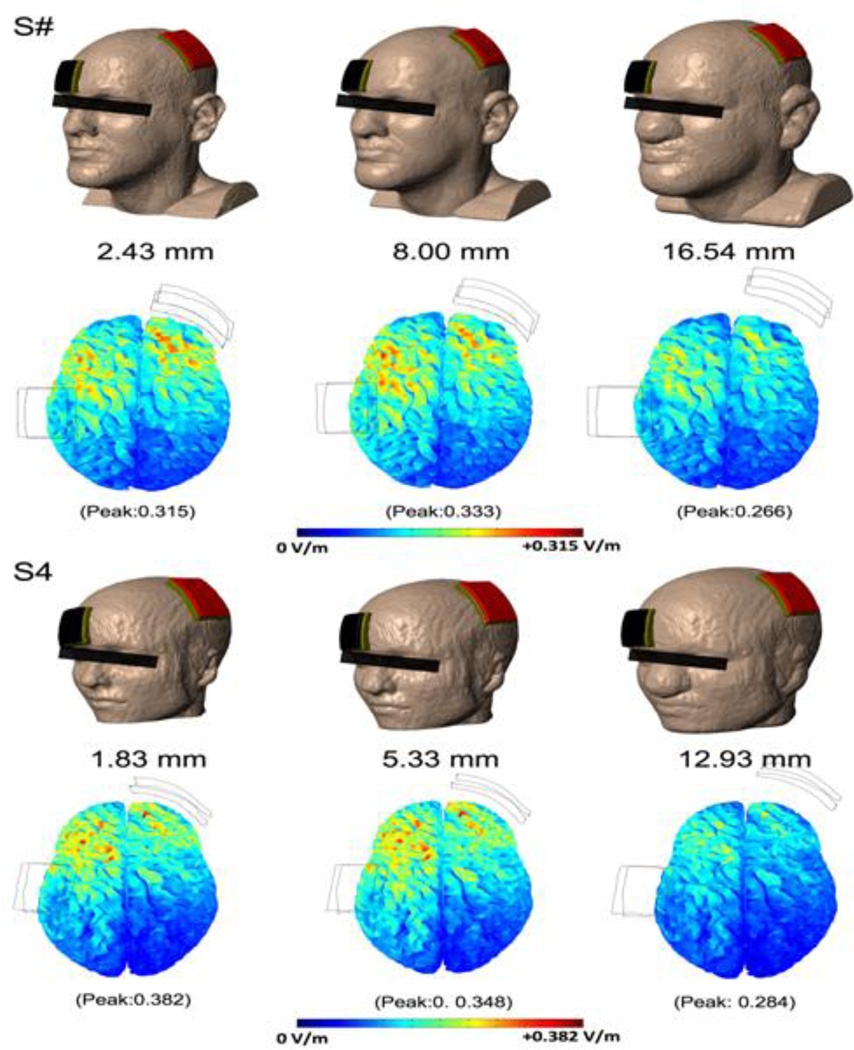
In the absence of an evident relationship between BMI and brain current flow across subjects (where other tissues were also different), we evaluated the influence of increasing fat thickness within an individual (with all other factors being equal). In the fat dilated head models, we observed a drop in peak electric field in an extreme, but not physiologically typical, scenario (fat thickness >10–15 mm) [32] (Fig. 3). Increasing the layer of fat at a physiologically observed range (a few millimeters [32]) did not have a significant effect or even a consistent effect on the direction of change. In the discussion we address that insensitivity to increasing fat thickness does not equate to a negligible role for baseline fat.
Figure 3.
Influence of fat thickness in isolation. Fat was dilated isometrically with 3 mm of skin cover; other tissues were unchanged. A moderate increase in the thickness of fat caused little change in peak electric field. There was a slight increase (5.7%) in S# and a slight decrease (8.9%) in S4. Increasing the thickness of fat beyond that physiologically observed led to noticeable decreases in intensity in both S# (15.6%) and S4 (25.7%). Varying the thickness of tissues surrounding the brain not only changes the overall conductance, but also the orientation of the electrodes with respect to the brain.
3.5. Skin current density across subjects and montages
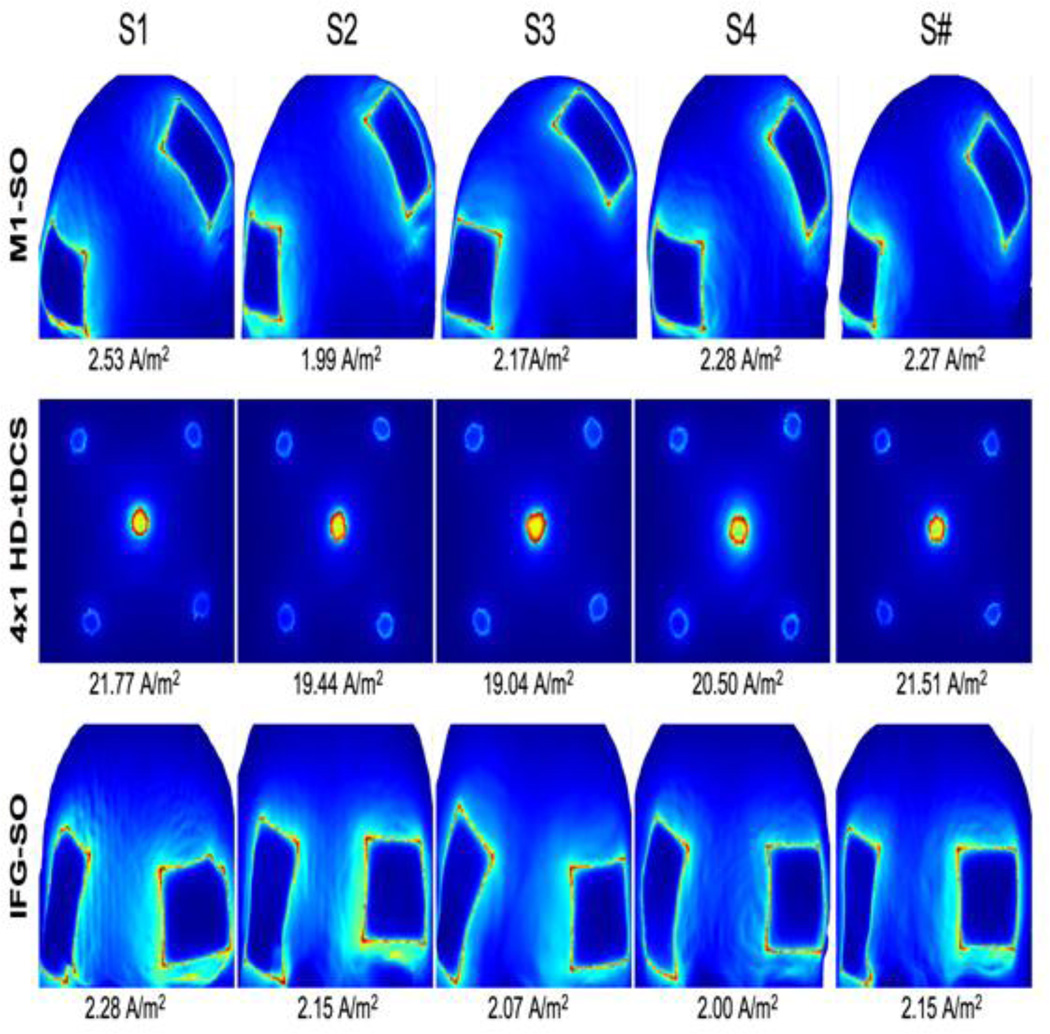
As a proxy for skin tolerability, we analyzed the current density of the skin surface (Fig. 4). Variations in current density magnitude were minimal between subjects. The spatial distribution of current density resembled that of previous studies resulting in hot spots along the edges of the contact boundary [33] although given the complexity of electrode design and skin interface [34], we propose these models are useful primarily for qualitative comparisons across heads.
Figure 4.
Skin current density across subjects and montages. The largest change in current density magnitude was between the montages utilizing HD electrodes versus conventional pads; interindividual differences are relatively minor. Peak current density was calculated per mA of stimulation.
4. Discussion
4.1. Variations in brain current flow with increasing BMI
In this study, we used high-resolution MRI-derive computational models to predict the effect of BMI and head fat on current density distribution. We used computational models to systematically address this problem in three selected tDCS montages that were simulated in five human subjects with different BMIs. We found that current density variability between subjects does not appear to have a direct and/or simple link to BMI. For example, we observed that peak amplitudes in an extreme case of obesity (BMI>50 kg/m2) were comparable to those found in non-obese cases. Further, simulated dilation of the fat layer revealed a within-subject significant effect only at supraphysiological values of fat thickness.
When combined with previous modeling studies, our results suggest that head fat contributes to current density distribution in conjunction with other anatomical differences. Ultimately, the variation among individuals is likely the result of a multitude of factors, not just BMI. According to our data, differences in head fat thickness contribute an extra ~10% variability in peak cortical current density in addition to the previously reported 1.5-to-3-fold variability that exists across normal (non-obese) individuals [22].
4.2. Effect of fat on tDCS current distribution and implications for low BMI
Our findings show that BMI does not, in itself, significantly predict brain current flow intensity, nor do physiological increases in individual BMI profoundly influence current flow. Yet these findings do not diminish the validity of studies indicating that fat influences current flow and that the omission of fat in computational models (e.g., representation as skin) reduces precision [16]. In the first case, the hypothetical removal of fat will influence current flow. In the second case, failure to implement fat in computational models may change predicted brain current by up to 60% [17]. Our results reinforce the utility of individual, MRI-derived computational models, and their value in guiding and supporting the development of new clinical applications of tDCS.
The largest peak amplitudes in all montages were found in the lowest BMI (BMI 20.9 kg/m2), which also corresponded to the smallest head size. This observation, in combination with the impact of model omission, suggests that current distribution may alter significantly in individuals with lower-than-normal BMI. We did not sample the underweight BMI spectrum (<18.5 kg/m2). However, future studies are needed to address and clarify this potential issue and its clinical implications for the future use of tDCS in low BMI individuals, including those with anorexia nervosa or cachexia [35].
4.3. Clinical efficacy and safety considerations
In contrast to noninvasive approaches such as transcranial magnetic stimulation (TMS) and electroconvulsive therapy (ECT), tDCS dose is currently not typically adjusted across subjects and the latest clinical guidelines do not recommend individual titration [10–12]. Nonetheless, just as other neuromodulation modalities benefit from individual dose adjustment, it is increasingly recognized that variation in head anatomy may alter current delivery to the brain during tDCS [22] and that this may account for variability in cognitive and behavioral outcomes. Here was considered if at one extreme, the increased head fat (a relatively resistive tissue) associated with high-BMI/obesity, brain current flow is altered in a meaningful manner. Our modeling data suggest that compared to variations seen in healthy lean subjects [22], head fat has a minor influence on current density distribution, meaning its relative contribution is small when other sources of variability related to head anatomy are added. Therefore, no special considerations regarding tDCS dose and safety may be needed for use in clinical trials involving overweight or obese individuals.
If individualized dose optimization is warranted on the population as a whole, including obese individuals remains an open question that is beyond the scope of this report. Generally, efficacy is normalized by considering electric field intensity in the target and/or distribution (focality) across the heads, computational models allow for these consideration and even automatic optimization [31].
For safety and tolerability, effects on the brain and at the skin can be considered independently [36]. In regards to brain electric fields, there is currently no evidence that conventionally used protocols approach hazardous levels [36, 37] that may allow a safety factor for normal variation across subjects. Nonetheless, as with any new investigation, caution should be used when applying this technique in clinical applications, including in the field of obesity and eating disorders. For example, these models, which predict only current flow, do not consider potential differences in neurophysiological changes and/or sensitivity for the same brain electric field.
Skin related adverse effects (tolerability, and pain/sensation) are presumed linked to current density at the skin. Though skin current density predictions are limited by model sensitivity to idiosyncratic details of the electrode/skin surface [34], our results (consistent with [17]) suggest gross changes in anatomy in obesity do no influence current density at the skin. However, as the prevalence of skin conditions tends to be higher in obese than in normal-BMI individuals [38], we recommend careful interviewing of subjects and skin inspection as suggested in current tDCS guidelines [10, 11].
These results are in line with recent reports of an acute decrease in self-reported measures of food craving following one session of tDCS over the dorsolateral prefrontal cortex in overweight/obese subjects (BMI 25.2 to 43.5 kg/m2; Montenegro et al., 2012 [15]; BMI>30 kg/m2 in 31.6% of the sample; Goldman et al., 2011 [14]). Neither of these investigations mentioned adverse effects related to tDCS administration using standard electrode sponges at 2 mA intensity for 20 minutes. The combination of modeling and experimental evidence suggests that the current guidelines are both safe and sufficient for neuromodulation of brain activity across the normal-to-obese BMI spectrum.
4.4. Computational models in tDCS design and special considerations at extremes of BMI
This study makes predictions based on computational models with precision limited by the accuracy of segmentation (Fig. 1) and tissue conductivity assignments. Other permutations and refinements, such as the addition of further tissue masks and anisotropy, only have value in informing clinical guidelines if 1) extra precision is added rationally rather than for complexity; and 2) relative changes in current flow across models have a significant effect on clinical dosing decisions [19, 39]. However, if as supported by prior and the present study, individual adjustment is warranted across the general population, then added complexity must be balanced again costs associated with higher volume modeling.
4.5. Conclusions
In sum, evidence indicates that current guidelines for the administration of tDCS in the general population can be extended to those who have obesity. High-resolution computational models that include head fat provide individualized prediction of tDCS current density, and can accurately guide and support tDCS protocols in emerging clinical applications.
Highlights.
We used finite element modeling in five human heads with different body mass index
We examined the impact of head fat variability on tDCS current density distribution
There is no relationship between body mass index and brain current flow
The relative effect of head fat is small when other anatomy components are added
Current guidelines for the use of tDCS can be extrapolated to subjects with obesity
Acknowledgments
Dr. Alonso-Alonso is a recipient of grants from the Boston Nutrition and Obesity Research Center, 5 P30 DK046200, and the Nutrition Obesity Research Center at Harvard, P30 DK040561. Dr. Bikson is supported by the Wallace H Coulter Foundation Translational Career Award. The authors thank Rita Buckley for editing the manuscript.
Footnotes
Publisher's Disclaimer: This is a PDF file of an unedited manuscript that has been accepted for publication. As a service to our customers we are providing this early version of the manuscript. The manuscript will undergo copyediting, typesetting, and review of the resulting proof before it is published in its final citable form. Please note that during the production process errors may be discovered which could affect the content, and all legal disclaimers that apply to the journal pertain.
References
- 1.Ogden CL, Carroll MD, Kit BK, Flegal K. Prevalence of Obesity in the United States, 2009–2010. Hyattsville, MD: U.S. Department of Health and Human Services, Centers for Disease Control and Prevention, National Center for Health Statistics; 2012. [Google Scholar]
- 2.Wang YC, McPherson K, Marsh T, Gortmaker SL, Brown M. Health and economic burden of the projected obesity trends in the USA and the UK. Lancet. 2011;378:815–825. doi: 10.1016/S0140-6736(11)60814-3. [DOI] [PubMed] [Google Scholar]
- 3.Finkelstein EA, Khavjou OA, Thompson H, Trogdon JG, Pan L, Sherry B, et al. Obesity and severe obesity forecasts through 2030. Am. J. Prev. Med. 2012;42:563–570. doi: 10.1016/j.amepre.2011.10.026. [DOI] [PubMed] [Google Scholar]
- 4.Carnell S, Gibson C, Benson L, Ochner CN, Geliebter A. Neuroimaging and obesity: current knowledge and future directions. Obes. Rev. 2012;13:43–56. doi: 10.1111/j.1467-789X.2011.00927.x. [DOI] [PMC free article] [PubMed] [Google Scholar]
- 5.Dagher A. Functional brain imaging of appetite. Trends Endocrinol. Metab. 2012;23:250–260. doi: 10.1016/j.tem.2012.02.009. [DOI] [PubMed] [Google Scholar]
- 6.Alonso-Alonso M, Pascual-Leone A. The right brain hypothesis for obesity. JAMA. 2007;297:1819–1822. doi: 10.1001/jama.297.16.1819. [DOI] [PubMed] [Google Scholar]
- 7.Appelhans BM. Neurobehavioral inhibition of reward-driven feeding: implications for dieting and obesity. Obesity (Silver Spring) 2009;17:640–647. doi: 10.1038/oby.2008.638. [DOI] [PubMed] [Google Scholar]
- 8.Zheng H, Lenard NR, Shin AC, Berthoud HR. Appetite control and energy balance regulation in the modern world: reward-driven brain overrides repletion signals. Int. J. Obes. (Lond) 2009;33(Suppl 2):S8–S13. doi: 10.1038/ijo.2009.65. [DOI] [PMC free article] [PubMed] [Google Scholar]
- 9.Volkow ND, Wang GJ, Tomasi D, Baler RD. Obesity and addiction: neurobiological overlaps. Obes. Rev. 2013;14:2–18. doi: 10.1111/j.1467-789X.2012.01031.x. [DOI] [PMC free article] [PubMed] [Google Scholar]
- 10.Nitsche MA, Cohen LG, Wassermann EM, Priori A, Lang N, Antal A, et al. Transcranial direct current stimulation: State of the art 2008. Brain Stimul. 2008;1:206–223. doi: 10.1016/j.brs.2008.06.004. [DOI] [PubMed] [Google Scholar]
- 11.Nitsche MA, Paulus W. Transcranial direct current stimulation - update 2011. Restor. Neurol. Neurosci. 2011;29:463–492. doi: 10.3233/RNN-2011-0618. [DOI] [PubMed] [Google Scholar]
- 12.Brunoni AR, Nitsche MA, Bolognini N, Bikson M, Wagner T, Merabet L, et al. Clinical research with transcranial direct current stimulation (tDCS): Challenges and future directions. Brain Stimul. 2012;5:175–195. doi: 10.1016/j.brs.2011.03.002. [DOI] [PMC free article] [PubMed] [Google Scholar]
- 13.Fregni F, Orsati F, Pedrosa W, Fecteau S, Tome FA, Nitsche MA, et al. Transcranial direct current stimulation of the prefrontal cortex modulates the desire for specific foods. Appetite. 2008;51:34–41. doi: 10.1016/j.appet.2007.09.016. [DOI] [PMC free article] [PubMed] [Google Scholar]
- 14.Goldman RL, Borckardt JJ, Frohman HA, O'Neil PM, Madan A, Campbell LK, et al. Prefrontal cortex transcranial direct current stimulation (tDCS) temporarily reduces food cravings and increases the self-reported ability to resist food in adults with frequent food craving. Appetite. 2011;56:741–746. doi: 10.1016/j.appet.2011.02.013. [DOI] [PubMed] [Google Scholar]
- 15.Montenegro RA, Okano AH, Cunha FA, Gurgel JL, Fontes EB, Farinatti PT. Prefrontal cortex transcranial direct current stimulation associated with aerobic exercise change aspects of appetite sensation in overweight adults. Appetite. 2012;58:333–338. doi: 10.1016/j.appet.2011.11.008. [DOI] [PubMed] [Google Scholar]
- 16.Shahid S, Weng P, Ahfock T. IEEE/ICME International Conference on Complex Medical Engineering. Harbin, China: 2011. Effect of fat and muscle tissue conductivity on cortical currents - a tDCS study; pp. 211–215. [Google Scholar]
- 17.Truong DQ, Magerowski G, Pascual-Leone A, Alonso-Alonso M, Bikson M. Finite Element Study of Skin and Fat Delineation in an Obese Subject for Transcranial Direct Current Stimulation. Conf Proc IEEE Eng. Med. Biol. Soc. 2012:6587–6590. doi: 10.1109/EMBC.2012.6347504. [DOI] [PubMed] [Google Scholar]
- 18.Bikson M, Rahman A, Datta A, Fregni F, Merabet L. High-resolution modeling assisted design of customized and individualized transcranial direct current stimulation protocols. Neuromodulation. 2012;15:306–315. doi: 10.1111/j.1525-1403.2012.00481.x. [DOI] [PMC free article] [PubMed] [Google Scholar]
- 19.Bikson M, Rahman A, Datta A. Computational models of transcranial direct current stimulation. Clin. EEG Neurosci. 2012;43:176–183. doi: 10.1177/1550059412445138. [DOI] [PubMed] [Google Scholar]
- 20.Wagner T, Fregni F, Fecteau S, Grodzinsky A, Zahn M, Pascual-Leone A. Transcranial direct current stimulation: A computer-based human model study. Neuroimage. 2007;35:1113–1124. doi: 10.1016/j.neuroimage.2007.01.027. [DOI] [PubMed] [Google Scholar]
- 21.Sadleir RJ, Vannorsdall TD, Schretlen DJ, Gordon B. Transcranial direct current stimulation (tDCS) in a realistic head model. Neuroimage. 2010;51:1310–1318. doi: 10.1016/j.neuroimage.2010.03.052. [DOI] [PubMed] [Google Scholar]
- 22.Datta A, Truong D, Minhas P, Parra LC, Bikson M. Inter-Individual Variation during Transcranial Direct Current Stimulation and Normalization of Dose Using MRI-Derived Computational Models. Front. Psychiatry. 2012;3:91. doi: 10.3389/fpsyt.2012.00091. [DOI] [PMC free article] [PubMed] [Google Scholar]
- 23.Bikson M, Datta A, Rahman A, Scaturro J. Electrode montages for tDCS and weak transcranial electrical stimulation: role of "return" electrode's position and size. Clin. Neurophysiol. 2010;121:1976–1978. doi: 10.1016/j.clinph.2010.05.020. [DOI] [PMC free article] [PubMed] [Google Scholar]
- 24.Rorden C, Bonilha L, Fridriksson J, Bender B, Karnath HO. Age-specific CT and MRI templates for spatial normalization. Neuroimage. 2012;61:957–965. doi: 10.1016/j.neuroimage.2012.03.020. [DOI] [PMC free article] [PubMed] [Google Scholar]
- 25.Huang Y, Su Y, Rorden C, Dmochowski J, Datta A, Parra LC. An automated method for high-definition transcranial direct current stimulation modeling. Conf. Proc. IEEE Eng. Med. Biol. Soc. 2012:5376–5379. doi: 10.1109/EMBC.2012.6347209. [DOI] [PMC free article] [PubMed] [Google Scholar]
- 26.Datta A, Baker JM, Bikson M, Fridriksson J. Individualized model predicts brain current flow during transcranial direct-current stimulation treatment in responsive stroke patient. Brain Stimul. 2011;4:169–174. doi: 10.1016/j.brs.2010.11.001. [DOI] [PMC free article] [PubMed] [Google Scholar]
- 27.Gabriel C, Gabriel S, Corthout E. The dielectric properties of biological tissues: I. Literature survey. Phys. Med. Biol. 1996;41:2231–2249. doi: 10.1088/0031-9155/41/11/001. [DOI] [PubMed] [Google Scholar]
- 28.Bikson M, Inoue M, Akiyama H, Deans JK, Fox JE, Miyakawa H, et al. Effects of uniform extracellular DC electric fields on excitability in rat hippocampal slices in vitro. J. Physiol. 2004;557:175–190. doi: 10.1113/jphysiol.2003.055772. [DOI] [PMC free article] [PubMed] [Google Scholar]
- 29.Tranchina D, Nicholson C. A model for the polarization of neurons by extrinsically applied electric fields. Biophys. J. 1986;50:1139–1156. doi: 10.1016/S0006-3495(86)83558-5. [DOI] [PMC free article] [PubMed] [Google Scholar]
- 30.Datta A, Bansal V, Diaz J, Patel J, Reato D, Bikson M. Gyri-precise head model of transcranial DC stimulation: Improved spatial focality using a ring electrode versus conventional rectangular pad. Brain Stimul. 2009;2:201–207. doi: 10.1016/j.brs.2009.03.005. [DOI] [PMC free article] [PubMed] [Google Scholar]
- 31.Dmochowski JP, Datta A, Bikson M, Su Y, Parra LC. Optimized multi-electrode stimulation increases focality and intensity at target. J. Neural Eng. 2011;8:046011. doi: 10.1088/1741-2560/8/4/046011. [DOI] [PubMed] [Google Scholar]
- 32.Hayman LA, Shukla V, Ly C, Taber KH. Clinical and imaging anatomy of the scalp. J. Comput. Assist. Tomogr. 2003;27:454–459. doi: 10.1097/00004728-200305000-00027. [DOI] [PubMed] [Google Scholar]
- 33.Minhas P, Bansal V, Patel J, Ho JS, Diaz J, Datta A, et al. Electrodes for high-definition transcutaneous DC stimulation for applications in drug delivery and electrotherapy, including tDCS. J. Neurosci. Methods. 2010;190:188–197. doi: 10.1016/j.jneumeth.2010.05.007. [DOI] [PMC free article] [PubMed] [Google Scholar]
- 34.Kronberg G, Bikson M. Electrode assembly design for transcranial Direct Current Stimulation: A FEM modeling study. Conf. Proc. IEEE Eng. Med. Biol. Soc. 2012:891–895. doi: 10.1109/EMBC.2012.6346075. [DOI] [PubMed] [Google Scholar]
- 35.Hecht D. Transcranial direct current stimulation in the treatment of anorexia. Med. Hypotheses. 2010;74:1044–1047. doi: 10.1016/j.mehy.2009.12.032. [DOI] [PubMed] [Google Scholar]
- 36.Bikson M, Datta A, Elwassif M. Establishing safety limits for transcranial direct current stimulation. Clin. Neurophysiol. 2009;120:1033–1034. doi: 10.1016/j.clinph.2009.03.018. [DOI] [PMC free article] [PubMed] [Google Scholar]
- 37.Liebetanz D, Koch R, Mayenfels S, Konig F, Paulus W, Nitsche MA. Safety limits of cathodal transcranial direct current stimulation in rats. Clin. Neurophysiol. 2009;120:1161–1167. doi: 10.1016/j.clinph.2009.01.022. [DOI] [PubMed] [Google Scholar]
- 38.Scheinfeld NS. Obesity and dermatology. Clin. Dermatol. 2004;22:303–309. doi: 10.1016/j.clindermatol.2004.01.001. [DOI] [PubMed] [Google Scholar]
- 39.Bikson M, Datta A. Guidelines for precise and accurate computational models of tDCS. Brain Stimul. 2012;5:430–431. doi: 10.1016/j.brs.2011.06.001. [DOI] [PubMed] [Google Scholar]


