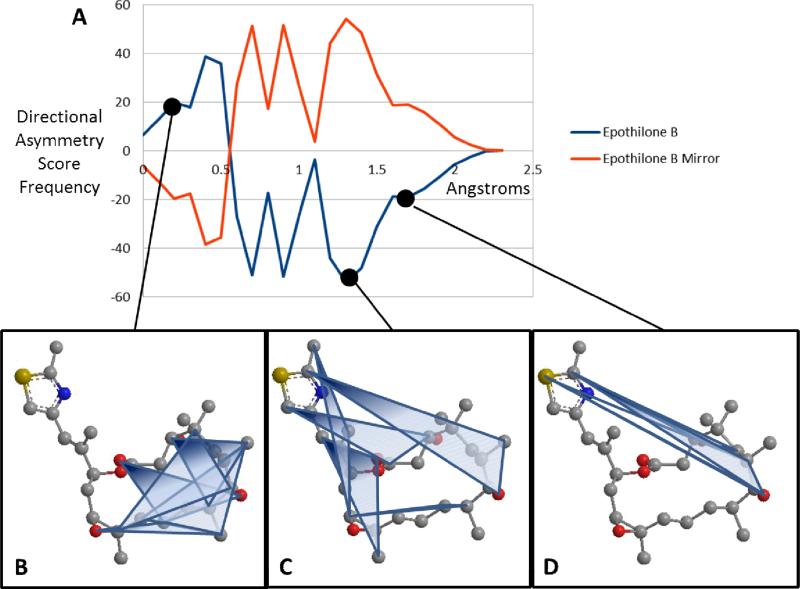
Figure 3.
EMAS curves for epothilone B (A) Plotted EMAS curves for epothilone B (blue) compared with its mirror image (red). X-axis represents the Directional Asymmetry Score in angstroms while the y-axis indicates the frequency of these scores across the entire molecule. (B) Atom triplets with a directional asymmetry score of approximately 0.3 angstroms. Note that these triangles generally cover the center of the molecule and are fairly symmetric. (C) Atom triplets with a directional asymmetry score of approximately 1.3 angstroms. Note that these triangles are further from the center of the molecule and have an asymmetric shape. (D) Atom triplets with a directional asymmetry score of approximately 1.7 angstroms. Note that these atom triplets lie furthest from the center of the molecule and are very asymmetric.

