

Abstract
Neural development is especially vulnerable to environmental influences during periods of neurogenesis and rapid maturation. In fact, short periods of environmental manipulations confined to embryonic development lead to significant changes in morphology and function. A guiding principal emerging from studies of sensory systems is that experimentally induced effects are most dramatic in higher neural levels (e.g., cortex) and primarily involve postnatal synaptic refinements. In contrast to other sensory systems, the gustatory system is particularly susceptible to the effects of deprivation much earlier and with profound changes evident in the brainstem. Here we show that feeding pregnant rats a custom diet featuring a low-sodium content for 9 d before the tongue appears in the fetus produces extensive restructuring of the gustatory brainstem. Rats born to mothers fed the custom diet from embryonic day 3 (E3) to E12 have terminal field volumes of the greater superficial petrosal, chorda tympani, and glossopharyngeal nerves at adulthood that are expanded as much as 10 times beyond that found in rats fed a standard rat chow. The widespread alterations are not attributable to increased numbers of nerve cells, increased target size, or obvious changes in peripheral taste function. Moreover, we show that the limited period of feeding the custom diet has much larger effects than if rats were fed the diet to postweaning ages. Our results suggest that early periods of altered experience, especially during nucleus of the solitary tract neurogenesis, leads to a restructuring of the gustatory brainstem, which in turn may impact the control of sensory and homeostatic processes.
Keywords: brainstem nuclei, primary afferents, taste, confocal laser microscopy, sodium, diet
Introduction
Abnormal events occurring during postnatal critical periods of sensory development lead to central morphological and functional changes (Hubel and Wiesel, 1970; Moore, 1985; Lasiter and Kachele, 1990; Cummings and Brunjes, 1997; Knudsen, 1999; Maier et al., 2003) that can often be recovered after reintroduction of the appropriate sensory stimulus at the appropriate time (Cummings et al., 1997; Dupont et al., 2001; Liao et al., 2002). Early prenatal critical periods also exist in which environmental alterations have extensive effects on the fetal brain that persist into postnatal development and adulthood. In fact, early limited periods of acute ethanol exposure and protein restriction can result in more pronounced effects than extended periods of deprivation (Gressens et al., 1997, 2001). The degree of susceptibility to abnormal environmental events most likely relates to specific developmental processes occurring during each critical period.
The gustatory system is also susceptible to experimental manipulation during discrete periods of development. However, unlike other sensory systems where neural alterations are most profound in cortex, large-scale changes occur in the gustatory brainstem (Hill et al., 1983; King and Hill, 1991, 1993; Lasiter, 1991; Vogt and Hill, 1993; May and Hill, 2006). In fact, introducing a custom diet featuring a low-sodium content from embryonic day 3 (E3) to E12 is sufficient to induce ~50% enlargement of the chorda tympani (CT) nerve terminal field in the nucleus of the solitary tract (NTS) compared with rats fed a nutritionally balanced commercial diet (Krimm and Hill, 1997). This period of E3–E12 is before formation of the tongue (Mistretta, 1972) and before the extension of processes from ganglion cells toward their peripheral and central targets (Mbiene and Mistretta, 1997; Zhang and Ashwell, 2001a) but overlaps with the period of generation of presumptive cells destined for the NTS (E11–E14 in rat) (Altman and Bayer, 1982). Thus, substantial alterations in the diet during early development may play a role in NTS development that is exclusive of peripheral gustatory influences such as neural activity.
To test the hypothesis that dietary manipulations occurring during an early, limited period results in a greater restructuring of the terminal field organization in the gustatory NTS compared with feeding the diet long term, we used a triple anterograde labeling technique to examine the morphological characteristics of three gustatory nerve terminal fields and their overlap. We compared adult rat terminal fields in three groups: rats fed the custom diet featuring a low-sodium content from E3 to E12 or from E3 to postnatal day 28 (P28) and rats fed a nutritionally balanced commercial diet throughout development. Our data show that 9 d of feeding the custom diet produces extensive restructuring of the gustatory brainstem, and the effects are more global than in E3–P28 fed rats. This suggests that early periods of abnormal experience, especially when limited to NTS neurogenesis, leads to morphological and possible functional restructuring of the gustatory brainstem, which in turn may have serious consequences for the control of sensory and homeostatic processes.
Materials and Methods
Terminal field experiments
Animals
All experiments were endorsed by the Animal Care and Use Committee at the University of Virginia and followed guidelines set by the National Institutes of Health and the Society for Neuroscience. Control and breeder rats were purchased from Harlan Sprague Dawley (Indianapolis, IN). Experimental rats were bred on site in the University of Virginia vivarium (see below).
Dietary conditions
Control animals (n = 7) received a standard rat chow diet containing 0.3% NaCl (rodent diet, catalog #8604; Harlan Teklad, Madison, WI) and tap water ad libitum. One group of experimental rats received a custom diet featuring a low-sodium content (0.03% NaCl; MP Biomedicals, Solon, OH) and distilled water ad libitum via their mothers from E3 to E12 (n = 7).
The sodium-restricted diet is custom made to approximate the macronutrient composition found in commercial diets (i.e., ~24% protein, 4% fat, 4.5% fiber, 65% carbohydrate) while closely regulating the NaCl concentration at 0.03%. Although the only dietary deficiency in the experimental diet is the low sodium, there are differences between the two diets in their specific components. In particular, the custom low-sodium diet consists of 65% sucrose, whereas the carbohydrate content of the standard, sodium-replete diet consists primarily of soybean, wheat, and corn. Similarly, the protein in the sodium-restricted diet is provided by casein, whereas crude protein makes up a similar concentration in the commercial diet; the fat content in the sodium-restricted diet is provided by corn oil, whereas crude fat makes up a similar concentration in the commercial diet.
Although there are differences between diets (i.e., they are not matched), the goal of this and previous studies (King and Hill, 1991; Krimm and Hill, 1997; May and Hill, 2006; Sollars et al., 2006) is to compare neurobiological differences between a custom sodium-restricted diet and a commercial stock diet and not between specific dietary components. This choice was made primarily because the effects of a low-sodium diet in our studies are not attributable to altered taste stimulation but likely result in early undernutrition and/or malnutrition. Moreover, we chose here and previously to use a standard rodent diet as our control diet because of the rich literature that exists in studies of rodent development with standard rodent diets. Therefore, we are examining the effects on terminal field organization between a diet proven to alter peripheral (Hill et al., 1983; Hill, 1987; Hill and Przekop, 1988) and central (Vogt and Hill, 1993) gustatory function and structure (King and Hill, 1991; Krimm and Hill, 1997; May and Hill, 2006; Sollars et al., 2006) with a nutritionally balanced commercial diet. We note, however, that our previous work used a sodium-replete diet matched to the sodium-restricted diet (Hill et al., 1983; Hill, 1987; Hill and Przekop, 1988), and the neurophysiological effects on the taste system were no different between the custom-made “control” diet and the sodium-replete diet used here. Hereafter, we will refer to the custom diet as the “sodium-restricted diet” and to the commercial diet as the “control diet,” realizing that other key dietary components differ also.
To determine the date of conception, female rats were checked for sperm every morning during breeding. When females were sperm positive, they were moved to a separate cage and placed on the sodium-restricted diet 3 d later (E3). Nine days after being placed on the sodium-restricted diet (E12), the females were placed on the control diet for the remainder of gestation, and the pups were maintained on the control diet from birth until the time of the taste nerve labeling procedure (≥40 d postnatal). A second experimental group was given the sodium-restricted diet from E3 to P28 (n = 5). At P28–P30, these rats were fed the control diet and maintained on it for at least 3 weeks before the taste nerve labeling procedure.
Triple fluorescent anterograde nerve labeling
Procedures used to label three nerves with fluorescent tracers were similar to that described by May and Hill (2006) (Fig. 1). Briefly, the CT, greater superficial petrosal (GSP), and glossopharyngeal (IX) nerves were labeled with anterograde tracers to determine the volume and spatial interaction among the afferent terminal fields in the NTS. Animals were sedated with an intramuscular injection of 0.32 mg/kg Domitor (medetomidine hydrochloride; Pfizer Animal Health, Exton, PA) and anesthetized intramuscularly with 40 mg/kg Ketaset (ketamine hydrochloride; Fort Dodge Animal Health, Fort Dodge, IA). A water-circulating heating pad was used to maintain body temperature. The rats were positioned in a nontraumatic head holder, and a ventral approach was taken to expose the GSP and CT nerves within the right tympanic bulla. The CT and GSP nerves were cut near the geniculate ganglion in the tympanic bulla, and dimethylsulfoxide (DMSO; Fisher Scientific, Fair Lawn, NJ) was briefly applied to the cut nerves. Crystals of 3 kDa biotinylated dextran amine were then applied to the proximal cut end of the GSP, and 3 kDa of tetramethylrhodamine dextran amine was applied to the proximal cut end of the CT nerve (Fig. 1). A mixture of Vaseline and mineral oil was applied to prevent migration of dye. The IX nerve was isolated just medial to the tympanic bulla and cut and placed on a small piece of Parafilm. Again, DMSO was applied briefly, and crystals of 3 kDa Cascade Blue dextran amine were applied to the proximal cut end of the IX nerve. All dextran amine conjugates were purchased from Invitrogen (Eugene, OR). A Vaseline and mineral oil mixture and a layer of Parafilm were placed on top of the IX nerve to keep the dye in place. After all three nerves were labeled, the incision was closed with sutures. Animals were then given intramuscular injections of 5 mg/ml Antisedan (atipamezole hydrochloride; Pfizer Animal Health) to promote reversal of anesthesia. After an 18–24 h survival, animals were deeply anesthetized intraperitoneally with 2.4 g/kg urethane (ethyl carbamate; Sigma-Aldrich, St. Louis, MO) to maintain adequate oxygenation and perfused transcardially with Krebs-Henseleit buffer, pH 7.3, followed by 8% paraformaldehyde, pH 7.2.
Figure 1.
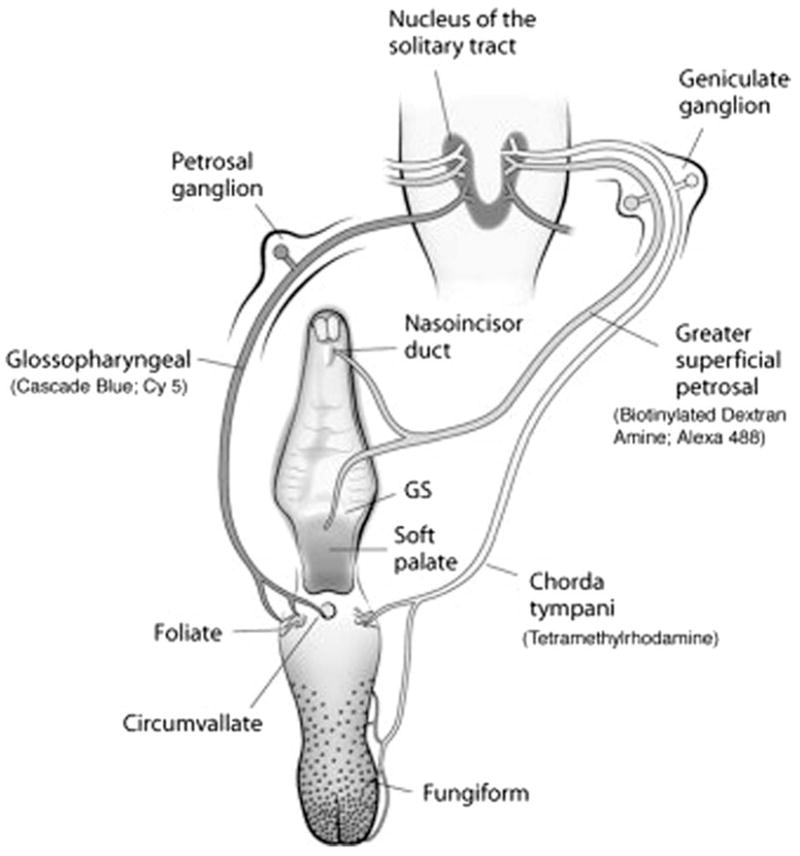
Anatomical organization of the peripheral gustatory system and the first central synaptic relay in the NTS. The CT nerve innervates taste buds in fungiform and foliate papillae on the anterior tongue. The GSP nerve innervates taste buds in the nasoincisor duct, the geschmacksstreifen (GS), and the soft palate. Both nerves make up the VII cranial nerve and have cell bodies in the geniculate ganglia. The IX nerve innervates taste buds in foliate and circumvallate papillae on the posterior tongue and has cell bodies in the petrosal ganglia. All three nerves terminate in the ipsilateral NTS; the IX nerve is shown at left only for illustrative purposes. The fluorescent markers used to detect each terminal field are noted in parentheses. See Materials and Methods for a detailed description. [The figure is adapted from May and Hill (2006).]
We established previously (May and Hill, 2006) that (1) tracers placed on a nerve did not inadvertently label other nerves, (2) the full complement of fibers were labeled as revealed by examinations of the respective ganglia, and (3) the period of survival after surgery was optimal for transport of each anterograde tracer. It should be noted that the mere presence of labeled terminal fields from GSP, CT, or IX axons does not necessarily mean that it conveys taste information. For example, the IX nerve carries a significant tactile component to the NTS (Frank, 1968). Thus, the NTS is a highly integrative center for multiple sensory inputs that originate from the oral, pharyngeal, and laryngeal epithelia as well as the viscera (Bradley, 2007).
Tissue preparation
Brains were removed and postfixed in 8% paraformaldehyde overnight. The medulla was blocked and sectioned horizontally on a vibratome at 50 μm to allow visualization of the entire rostrocaudal and mediolateral extent of the gustatory afferent terminal fields in the NTS. Tissue sections were collected in 0.1 M PBS, pH 7.2, at room temperature. Sections were then incubated for 1 h in PBS containing 0.2% Triton with 1:500 streptavidin Alexa Fluor 488(Invitrogen) and 1:500 rabbitanti-Cascade Blue (Invitrogen) at room temperature. Streptavidin Alexa Fluor 488 was used to visualize the biotinylated dextran amine-labeled, GSP-positive terminals. The rabbit anti-Cascade Blue was used as a primary antibody directed at Cascade Blue-labeled, IX nerve-positive terminals (Fig. 1). Next, sections were rinsed in PBS (three times for 5 min) and incubated for 30 min in PBS containing 0.2% Triton and 1:500 goat anti-rabbit Cy5 (Jackson ImmunoResearch, West Grove, PA). Goat anti-rabbit Cy5 was used as a secondary antibody to visualize IX nerve terminals. Finally, sections were rinsed in PBS and imaged on a confocal laser-scanning microscope (Fluoview 300; Olympus America, Melville, NY).
Confocal microscopy and data collection
Terminal fields were imaged with an Olympus IX70 microscope fitted with a Fluoview 3.3 laser-scanning system (Olympus America) equipped with a 488 nm blue argon laser, a 543 nm green HE/NE laser, and a 633 nm red HE/NE laser. Each 50 μm section containing fluorescent label was wet mounted between two coverslips, and optical sections of each terminal field were captured sequentially every 3 μm. All three terminal field images were digitally merged, and terminal field area and areas of overlap among terminal fields were quantified using Neurolucida software (version 4.34; MicroBrightField, Colchester, VT) (Fig. 2). The volume of terminal fields and field overlap in each 50 μm section were calculated by summing the areas in each optical section and multiplying by the optical section thickness (3 μm). Total terminal field volumes for each nerve and the volumes in which two or more fields overlapped were obtained by summing the volumes from each 50 μm section. The density of the label was not quantified. Therefore, the terminal field volumes were calculated when any label, regardless of density, was present. This provides data of the topographical organization of the terminal fields but does not provide information concerning the absolute amount of afferent input into the NTS.
Figure 2.
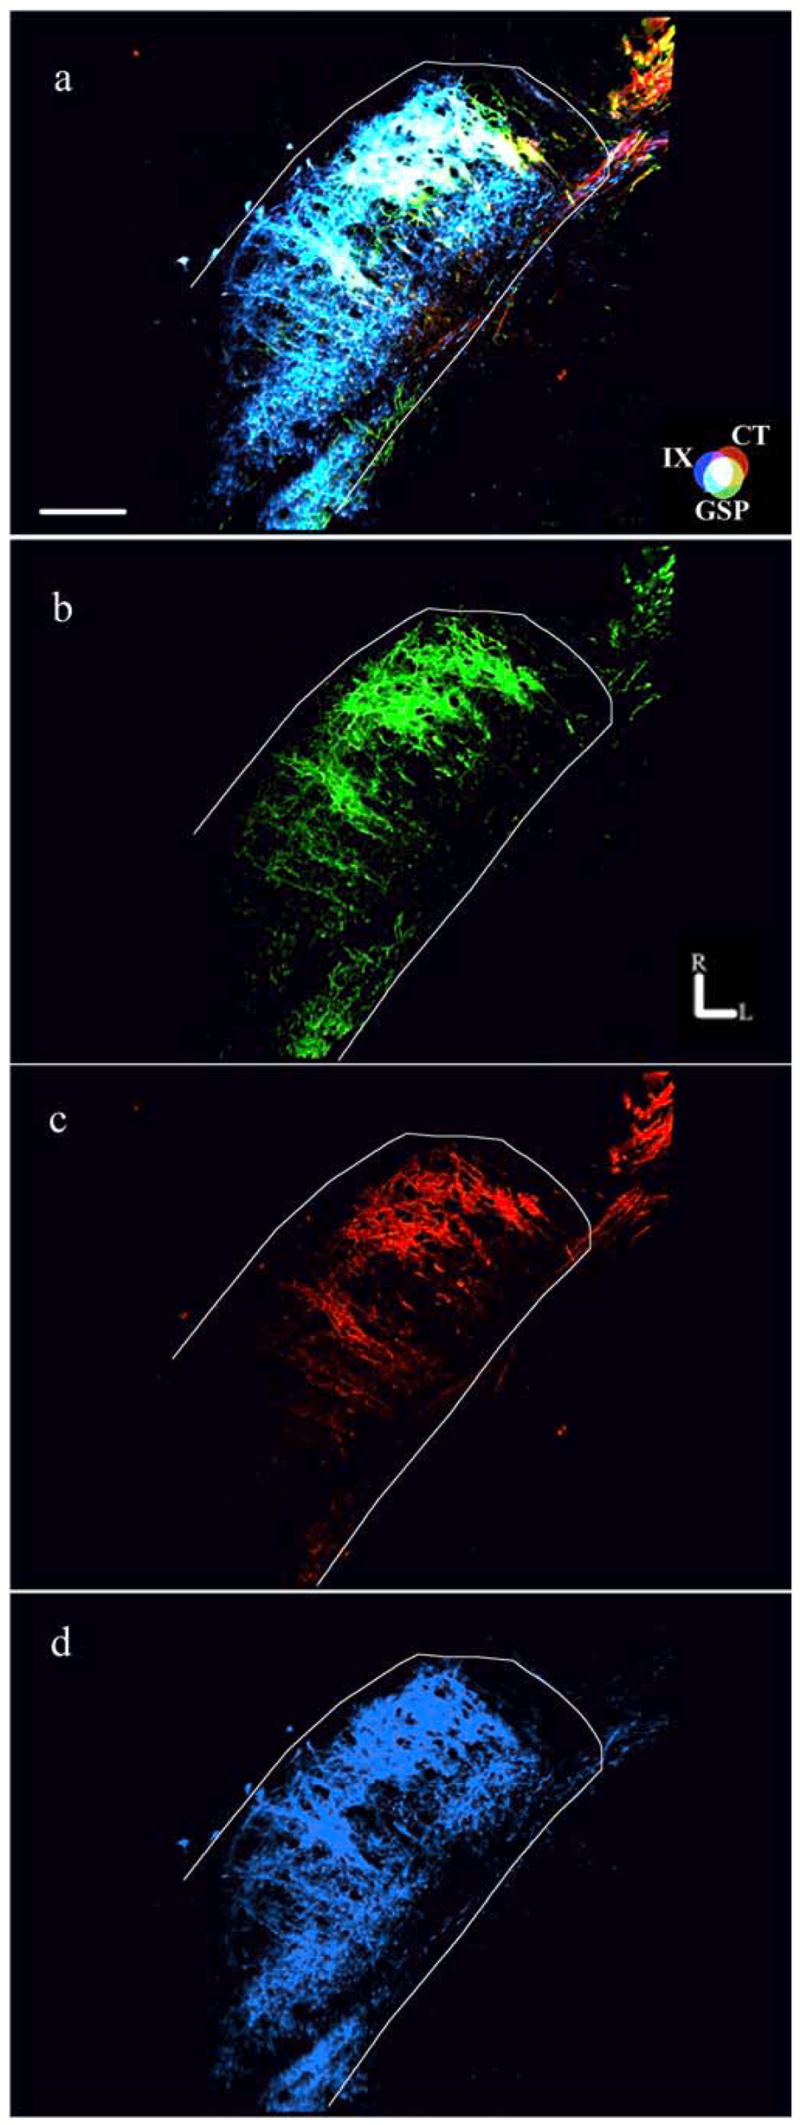
Components of fluorescent images used in analyses. Fluorescent photomicrographs showing the three merged terminal fields (a) and the component images of the GSP (green; b), CT (red; c), and IX (blue; d) terminal fields are shown. The approximate location of the NTS is outlined in white. The CT–GSP overlap is shown as yellow, the IX–GSP overlap is shown as blue-green, the IX–CT overlap is shown as magenta, and the CT–GSP–IX terminal field overlap is shown as white. Refer to the color guide in a. Rostral (R) and lateral (L) are indicated in b. Scale bar (in a), 200 μm.
Although volume measurements were not done “blind” to the experimental group, the reliability of the measures was checked and confirmed through a subset of measurements within each group. More importantly, the volumes obtained for control rats closely match previously reported values for the CT (King and Hill, 1991; Krimm and Hill, 1997) and GSP and IX (May and Hill, 2006) volumes. Therefore, multiple investigators, using different experimental protocols, report reliably consistent terminal field volumes.
For figure plates, Fireworks (Macromedia, San Francisco, CA), Volocity (Improvision, Lexington, MA), and Photoshop (Adobe Systems, San Jose, CA) were used to compose images from digital files in which all optical sections for each physical section were flattened into one plane. Images were enhanced in contrast and brightness for presentation purposes. No other digital image manipulations were used.
Statistical analysis
The mean ± SEM was determined for total nerve terminal field volume, total overlap among terminal fields, and volumes of terminals contained within dorsal, intermediate, and ventral zones. These variables were compared between rats fed the control diet, rats fed the sodium-restricted diet from E3 to E12, and rats fed the sodium-restricted from E3 to P28 using a one-way ANOVA and post hoc independent-samples t tests. In the post hoc analysis, the α level of 0.05 was partitioned among the three groups to avoid an inflated type I error rate. Statistical results from post hoc analysis with an α level of p < 0.05 are reported as significant.
IX nerve terminal field in the spinal trigeminal nucleus
Animals
Six additional adult (three rats fed the control diet, three rats fed the sodium-restricted diet from E3 to E12) Sprague Dawley rats (Harlan Sprague Dawley) were used to measure the volume of the IX nerve terminal field in the oral division of the spinal trigeminal nucleus. This was done as a follow-up experiment to determine whether the enlarged IX terminal field in the NTS of rats fed the sodium-restricted diet from E3 to E12 (see Results) also occurred in a projection area that does not receive gustatory inputs (i.e., receives tactile input).
Nerve labeling, tissue preparation, and scanning confocal image collection
Labeling the IX nerve and tissue preparation procedures were the same as described above. IX terminations in the spinal trigeminal nucleus were visualized, and the volumes were measured using scanning confocal microscopy as described above for the nerve terminal fields in the NTS.
Statistical analysis
Mean total IX terminal fields in the spinal trigeminal nucleus were compared between adult rats fed the control diet and adult rats fed the sodium-restricted diet from E3 to E12 and analyzed using independent-samples t tests. Statistical results with an α level of p < 0.05 are reported as significant.
NTS volume
Animals
Six additional adult (three rats fed the control diet, three rats fed the sodium-restricted diet from E3 to E12) Sprague Dawley rats (Harlan) were used to measure the volume of the NTS. Rats were deeply anesthetized intraperitoneally with 2.4 g/kg urethane (ethyl carbamate; Sigma-Aldrich) and perfused transcardially at ≥40 d of age with Krebs-Henseleit buffer, pH 7.3, followed by 8% paraformaldehyde, pH 7.2.
Tissue preparation and confocal microscope-transmitted light imaging
Brains were removed and postfixed in 8% paraformaldehyde overnight. The medulla was blocked and horizontally sectioned on a vibratome at 50 μm, collected, and prepared for imaging as described above. Sections were imaged on the scanning confocal microscope using the transmitted light function with the 488 nm argon laser. The NTS is relatively translucent within the brainstem and can be easily visualized within the medulla without staining. The boundaries of the nucleus were clearly determined in all images.
Data collection
The NTS volume was measured using Neurolucida computer software (version 4.34; MicroBrightField). To calculate volume, the measurements from all of the sections were summed and multiplied by 50 μm.
Statistical analysis
Mean total NTS volumes were compared between adult rats fed the control diet and adult rats fed the sodium-restricted diet from E3 to E12 and analyzed using independent-samples t tests. Statistical results with an α level of p < 0.05 are reported as significant.
Geniculate ganglion and petrosal ganglion cell number
Six additional adult rats fed the sodium-restricted diet from E3 to E12 had either the CT (n = 4) or the GSP (n = 2) nerve labeled as described previously, with the exception that Micro-Ruby dextran (Invitrogen) was used as the tracer. Three additional adult rats fed the sodium-restricted diet from E3 to E12 had the petrosal ganglia labeled with Micro-Ruby by way of the IX nerve. Micro-Ruby was used over other tracers because of its superior quality in labeling cells and imaging of whole ganglia. Each rat was perfused as described previously. The ganglia (geniculate for CT and GSP, petrosal for IX) were removed and postfixed in 8% paraformaldehyde overnight. Each ganglion was then dissected from either the VII or IX nerve, and the intact ganglion was imaged on the confocal microscope at 2 μm intervals using the 543 nm green HE/NE laser, generating an average of 50 optical sections through each ganglion (Shuler et al., 2004). All labeled neurons were physically counted with the aid of Neurolucida software (Shuler et al., 2004). We chose to label ganglia at adulthood because the ganglion cell number becomes stable at P20 with no further cell death or addition thereafter (Carr et al., 2005).
The ganglion cell number was compared between adult rats fed the control diet (Shuler et al., 2004; May and Hill, 2006) and adult rats fed the sodium-restricted diet from E3 to E12 and analyzed using independent-samples t tests. Statistical results with an α level of p < 0.05 were reported as significant.
CT nerve neurophysiology
Seven additional rats (four rats fed the control diet, three rats fed the sodium-restricted diet from E3 to E12) were deeply anesthetized with sodium pentobarbital (50 mg/kg Nembutal, i.p.). The animals were tracheotomized and placed on a circulating water heating pad to maintain body temperature. Hypoglossal nerves were transected bilaterally to prevent tongue movement, and the animal was placed in a nontraumatic head holder. The left CT nerve was isolated using a mandibular approach. The nerve was exposed near the tympanic bulla, cut, desheathed, and positioned on a platinum electrode. A second electrode was placed in nearby muscle to serve as ground. A mixture of petroleum jelly and mineral oil was placed in the cavity around the nerve. Whole CT activity was fed to a Grass Instruments (Quincy, MA) low-impedance input stage amplifier. The filtered signal was monitored with an audio loudspeaker and oscilloscope. The signal was integrated (time constant, 1.0 s) and was led to and analyzed with PowerLab Scope software (ADInstruments, Mountain View, CA).
Stimulation procedure
All chemicals were reagent grade and prepared in distilled water. Neural responses to a concentration series of 0.05, 0.1, 0.25, and 0.5 M NaCl, sodium acetate, and KCl were recorded. Each concentration series was bracketed by application of 0.5 M NH4Cl. In addition, responses were recorded to the nonsalt stimuli of 0.01N HCl, 0.01 M quinine hydrochloride, and 1.0 M sucrose. Solutions were applied to the tongue in 5 ml aliquots with a syringe and allowed to remain to the tongue for ~40 s. After each solution application, the tongue was rinsed with distilled water for ≥1 min. CT responses were calculated as follows: the height of the tonic response was measured 20 s after application, and response magnitudes were expressed as ratios relative to the mean of 0.5 M NH4Cl responses before and after stimulation. Response data were retained for analysis only when 0.5 M NH4Cl responses that bracketed a concentration series varied by < 10%.
Statistical analysis
Neurophysiological responses were compared between adult rats fed the control diet and adult rats fed the sodium-restricted diet from E3 to E12 and analyzed using independent-samples t tests. The α level was set at p < 0.05 and adjusted to compensate for the number of statistical tests conducted within a concentrations series.
Results
Organization of gustatory nerve terminal fields in rats fed the sodium-restricted diet from E3 to E12 compared with rats fed the control diet
Total terminal field volumes
As found previously in rats fed the control diet, the sequence of terminal fields in the NTS from the most dorsal horizontal to the most ventral horizontal section containing labeling was IX, GSP, and then CT (May and Hill, 2006). The same general sequence was seen in rats fed the sodium-restricted diet from E3 to E12, although the terminal fields were dramatically enlarged, resulting in a blurring of their distinct topographies. For example, the CT terminal field in rats fed the control diet was contained within an average of 270 μm (i.e., 5.5 horizontal sections), whereas rats fed the sodium-restricted diet from E3 to E12 had a CT terminal field that averaged 410 μm (8.2 sections). The increased number of labeled sections combined with a general increase in terminal field volume in each section yielded a mean total CT terminal field volume in rats fed the sodium-restricted diet from E3 to E12 that was four times larger than found in rats fed the control diet (Figs. 3a–h, 4) (F(2,18) = 24.2; post hoc p = 0.0001). The CT terminal field was not the only terminal field affected: the IX terminal field volume was approximately three times the volume of that found in rats fed the control diet (Figs. 3a–c,e–g, 4) (F(2,15) = 10.9; post hoc p = 0.002), and the GSP terminal field volume was double the size of rats fed the control diet (Figs. 3a–h, 4) (F(2,18) = 5.2; post hoc p = 0.01).
Figure 3.

Horizontal sections of merged images from dorsal through ventral sections in the rostral NTS. Fluorescent photomicrographs of rats fed the control diet (a– d), rats fed the sodium-restricted diet from E3 to E12 (e– h), and rats fed the sodium-restricted diet from E3 to P28 (i–l) are shown. The approximate location of the NTS is outlined in white. a, e, i, The most dorsal sections are characterized by the presence of the IX terminal field and GSP fibers in the solitary tract, except in rats fed the sodium-restricted diet from E3 to E12, where the CT terminal field can be seen (e). b, f, j, Dorsal sections contain all three terminal fields, with the most overlap occurring in rats fed the sodium-restricted diet from E3 to E12 (f). c, g, k, Intermediate sections are characterized by the densely labeled oval shape of the CT terminal field and retrogradely labeled cells of the salivatory nucleus, outside and medial to the NTS. Note that in both rats fed the restricted diet from E3 to E12 (g) and from E3 to P28 (k), the IX terminal field is present, whereas it normally does not project in rats fed the control diet (c). d, h, l, Ventral sections are characterized by the presence of the CT and GSP terminal fields and retrogradely labeled cells of the salivatory nucleus. See Results for a full description of zone determination. Nerve terminal field and overlap colors are the same as noted in Figure 2 and are shown on the color guide in a. Rostral (R) and lateral (L) are indicated in c. Scale bar (in b), 200 μm.
Figure 4.
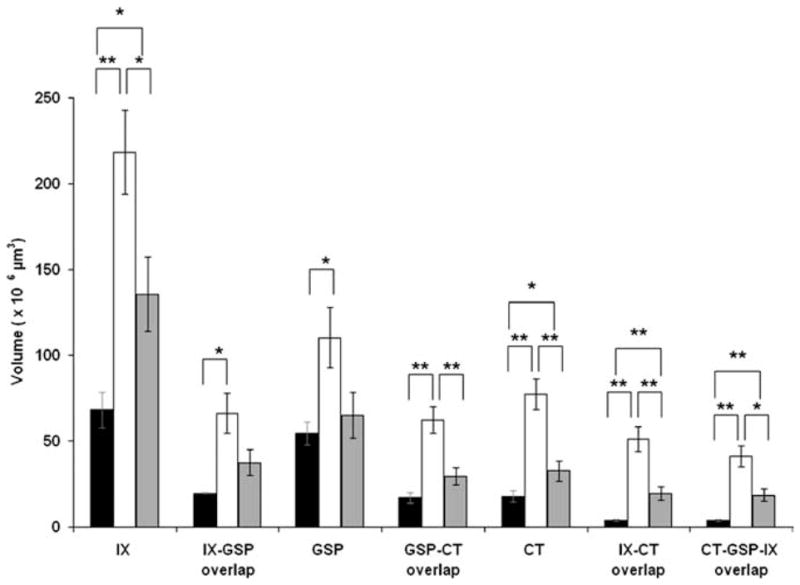
Mean total terminal field volumes. Bars denote the mean total volume (± SEM) of the terminal field and terminal field overlap of control (black bars), rats fed the sodium-restricted diet from E3 to E12 (white bars), and rats fed the restricted diet from E3 to P28 (gray bars). Note that the fields of overlap are inclusive within the total terminal field volume. *p < 0.05; **p < 0.01.
Because there were dramatic increases in all terminal fields that invaded territory not normally occupied in rats fed the control diet, we explored whether there was more overlap in rats fed the sodium-restricted diet from E3 to E12. In rats fed the control diet, the CT terminal field overlapped considerably with the GSP terminal field but relatively little with the IX terminal field (Figs. 3c, 4). The overlap between the GSP and IX terminal fields was intermediate to that with the CT, respectively (Figs. 3b, 4) (May and Hill, 2006). In stark contrast, the CT–GSP terminal field overlap in rats fed the sodium-restricted diet from E3 to E12 was triple that of rats fed the control diet, because of the more dorsal extension of the CT field and the enlarged GSP field (Figs. 3e–h, 4) (F(2,18) = 17.4; post hoc p = 0.0001). As a result of the increased volumes of both IX and GSP terminal fields, the IX–GSP overlap was three times larger in rats fed the sodium-restricted diet from E3 to E12 compared with rats fed the control diet (Figs. 3a–c,e–g, 4) (F(2,15) = 5.8; post hoc p = 0.02). In addition, the ventral extension of the IX field into the intermediate zone and the more dorsal projection of the CT field yielded a IX–CT overlap in rats fed the sodium-restricted diet from E3 to E12 that was >10 times greater than seen in rats fed the control diet (Figs. 3a–c,e–g, 4) (F(2,15) = 16.8; post hoc p = 0.001). Accordingly, CT–GSP–IX overlap was also larger in these rats (Figs. 3a–c,e–g, 4) (F(2,15) = 14.0; post hoc p = 0.001).
Zonal distribution of terminal fields
To localize regions especially susceptible to the dietary manipulation and to be consistent with our previous studies of the CT terminal field in the NTS (King and Hill, 1991; Krimm and Hill, 1997; May and Hill, 2006; Sollars et al., 2006), the NTS was divided into dorsal, intermediate, and ventral zones. The dorsal zone contained sections in which the solitary tract was most visible and included sections in which the fourth ventricle occupied the largest mediolateral extent (Fig. 5a,b). The dorsal zone was further characterized by the spinal trigeminal tract extending to approximately the rostralmost extent of the NTS and by the lack of the hypoglossal nucleus and the facial nucleus (Fig. 5a,b, facial nucleus not shown). This was the largest of the three zones, encompassing almost the entire IX terminal field in rats fed the control diet (Fig. 3a,b). In rats fed the control diet, this zone typically consisted of four to five 50 μm sections and was distinguished by the rounded shape of the CT terminal field (Fig. 3a,b,e,f,i,j). The intermediate zone (usually two 50 μm sections) was characterized by the decrease in the fourth ventricle volume compared with the dorsal zone, by the dorsal extent of the hypoglossal nucleus, by the extension of the spinal trigeminal tract rostrally beyond the inferior cerebellar peduncle, and by the presence of the dorsal extent of the facial nucleus (Fig. 5c, facial nucleus not shown). In all animals, regardless of group, the terminal fields of the CT and GSP nerves in the intermediate zone was most easily identified and most consistent across animals (Fig. 3c,g,k). To provide another referent, this zone is ~1.5 mm ventral to the surface of the medulla, 1.5 mm lateral from the midline, and 2.5 mm rostral from obex. The ventral zone of the gustatory terminal fields (usually three to four 50 μm sections) had an expanded hypoglossal nucleus and facial nucleus compared with the intermediate sections (Fig. 5d). Dividing the fields in this manner highlights the vastly different distribution of terminations along the dorsoventral aspect of the NTS and more narrowly defines specific regions of anatomical change. Compartmentalizing terminal fields into zones also demonstrates the similar characteristics and contiguous and overlapping arrangement of the three afferent terminal zones.
Figure 5.

Myelin-stained brainstem sections from a rat fed the control diet. a– d illustrates the shape of the NTS and other brainstem structures at the respective dorsal-to-ventral level to the fluorescent images in Figure 3. The NTS is outlined in black, and black arrows point to the solitary tract. Rostral (R) and lateral (L) are indicated. 4V, Fourth ventricle; 12, hypoglossal nucleus; DCN, dorsal cochlear nucleus; icp, inferior cerebellar peduncle; Sp5, spinal trigeminal nucleus; sp5, spinal trigeminal tract; VCN, ventral cochlear nucleus. Scale bar (in a), 1 mm.
It must be pointed out that we use the terms “dorsal,” “intermediate,” and “ventral” zones here to be consistent with previous reports (King and Hill, 1991; Krimm and Hill, 1997; May and Hill, 2006; Sollars et al., 2006). However, the orientation of the NTS within the brainstem is such that the caudalmost portion of the NTS is dorsal to the rostralmost portion (i.e., the NTS expands ventrally and rostrally from the dorsalmost extent of the NTS) (Fig. 6). Therefore, the dorsal zone more accurately represents the dorsocaudal portion of the field in the NTS, and the intermediate and ventral sections represent a more ventrorostral portion of the terminal field in the NTS (Fig. 6). Similar to previous reports that instituted a low-NaCl diet early in development, most of the reorganization induced by feeding the sodium-restricted diet at E3–E12 occurred in the more dorsal horizontal sections of the NTS. The effects, however, were more widespread in rats fed the sodium-restricted diet from E3 to E12 than ever seen before. These rats had irregularly shaped CT terminal fields that were about six times larger than rats fed the control diet in the dorsal zone (Figs. 3a,b,e,f, 7) (F(2,18) = 21.3; post hoc p = 0.002). Moreover, the CT terminal field volume in the intermediate zone was also larger than rats fed the control diet and was characterized by a more caudal expansion of the terminal field (Figs. 3c,g, 7) (F(2,18) = 10.4; post hoc p = 0.003). An elaboration of IX and GSP terminal fields was also evident. Because of the mediolateral and rostrocaudal expansion of the field, the IX terminal field of rats fed the sodium-restricted diet from E3 to E12 was larger in the dorsal zone (Figs. 3a,b,e,f, 7) (F(2,15) = 11.3; post hoc p = 0.002) compared with rats fed the control diet, and the dorsal (Figs. 3a,b,e,f, 7) (F(2,18) = 5.5; post hoc p = 0.01) and intermediate (Figs. 3c,g, 7) (F(2,18) = 3.5; post hoc p = 0.04) zones of the GSP terminal field were also significantly greater than rats fed the control diet.
Figure 6.
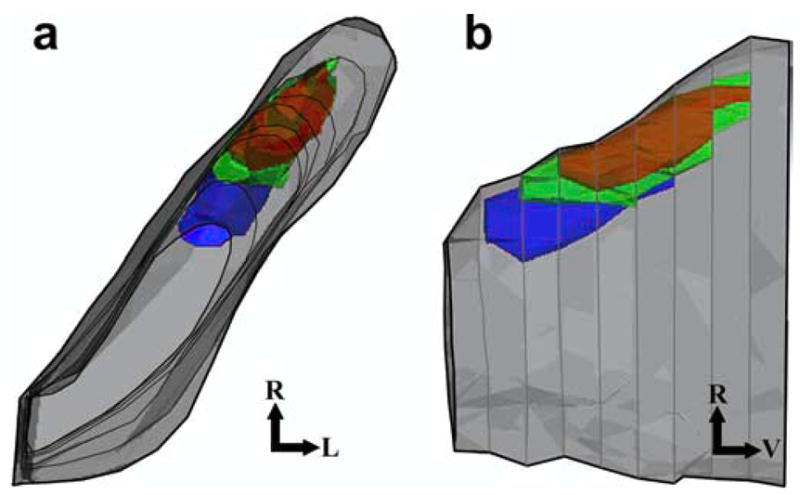
Three-dimensional representation of the three primary afferent terminal fields in the NTS of rats fed the control diet from a dorsal (a) and a lateral (b) view. Terminal fields and overlap of fields are shown with respect to the NTS. The CT terminal field is shown in red, the GSP terminal field is shown in green, the IX terminal field is shown in blue, and the NTS is shown in gray. Note the rostral positions of the terminal fields relative to the entire NTS. This figure does not reproduce actual data; it is a representation of what is typically seen in an adult rat fed the control diet. Rostral (R), lateral (L), and ventral (V) are indicated.
As expected from the volumes of each terminal field, most of the alterations related to zones of overlap were in the dorsal zone. For example, the overlap among terminal fields in the dorsal zone was significantly larger than in rats fed the control diet (Figs. 3a,b,e,f, 7): GSP–CT overlap (F(2,18) = 17.2; post hoc p = 0.0001), IX–CT overlap (F(2,15) = 16.6; post hoc p = 0.001), IX–GSP overlap (F(2,15) = 5.9; post hoc p = 0.02), CT–GSP–IX overlap (Figs. 3a,b,e,f, 7) (F(2,15) = 14.5; post hoc p = 0.001). In addition, the GSP–CT overlap was also significantly larger in the intermediate zone in rats fed the sodium-restricted diet from E3 to E12 compared with rats fed the control diet (Figs. 3c,g, 7) (F(2,18) = 7.3; post hoc p = 0.005).
Figure 7.

Mean zonal terminal field volumes. Zonal distribution of mean (± SEM) terminal field volumes of the GSP, CT, and IX nerves and corresponding overlap in the NTS of rats fed the control diet (black bars), rats fed the sodium-restricted diet from E3 to E12 (white bars), and rats fed the sodium-restricted diet from E3 to P28 (gray bars) are shown. Top, Dorsal zone; middle, intermediate zone; bottom, ventral zone. The most dramatic increases in terminal field volume in both experimental groups are contained within the dorsal zone. *p < 0.05; **p < 0.01.
Comparison with recovery from long-term sodium restriction: less is more
As a comparison with rats that were sodium restricted during a 9 d early prenatal period, we examined the effects of feeding the sodium-restricted diet to include postnatal periods. Contrary to the widespread differences evident in rats fed the sodium-restricted diet from E3 to E12, rats that received the sodium-restricted diet from E3 to P28 and were then fed the control diet for at least 3 weeks displayed selective differences in total terminal field volume and exclusively in the dorsal zone. The average dorsal to ventral sections containing the terminal field label was 370 μm (i.e., 7.4 sections) compared with 270 and 410 μm for rats fed the control diet and rats fed the sodium-restricted diet from E3 to E12, respectively.
Similar to the terminal fields in rats fed the control diet and rats fed the sodium-restricted diet from E3 to E12, the IX terminal field projected to the dorsalmost horizontal section, followed ventrally by the GSP and the CT projections. However, the topography of the CT terminal field in rats fed the sodium-restricted diet from E3 to P28 was different from both control and rats fed the sodium-restricted diet from E3 to E12: CT terminal field projections extended 100 μm farther than rats fed the control diet in the dorsal to ventral axis, but 50 μm less than rats fed the sodium-restricted diet from E3 to E12. This yielded a mean total CT terminal field volume in rats fed the sodium-restricted diet from E3 to P28 that was double the volume of rats fed the control diet (Figs. 3b–d,f–h, 4) (F(2,18) = 24.2; post hoc p = 0.04) but only half the volume of rats fed the sodium-restricted diet from E3 to E12 (Figs. 3e–h,j–l, 4) (p = 0.003). A similar pattern emerged for IX total terminal field volume: rats fed the sodium-restricted diet from E3 to P28 had IX terminal fields double the size of rats fed the control diet (Figs. 3a,b,i,j, 4) (F(2,15) = 10.9; post hoc p = 0.04) but smaller than rats fed the sodium-restricted diet from E3 to E12 (Figs. 3e–h,i–k, 4) (p = 0.04).
In contrast to rats fed the sodium-restricted diet from E3 to E12, those fed the diet from E3 to P28 displayed differences in terminal field volume only in the dorsal zone. Specifically, the mean dorsal volume of CT terminal field was triple that of rats fed the control diet (Figs. 3b,j, 7) (F(2,18) = 21.3; post hoc p = 0.02), and the IX terminal field was double that of rats fed the control diet (Figs. 3a,b,i,j, 7) (F(2,15) = 11.3; post hoc p = 0.04); both means were significantly smaller than dorsal CT and IX terminal field volumes in rats fed the sodium-restricted diet from E3 to E12.
Because of the significantly larger CT and IX terminal fields in rats fed the sodium-restricted diet from E3 to P28, we also examined the overlap among terminal fields. As a result of the enlarged IX and CT terminal fields, the IX–CT overlap was approximately five times greater in rats fed the sodium-restricted diet from E3 to P28 than in rats fed the control diet (Figs. 3k, 4) (F(2,15) = 16.8; post hoc p = 0.01) but half the size of the IX–CT overlap found in rats fed the sodium-restricted diet from E3 to E12 (Figs. 3e–g, 4) (p = 0.006). CT–GSP–IX overlap was also significantly larger in rats fed the restricted diet from E3 to P28 (Figs. 3j,k, 4) (F(2,15) = 14.0; post hoc p = 0.01) but, again, half the volume of rats fed the sodium-restricted diet from E3 to E12 (Figs. 3e–g,j,k, 4) (p = 0.02).
Because of the enlarged CT and IX terminal field in the dorsal zone of rats fed the sodium-restricted diet from E3 to P28, dorsal zone CT–GSP overlap (F(2,18) = 17.2; post hoc p = 0.03) and IX–CT overlap (Figs. 3j, 7) (F(2,18) = 16.6; post hoc p = 0.01) were significantly larger than that of rats fed the control diet. Consequently, CT–GSP–IX overlap was also larger, again exclusively in the dorsal zone (Figs. 3i,j, 7) (F(2,15) = 14.5; post hoc p = 0.01). Not surprisingly, the GSP–CT overlap (p = 0.01), IX–CT overlap (p = 0.006), and CT–GSP–IX overlap (Figs. 3e–h,i–l, 4) were smaller than that of rats fed the sodium-restricted diet from E3 to E12.
An analysis of enlarged terminal fields as they relate to NTS subnuclei: coronal sections
To further illustrate the overlapping terminal fields and the group-related differences, we labeled the three nerves as described previously in a rat fed the control diet, in a rat fed the sodium-restricted diet from E3 to E12, and in a rat fed the sodium-restricted diet from E3 to P28 and viewed the fields in coronally sectioned tissue. Terminal field labeling and imaging of the GSP, CT, and IX nerves were done as described for the horizontally sectioned tissue in the rat fed the control diet (Fig. 8a–d), in the rat fed the sodium-restricted diet from E3 to E12 (Fig. 8g–j), and in the rat fed the restricted diet from E3 to P28 (Fig. 8m–p). One optical section using transmitted light was also imaged to show the respective terminal fields overlayed with the approximate location of the subnuclei (Fig. 8e, control, k, E3–E12, q, E3–P28). Finally, each section was mounted on slides and subsequently stained with cresyl violet to show the NTS and other dorsal medullary structures (Fig. 8f, control, l, E3–E12, r, E3–P28). No measurements were taken from coronal sections; they are used to examine terminal field organization in the coronal plane only.
Figure 8.
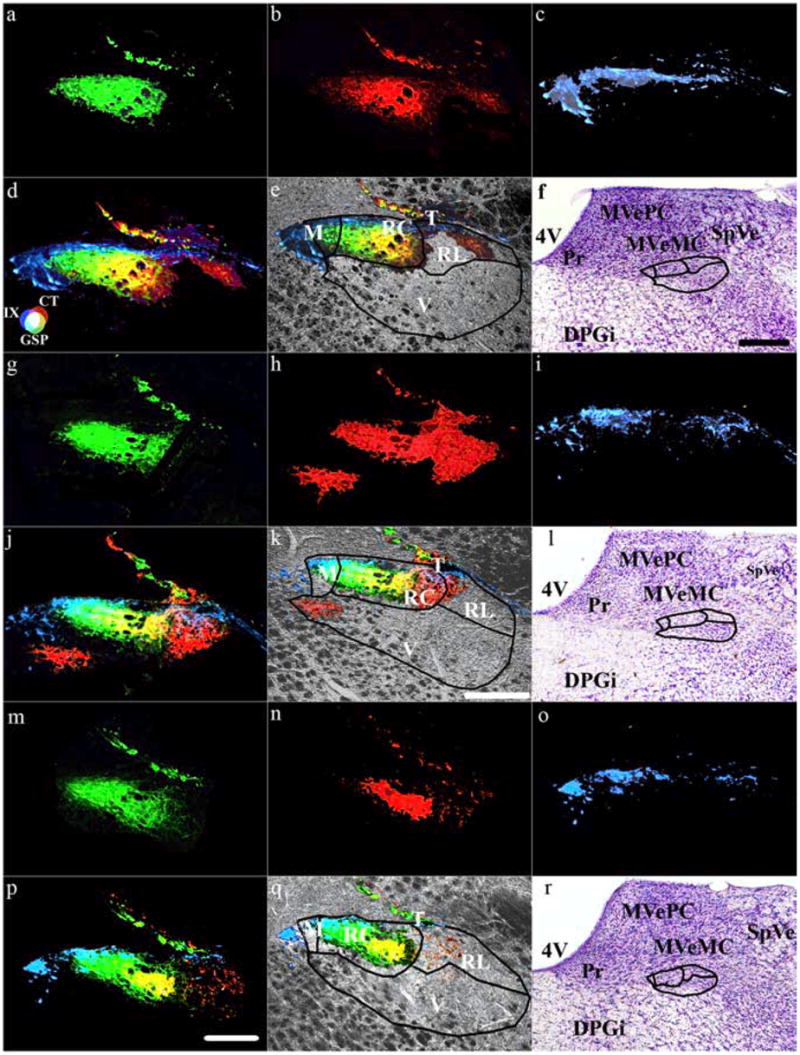
Terminal fields within subdivisions of the NTS. Coronal sections through the rat medulla in rats fed the control diet (a–f) and rats fed the sodium-restricted diet from E3 to E12 (g–l) and from E3 to P28 (m–r) show the terminal field for the GSP (a, g, m), CT (b, h, n), and IX (c, i, o) nerves. d, j, p, Merged terminal fields. e, k, q, Merged image superimposed on an image of the brainstem obtained through the transmitted light channel on the confocal laser microscope system. f, l, r, Nissl-stained tissue illustrating the location of the NTS relative to other brainstem structures. Lines in e, f, k, l, q, and r demarcate the approximate boundaries of the subdivisions in the NTS as described by Halsell et al. (1996). h, i, k, Note that the CT terminal field in rats fed the sodium-restricted diet from E3 to E12 invades inappropriate NTS subnuclei. Refer to the color guide in d to identify individual fields and overlap among different terminal fields. Scale bars: (in p) a– d, g–j, m–p, 200 μm; (in k), e, k, g, 200 μm; (in f) f, l, r, 500 μm. T, Solitary tract; M, medial subdivision of the NTS; RC, rostrocentral subdivision of the NTS; V, ventral subdivision of the NTS; RL, rostrolateral subdivision of the NTS; 4V, fourth ventricle; DPGi, dorsal paragigantocellular nucleus; MVeMC, medial vestibular nucleus magnocellular; MVePC, medial vestibular nucleus parvocellular; Pr, principal nucleus; SpVe, spinal vestibular nucleus.
The photomicrographs shown in Figure 8 were ~400 μm caudal from the anteriormost extent of the NTS (also see Fig. 3). Thus, sections used here to illustrate the diet-related effects were from the caudal “rostral” pole, which also contains the intermediate zone of the NTS (Halsell et al., 1996). Examination of sections rostral and caudal to the ones shown in Figure 8 emphasize the group-related differences best appreciated through horizontal sections (Fig. 3). For example, more rostral sections would better show the differences in the GSP field, and more caudal sections would best illustrate differences in the IX field. Sections shown in Figure 8 best illustrate the unusual arrangement of the CT. Specifically, the CT terminal field in rats fed the sodium-restricted diet from E3 to E12 (Fig. 8h) was much larger than seen in rats fed the control diet (Fig. 8b) and in rats fed the sodium-restricted diet from E3 to P28 (Fig. 8n). Moreover, the distinct overlap of the three fields can be readily seen in Figure 8, d, j, and p, corresponding to rats fed the control diet and to rats fed the sodium-restricted diet from E3 to E12 and from E3 to P28, respectively. Finally, what was particularly surprising was how the CT field extended beyond the medial and rostral central subnuclei in rats fed the sodium-restricted diet from E3 to E12 (Fig. 8k) and in rats fed the diet from E3 to P28 (Fig. 8q). This is particularly noticeable in the rat fed the restricted diet from E3 to E12, where the CT terminal field extends into the ventral subdivision of the NTS (Fig. 8j,k). Although the match is not exact, perhaps because of different animals, the “displaced” area of the CT field would likely extend beyond that shown in Figure 3h. (Not all labeled sections are shown in Fig. 3.) It should be noted that the boundaries for the subdivision of NTS subnuclei shown in Figure 8 are similar to those shown by Halsell et al. (1996); the exact boundaries may differ slightly from the boundary shown.
IX nerve terminal field in the spinal trigeminal nucleus
The IX nerve carries a significant tactile component (Frank, 1968) and sends terminations to both the NTS and spinal trigeminal nucleus in the brainstem (Contreras et al., 1982; Bradley et al., 1985; Sweazey and Bradley, 1986). Because the IX terminal field is greatly enlarged in the NTS of rats fed the sodium-restricted diet from E3 to E12, we examined the IX terminal field in the spinal trigeminal nucleus and found that there was no difference in the total spinal trigeminal IX terminal field volume between rats fed the control diet and rats fed the sodium-restricted diet from E3 to E12 (31.3 ± 6.4 and 35.2 ± 5.9, respectively; p > 0.05) (Fig. 9). Figure 9 shows a representative horizontal section in a rat fed the control diet in which the IX terminal field (shown in blue) is superimposed over an image of the lateral medulla. The section is ~100 μm ventral to where the largest IX projection into the NTS is seen.
Figure 9.
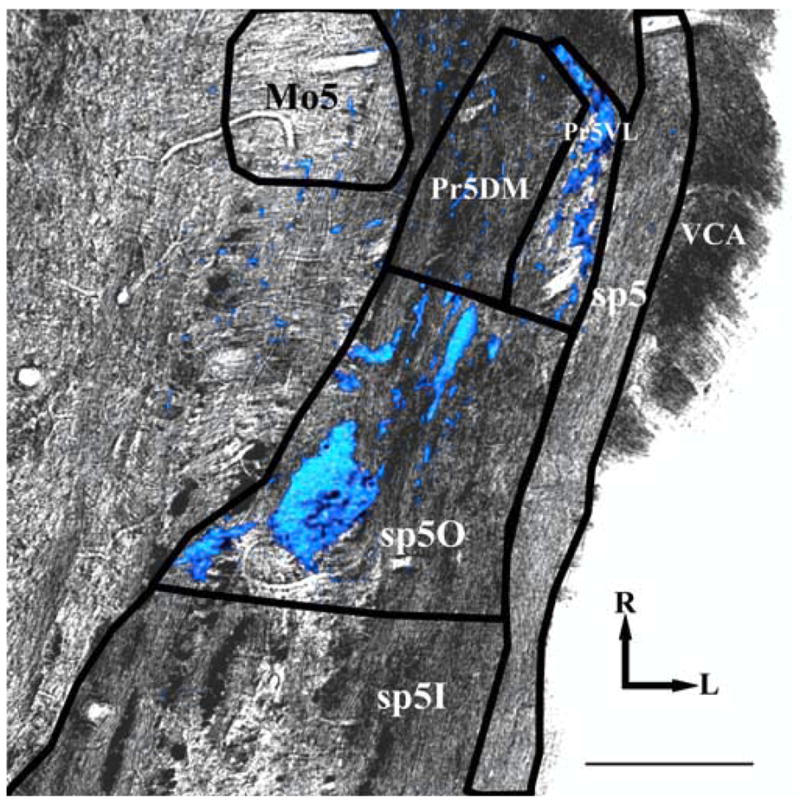
The IX terminal field in the spinal trigeminal nucleus. The IX terminal field is shown in blue and overlayed on a transmitted light image of a horizontal section through the lateral medulla. Both images were acquired at 10× magnification. Mo5, Motor trigeminal nucleus; Pr5VL, principal sensory nucleus, ventrolateral; Pr5DM, principal sensory nucleus, dorsomedial; sp5O, spinal trigeminal nucleus, oral; sp5I, spinal trigeminal nucleus, interpolar; sp5, spinal trigeminal tract; VCA, ventral cochlear nucleus, anterior. Rostral (R) and lateral (L) are indicated. Scale bar, 200 μm.
Body weights and NTS volume
Birth weights and body weights of rats fed the sodium-restricted diet from E3 to E12 and rats fed the control diet were similar (P3, 9.4 ± 0.6 and 8.8 ± 0.6 g; P35, 116.7 ± 6.7 and 112.4 ± 10.6 g; p > 0.05), as were the mean total NTS volumes (9.5 ×10⁸ ± 0.03 and 9.8 ×10⁸ ± 0.06 μm3; p > 0.05). In contrast, pups that were fed the sodium-restricted diet from E8 through adulthood (i.e., like the current rats fed the restricted diet from E3 to P28) weighed less at birth and at adulthood and had smaller NTS volumes (May and Hill, 2006). When rats fed the sodium-restricted diet were fed the control diet at P28, they underwent remarkable weight gain and somatic growth. As a result of the rapid growth after repletion, rats fed the sodium-restricted diet from E3 to P28 had NTS sizes that caught up to rats fed the control diet (King and Hill, 1991). Therefore, for both rats fed the sodium-restricted diet from E3 to E12 and from E3 to P28, NTS volumes were similar to that in rats fed the control diet when afferent nerve labeling was done at adulthood.
Ganglion cell number
Because sodium repletion occurs when ganglion cells are being born (Altman and Bayer, 1982), the enlarged CT, GSP, and IX terminal fields may be caused by an increase in the number of ganglion cells projecting to the NTS (i.e., normal developmental cell death may have been affected by the dietary manipulation). This, however, did not occur for any of the cell populations. The geniculate ganglion cell numbers in rats fed the sodium-restricted diet from E3 to E12 were not different from rats fed the control diet for the CT nerve (451.5 ± 14.2 and 487.9 ± 37.9; p ≥ 0.05) (Shuler et al., 2004) or the GSP nerve (414.5 ± 13.4 and 430 ± 102.3; p ≥ 0.05) (May and Hill, 2006). Similarly, the petrosal ganglion cell number was also unaffected for the IX nerve (restricted diet from E3 to E12, 1003.5 ± 159.1; control diet, 1192.0 ± 156.4; p ≥0.05) (May and Hill, 2006).
The increased ganglion cell number is not an issue in rats fed the sodium-restricted diet from E3 to P28, because rats that are sodium restricted throughout development and adulthood do not have CT, GSP, or IX ganglion cells that are different in number from rats fed the control diet (May and Hill, 2006). Therefore, because geniculate ganglion cell addition and death is complete before P28 (i.e., P20) (Carr et al., 2005), rats fed the sodium-restricted diet from E3 to P28 would have cell numbers comparable to lifetime sodium-restricted rats.
CT nerve physiology
To test the hypothesis that the enlarged terminal fields in rats fed the sodium-restricted diet from E3 to E12 were attributable to altered afferent signals, as proposed to occur in rats fed the sodium-restricted diet from E3 through adulthood (Sollars et al., 2006), we recorded taste responses from the CT nerve in rats fed the sodium-restricted diet from E3 to E12 and in rats fed the control diet. In response to a concentration series of NaCl, sodium acetate, NH4Cl, and KCl, there were no group-related differences in response magnitudes (p < 0.05). Figure 10 illustrates the similar response–concentration curves for NaCl between the rats fed the sodium-restricted diet from E3 to E12 and rats fed the control diet obtained from this study. For comparison, Figure 10 also shows the attenuated relative responses to NaCl in rats fed the sodium-restricted diet from E3 through adulthood [E3 to adulthood restricted data are taken from Hill (1987)]. We conclude from these recordings that neurophysiological taste responses, at least carried by the CT nerve, are not affected at early adulthood by an early period of dietary sodium restriction.
Figure 10.
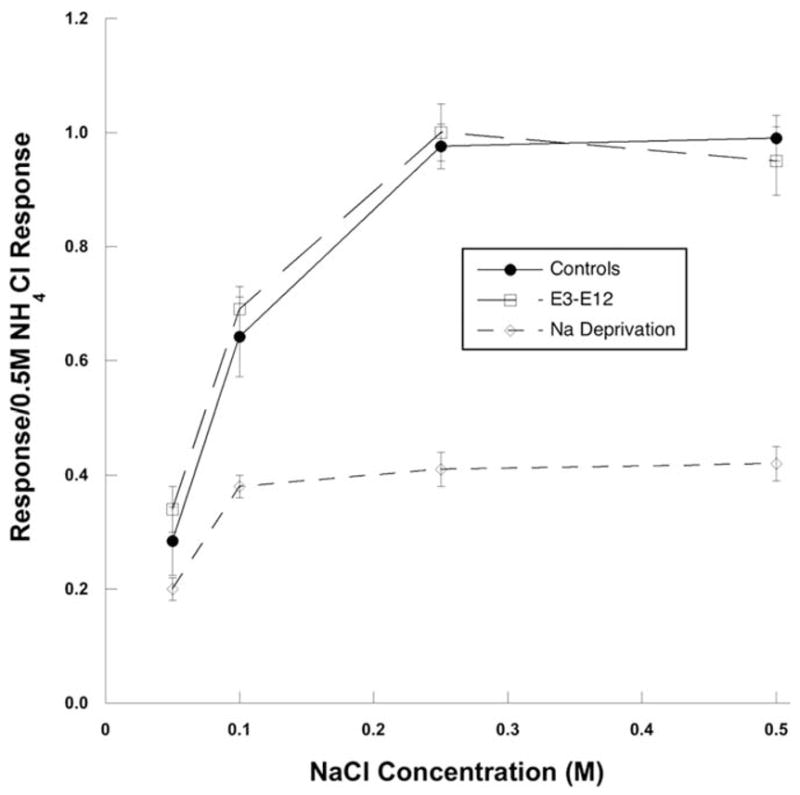
Neurophysiological taste responses to NaCl. Mean (± SEM) response– concentration functions from the whole CT nerve in adult rats fed the control diet (filled line, filled circles) and rats fed the sodium-restricted diet from E3 to E12 (dashed line, open squares) are shown. Responses are also shown for the CT nerve in rats fed the sodium-restricted diet from E3 through adulthood [short dashed line, open diamonds; data taken from Hill (1987)] to show the attenuated NaCl response in rats fed the sodium-restricted diet from E3 to P28 at the time of sodium repletion. At adulthood, rats fed the sodium-restricted diet from E3 to E12 had similar taste responses as rats fed the control diet and much different than rats sodium restricted throughout development.
Discussion
The current study shows that the terminal fields of three nerves that carry gustatory information are radically restructured when a diet deficient in sodium is instituted during an early prenatal period. Nine days of feeding this diet leads to as much as a 10 times enlargement of afferent terminal fields of the CT, GSP, and IX nerves in the adult rat NTS, with the greatest effects in the dorsalmost zones (Fig. 11). The enlarged terminal fields not only encompass a larger portion of the NTS normally occupied in rats fed the control diet, they also appear to invade subnuclei that typically do not receive gustatory nerve inputs. This extensive brainstem reorganization is independent of changes in the number of projection neurons, the size of the target, and of afferent activity; none of these measures in adult rats fed the sodium-restricted diet from E3 to E12 were different from rats fed the control diet. Furthermore, the effects of the early dietary manipulation on the IX terminal field are specific to the gustatory brainstem, because IX terminal field in the spinal trigeminal nucleus is unaffected.
Figure 11.
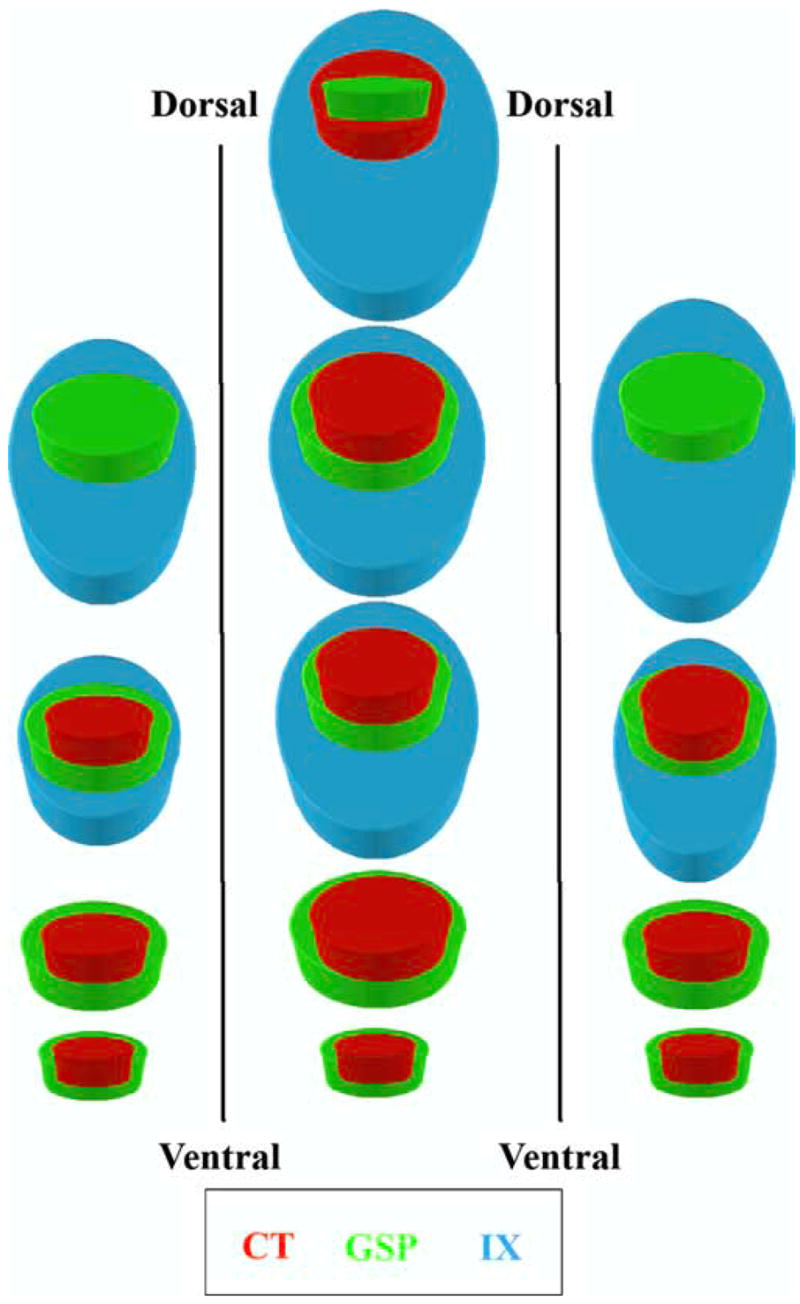
Summary model of terminal field organization. A model of terminal field organization through the dorsoventral extent of horizontal sections from the right NTS in rats fed the control diet (left column), rats fed the sodium-restricted diet from E3 to E12 (middle column), and rats fed the sodium-restricted diet from E3 to P28 (right column). Overlapping fields are represented at four levels along the dorsoventral axis. Note that there are dorsal sections that contain the terminal field in rats fed the sodium-restricted diet from E3 to E12 that are not present in the other two groups. See Results for details of the overlap among the three fields and a comparison of diet-related differences. Refer to the color key to identify individual fields among different terminal fields. Inclusion of a colored figure within another denotes overlap among the multiple terminal fields. Note that because of the orientation of the NTS within the brainstem, the term dorsal section refers to dorsocaudal, and ventral refers to ventrorostral, as depicted in Figure 6.
In contrast to the pervasive effects observed in rats that were fed the sodium-restricted diet from E3 to E12, rats fed the diet from E3 to P28 displayed a selective and less extensive reorganization of terminal fields in the NTS. Specifically, the terminal field volumes of the CT and IX nerves were two times greater than rats fed the control diet and the GSP terminal field was unaffected. These findings are similar to results from rats that are fed the sodium-restricted diet throughout their development (May and Hill, 2006). Consequently, the briefer period of feeding the sodium-restricted diet leads to more dramatic effects on these measures than the longer period of dietary manipulation.
We must emphasize here that we are comparing the effects of two different diets: a custom diet that is low in sodium compared with a commercially available sodium-replete diet (see Materials and Methods). The diets are not matched for all dietary components. However, we believe that the effects are secondary to low sodium and may be more likely attributable to the effects of malnourishment during key periods of brainstem development (see below).
The period of greatest terminal field changes: an indicator of activity-independent mechanisms
These effects are remarkable, because the 9 d period in which the sodium-restricted diet was fed occurs before many milestones in peripheral and central gustatory development. Some of these milestones include formation of tongue (Mistretta, 1972), projection of ganglion cells to their peripheral and central targets (Zhang and Ashwell, 2001b), and significant brainstem development (Zhang and Ashwell, 2001a). This period does, however, occur during a crucial time in gustatory system development, when geniculate ganglion cells are at their peak proliferation rate (E12) and during the differentiation of brainstem nuclei (E11–E16) (Altman and Bayer, 1982). One explanation for the enlarged terminal fields is that feeding the low-sodium diet during this developmental period causes a change in the number of ganglion cells that are born, or in the number of cells that survive and subsequently project to their targets. As noted previously, however, this is not the case; geniculate and petrosal ganglion cell numbers do not differ from rats fed the control diet.
Because the changes cannot be explained by peripheral taste function or anatomy, the effects seen in rats fed the sodium-restricted diet from E3 to E12 may be attributable primarily to activity-independent mechanisms, contrasting with that proposed for the CT nerve of rats fed the sodium-restricted diet throughout their lifetime (Sollars et al., 2006). Enlarged CT terminal fields found in rats fed the restricted diet on or before E8 throughout development and adulthood may result from the lack of pruning of exuberant synapses as a consequence of highly attenuated taste responses of the CT nerve (Hill, 1987; Sollars et al., 2006). This is consistent with similar observations in other sensory systems (Schlaggar et al., 1993; O’Leary et al., 1995; Catalano and Shatz, 1998). Once past the period in which afferent activity prunes terminal fields (i.e., past the critical period), the system remains “frozen” in the immature state. This would most likely occur for rats fed the sodium-restricted diet from E3 to P28. In comparison, rats fed the diet from E3 to E12 were never exposed to the sodium-restricted diet, except via their mothers (McClellan and Novak, 2001), and appear to have a normal physiological response to sodium salt stimuli. Thus, mechanisms directly related to afferent activity seem unlikely because the control diet was fed long before the system is functional.
Moreover, our preliminary data show dramatic developmental differences between rats fed the sodium-restricted diet from E3 to E12 and long-term restricted or control rats; rats fed the sodium-restricted diet from E3 to E12 progressively expand terminal fields after birth, whereas the other two groups begin with enlarged fields at early postnatal ages that then decrease in size (Mangold and Hill, 2006). This developmental difference highlights the dramatic cellular/molecular differences between rats fed the sodium-restricted diet from E3 to E12 and from E3 to P28. Although we think it is unlikely, the distinct possibility exists that possible group-related neurophysiological differences prenatally may influence central gustatory development similar to that seen in the visual system (Shatz, 1996; Penn and Shatz, 1999).
Potential hormonal/growth factor-related mechanisms
Mechanisms contributing to the effects noted here may relate to hormonal and/or growth factors acting on, or present in, the developing fetus. For example, maternal undernutrition reduces fetal levels of 11β-hydroxysteriod dehydrogenase type 2, which is present in the fetal rat medulla during our dietary manipulation (Diaz et al., 1998). A decrease in this enzyme causes an increase in maternal glucocorticoid levels (Fleming et al., 2004; Owen et al., 2005), leaving the fetus vulnerable to the effects of excess maternal glucocorticoids (Fleming et al., 2004; Fujioka et al., 2006).
Other key examples in which hormonal and/or growth factors impact brainstem development relate to insulin and insulin-like growth factors (IGFs) (Barker, 1997; Lee et al., 1999). Fetal insulin, IGF, and glucose concentrations rapidly fall during maternal undernutrition (Barker, 2001), although the link between available nutrients and resulting growth factor levels is unclear (Ikeya et al., 2002). Both IGF-1 and IGF-2 mRNA are prenatally expressed and play important roles in neural development, including proliferation, differentiation, maturation, and survival of neurons (Popken et al., 2004; Gicquel and Le Bouc, 2006). Therefore, if low levels of these hormones during the very early “critical period” dictate changes in terminal field organization of gustatory nerves, one would predict similar effects on rats fed the sodium-restricted diet from E3 to E12 or from E3 to P28. This is not what we found. However, it may be the surge in IGFs or insulin on repletion at a critical period in NTS development (approximately E12) that produces the effects seen here. Consistent with this hypothesis, IGF-1 has been implicated in brainstem nuclei development; transgenic mice that overexpress IGF-1 show dramatic changes in NTS morphology (Dentremont et al., 1999). We propose that a surge of IGF-1 or a similar factor when diets are switched at E12 permanently shapes the molecular/cellular characteristics of the NTS, ultimately resulting in enlarged terminal fields. Such a surge at this critical developmental period would not be available in rats sustaining longer periods of dietary sodium restriction (i.e., E3–P28 restricted rats). We cannot rule out that other differences in the diet (e.g., type of carbohydrates) also contribute to the brainstem reorganization. However, peripheral taste function is not altered in rats raised on a high-sucrose/sodium-replete diet (D. L. Hill, unpublished observations).
Implications for reorganization of function
There are clear implications of how the abnormal organization of centrally projecting primary afferents would produce altered taste function. For example, three separate nerves carrying gustatory information terminate in approximately the same central target, presumably leading to coordinated processing of overlapping inputs. This central target is predominantly in the zone (dorsal) we find to be most affected by the early and limited dietary sodium restriction. Significant levels of functional convergence occur in control rats (Travers et al., 1986; Bradley and Grabauskas, 1998). Therefore, one may expect that the widespread changes in terminal field organization in rats fed the sodium-restricted diet from E3 to E12 may receive the incoming information uniquely, such that coding of the qualitative and/or quantitative aspects, including tactile and temperature information, of the stimulus are changed from that in rats fed the control diet. An alteration in the way NTS cells extract features of the sensory stimulus may, in turn, lead to altered taste-related function that would impact perception of gustatory quality and quantity. Moreover, aberrant afferent activity could influence nongustatory processes such as oral–motor functions (Travers and Rinaman, 2002) and homeostatic processes such as cephalic phase insulin release (Teff, 2000).
Conclusion and summary
Because of the timing and large extent of experimentally induced changes seen in the NTS, the developing gustatory system is an excellent model for examining the nature and the mechanisms responsible for plasticity in the mammalian brainstem. Specifically, it is especially susceptible to environmental influences during early brainstem development and provides an important experimental contrast to experimentally induced changes in synaptic modifications in sensory cortices.
Acknowledgments
This work was supported by National Institutes of Health Grant DC00407. We extend our appreciation to Dr. Peter C. Brunjes for the use of his confocal laser microscope and to William B. Goodwin for his technical assistance.
References
- Altman J, Bayer S. Development of the cranial nerve ganglia and related nuclei in the rat. Adv Anat Embryol Cell Biol. 1982;74:1–90. doi: 10.1007/978-3-642-68479-1. [DOI] [PubMed] [Google Scholar]
- Barker DJ. Maternal nutrition, fetal nutrition, and disease later in life. Nutrition. 1997;13:807–813. doi: 10.1016/s0899-9007(97)00193-7. [DOI] [PubMed] [Google Scholar]
- Barker DJ. The malnourished baby and infant. Br Med Bull. 2001;60:69–88. doi: 10.1093/bmb/60.1.69. [DOI] [PubMed] [Google Scholar]
- Bradley RM. The role of the nucleus of the solitary tract in gustatory processing. Boca Raton, FL: CRC/Taylor and Francis Group; 2007. [PubMed] [Google Scholar]
- Bradley RM, Grabauskas G. Neural circuits for taste. Excitation, inhibition, and synaptic plasticity in the rostral gustatory zone of the nucleus of the solitary tract. Ann NY Acad Sci. 1998;855:467–474. doi: 10.1111/j.1749-6632.1998.tb10607.x. [DOI] [PubMed] [Google Scholar]
- Bradley RM, Mistretta CM, Bates CA, Killackey HP. Transganglionic transport of HRP from the circumvallate papilla of the rat. Brain Res. 1985;361:154–161. doi: 10.1016/0006-8993(85)91285-5. [DOI] [PubMed] [Google Scholar]
- Carr VM, Sollars SI, Farbman AI. Neuronal cell death and population dynamics in the developing rat geniculate ganglion. Neuroscience. 2005;134:1301–1308. doi: 10.1016/j.neuroscience.2005.05.034. [DOI] [PubMed] [Google Scholar]
- Catalano SM, Shatz CJ. Activity-dependent cortical target selection by thalamic axons. Science. 1998;281:559–562. doi: 10.1126/science.281.5376.559. [DOI] [PubMed] [Google Scholar]
- Contreras RJ, Beckstead RM, Norgren R. The central projections of the trigeminal, facial, glossopharyngeal and vagus nerves: an autoradiographic study in the rat. J Auton Nerv Syst. 1982;6:303–322. doi: 10.1016/0165-1838(82)90003-0. [DOI] [PubMed] [Google Scholar]
- Cummings DM, Brunjes PC. The effects of variable periods of functional deprivation on olfactory bulb development in rats. Exp Neurol. 1997;148:360–366. doi: 10.1006/exnr.1997.6660. [DOI] [PubMed] [Google Scholar]
- Cummings DM, Henning HE, Brunjes PC. Olfactory bulb recovery after early sensory deprivation. J Neurosci. 1997;17:7433–7440. doi: 10.1523/JNEUROSCI.17-19-07433.1997. [DOI] [PMC free article] [PubMed] [Google Scholar]
- Dentremont KD, Ye P, D’Ercole JA, O’Kusky JR. Increased insulin-like growth factor-I (IGF-I) expression during postnatal development differentially increases neuron number and growth in medullary nuclei of the mouse. Dev Brain Res. 1999;114:135–141. doi: 10.1016/s0165-3806(99)00024-3. [DOI] [PubMed] [Google Scholar]
- Diaz R, Brown RW, Seckl JR. Distinct ontogeny of glucocorticoid and mineralocorticoid receptor and 11β-hydroxysteroid dehydrogenase types I and II mRNAs in the fetal rat brain suggest a complex control of glucocorticoid actions. J Neurosci. 1998;18:2570–2580. doi: 10.1523/JNEUROSCI.18-07-02570.1998. [DOI] [PMC free article] [PubMed] [Google Scholar]
- Dupont E, Canu M, Langlet C, Falempin M. Time course of recovery of the somatosensory map following hindpaw sensory deprivation in the rat. Neurosci Lett. 2001;309:121–124. doi: 10.1016/s0304-3940(01)02050-x. [DOI] [PubMed] [Google Scholar]
- Fleming TP, Kwong WY, Porter R, Ursell E, Fesenko I, Wilkins A, Miller DJ, Watkins AJ, Eckert JJ. The embryo and its future. Biol Reprod. 2004;71:1046–1054. doi: 10.1095/biolreprod.104.030957. [DOI] [PubMed] [Google Scholar]
- Frank ME. Single fiber responses in the glossopharyngeal nerve of the rat to chemical, thermal, and mechanical stimulation of the posterior tongue. Providence, RI: Brown University; 1968. [Google Scholar]
- Fujioka A, Fujioka T, Ishida Y, Maekawa T, Nakamura S. Differential effects of prenatal stress on the morphological maturation of hippocampal neurons. Neuroscience. 2006;141:907–915. doi: 10.1016/j.neuroscience.2006.04.046. [DOI] [PubMed] [Google Scholar]
- Gicquel C, Le Bouc Y. Hormonal regulation of fetal growth. Horm Res. 2006;65(Suppl 3):28–33. doi: 10.1159/000091503. [DOI] [PubMed] [Google Scholar]
- Gressens P, Muaku SM, Besse L, Nsegbe E, Gallego J, Delpech B, Gaultier C, Evrard P, Ketelslegers JM, Maiter D. Maternal protein restriction early in rat pregnancy alters brain development in the progeny. Brain Res Dev Brain Res. 1997;103:21–35. doi: 10.1016/s0165-3806(97)00109-0. [DOI] [PubMed] [Google Scholar]
- Gressens P, Mesples B, Sahir N, Marret S, Sola A. Environmental factors and disturbances of brain development. Semin Neonatol. 2001;6:185–194. doi: 10.1053/siny.2001.0048. [DOI] [PubMed] [Google Scholar]
- Halsell CB, Travers SP, Travers JB. Ascending and descending projections from the rostral nucleus of the solitary tract originate from separate neuronal populations. Neuroscience. 1996;72:185–197. doi: 10.1016/0306-4522(95)00528-5. [DOI] [PubMed] [Google Scholar]
- Hill DL. Susceptibility of the developing rat gustatory system to the physiological effects of dietary sodium deprivation. J Physiol (Lond) 1987;393:413–424. doi: 10.1113/jphysiol.1987.sp016830. [DOI] [PMC free article] [PubMed] [Google Scholar]
- Hill DL, Przekop PR., Jr Influences of dietary sodium on functional taste receptor development: a sensitive period. Science. 1988;241:1826–1828. doi: 10.1126/science.3175625. [DOI] [PubMed] [Google Scholar]
- Hill DL, Bradley RM, Mistretta CM. Development of taste responses in rat nucleus of the solitary tract. J Neurophysiol. 1983;50:879–895. doi: 10.1152/jn.1983.50.4.879. [DOI] [PubMed] [Google Scholar]
- Hubel DH, Wiesel TN. The period of susceptibility to the physiological effects of unilateral eye closure in kittens. J Physiol (Lond) 1970;206:419–436. doi: 10.1113/jphysiol.1970.sp009022. [DOI] [PMC free article] [PubMed] [Google Scholar]
- Ikeya T, Galic M, Belawat P, Nairz K, Hafen E. Nutrient-dependent expression of insulin-like peptides from neuroendocrine cells in the CNS contributes to growth regulation in Drosophila. Curr Biol. 2002;12:1293–1300. doi: 10.1016/s0960-9822(02)01043-6. [DOI] [PubMed] [Google Scholar]
- King CT, Hill DL. Dietary sodium chloride deprivation throughout development selectively influences the terminal field organization of gustatory afferent fibers projecting to the rat nucleus of the solitary tract. J Comp Neurol. 1991;303:159–169. doi: 10.1002/cne.903030114. [DOI] [PubMed] [Google Scholar]
- King CT, Hill DL. Neuroanatomical alterations in the rat nucleus of the solitary tract following early maternal NaCl deprivation and subsequent NaCl repletion. J Comp Neurol. 1993;333:531–542. doi: 10.1002/cne.903330406. [DOI] [PubMed] [Google Scholar]
- Knudsen EI. Mechanisms of experience-dependent plasticity in the auditory localization pathway of the barn owl. J Comp Physiol A Neuroethol Sens Neural Behav Physiol. 1999;185:305–321. doi: 10.1007/s003590050391. [DOI] [PubMed] [Google Scholar]
- Krimm RF, Hill DL. Early prenatal critical period for chorda tympani nerve terminal field development. J Comp Neurol. 1997;378:254–264. [PubMed] [Google Scholar]
- Lasiter PS. Effects of early postnatal receptor damage on dendritic development in gustatory recipient zones of the rostral nucleus of the solitary tract. Dev Brain Res. 1991;61:197–206. doi: 10.1016/0165-3806(91)90132-3. [DOI] [PubMed] [Google Scholar]
- Lasiter PS, Kachele DL. Effects of early postnatal receptor damage on development of gustatory recipient zones within the nucleus of the solitary tract. Dev Brain Res. 1990;55:57–71. doi: 10.1016/0165-3806(90)90106-9. [DOI] [PubMed] [Google Scholar]
- Lee KH, Calikoglu AS, Ye P, D’Ercole AJ. Insulin-like growth factor-I (IGF-I) ameliorates and IGF binding protein-1 (IGFBP-1) exacerbates the effects of undernutrition on brain growth during early postnatal life: studies in IGF-I and IGFBP-1 transgenic mice. Pediatr Res. 1999;45:331–336. doi: 10.1203/00006450-199903000-00007. [DOI] [PubMed] [Google Scholar]
- Liao DS, Mower AF, Neve RL, Sato-Bigbee C, Ramoa AS. Different mechanisms for loss and recovery of binocularity in the visual cortex. J Neurosci. 2002;22:9015–9023. doi: 10.1523/JNEUROSCI.22-20-09015.2002. [DOI] [PMC free article] [PubMed] [Google Scholar]
- Maier DL, Grieb GM, Stelzner DJ, McCasland JS. Large-scale plasticity in barrel cortex following repeated whisker trimming in young adult hamsters. Exp Neurol. 2003;184:737–745. doi: 10.1016/S0014-4886(03)00335-2. [DOI] [PubMed] [Google Scholar]
- Mangold JE, Hill DL. List of abstracts from the twenty-eighth annual meeting of the Association for Chemoreception Sciences. Chem Senses. 2006;31:479–493. [Google Scholar]
- May OL, Hill DL. Gustatory terminal field organization and developmental plasticity in the nucleus of the solitary tract revealed through triple-fluorescence labeling. J Comp Neurol. 2006;497:658–669. doi: 10.1002/cne.21023. [DOI] [PMC free article] [PubMed] [Google Scholar]
- Mbiene JP, Mistretta CM. Initial innervation of embryonic rat tongue and developing taste papillae: nerves follow distinctive and spatially restricted pathways. Acta Anat (Basel) 1997;160:139–158. doi: 10.1159/000148006. [DOI] [PubMed] [Google Scholar]
- McClellan R, Novak D. Fetal nutrition: how we become what we are. J Pediatr Gastroenterol Nutr. 2001;33:233–244. doi: 10.1097/00005176-200109000-00002. [DOI] [PubMed] [Google Scholar]
- Mistretta CM. Topographical and histological study of the developing rat tongue, palate, and taste buds. In: Bosma JF, editor. Third symposium on oral sensation and perception. Springfield, IL: Thomas; 1972. pp. 163–187. [Google Scholar]
- Moore DR. Postnatal development of the mammalian central auditory system and the neural consequences of auditory deprivation. Acta Otolaryngol. 1985;421:19–30. doi: 10.3109/00016488509121753. [DOI] [PubMed] [Google Scholar]
- O’Leary DD, Borngasser DJ, Fox K, Schlaggar BL. Plasticity in the development of neocortical areas. Ciba Found Symp. 1995;193:214–230. doi: 10.1002/9780470514795.ch11. discussion 251–217. [DOI] [PubMed] [Google Scholar]
- Owen D, Andrews MH, Matthews SG. Maternal adversity, glucocorticoids and programming of neuroendocrine function and behaviour. Neurosci Biobehav Rev. 2005;29:209–226. doi: 10.1016/j.neubiorev.2004.10.004. [DOI] [PubMed] [Google Scholar]
- Penn AA, Shatz CJ. Brain waves and brain wiring: the role of endogenous and sensory-driven neural activity in development. Pediatr Res. 1999;45:447–458. doi: 10.1203/00006450-199904010-00001. [DOI] [PubMed] [Google Scholar]
- Popken GJ, Hodge RD, Ye P, Zhang J, Ng W, O’Kusky JR, D’Ercole AJ. In vivo effects of insulin-like growth factor-I (IGF-I) on prenatal and early postnatal development of the central nervous system. Eur J Neurosci. 2004;19:2056–2068. doi: 10.1111/j.0953-816X.2004.03320.x. [DOI] [PubMed] [Google Scholar]
- Schlaggar BL, Fox K, O’Leary DD. Postsynaptic control of plasticity in developing somatosensory cortex. Nature. 1993;364:623–626. doi: 10.1038/364623a0. [DOI] [PubMed] [Google Scholar]
- Shatz CJ. Emergence of order in visual system development. Proc Natl Acad Sci USA. 1996;93:602–608. doi: 10.1073/pnas.93.2.602. [DOI] [PMC free article] [PubMed] [Google Scholar]
- Shuler MG, Krimm RF, Hill DL. Neuron/target plasticity in the peripheral gustatory system. J Comp Neurol. 2004;472:183–192. doi: 10.1002/cne.11017. [DOI] [PMC free article] [PubMed] [Google Scholar]
- Sollars SI, Walker BR, Thaw AK, Hill DL. Age-related decrease of the chorda tympani nerve terminal field in the nucleus of the solitary tract is prevented by dietary sodium restriction during development. Neuroscience. 2006;137:1229–1236. doi: 10.1016/j.neuroscience.2005.09.040. [DOI] [PMC free article] [PubMed] [Google Scholar]
- Sweazey RD, Bradley RM. Central connections of the lingualtonsillar branch of the glossopharyngeal nerve and the superior laryngeal nerve in lamb. J Comp Neurol. 1986;245:471–482. doi: 10.1002/cne.902450404. [DOI] [PubMed] [Google Scholar]
- Teff K. Nutritional implications of the cephalic-phase reflexes: endocrine responses. Appetite. 2000;34:206–213. doi: 10.1006/appe.1999.0282. [DOI] [PubMed] [Google Scholar]
- Travers JB, Rinaman L. Identification of lingual motor control circuits using two strains of pseudorabies virus. Neuroscience. 2002;115:1139–1151. doi: 10.1016/s0306-4522(02)00489-x. [DOI] [PubMed] [Google Scholar]
- Travers SP, Pfaffmann C, Norgren R. Convergence of lingual and palatal gustatory neural activity in the nucleus of the solitary tract. Brain Res. 1986;365:305–320. doi: 10.1016/0006-8993(86)91642-2. [DOI] [PubMed] [Google Scholar]
- Vogt MB, Hill DL. Enduring alterations in neurophysiological taste responses after early dietary sodium deprivation. J Neurophysiol. 1993;69:832–841. doi: 10.1152/jn.1993.69.3.832. [DOI] [PubMed] [Google Scholar]
- Zhang LL, Ashwell KW. Development of the cyto- and chemoarchitectural organization of the rat nucleus of the solitary tract. Anat Embryol (Berl) 2001a;203:265–282. doi: 10.1007/s004290000151. [DOI] [PubMed] [Google Scholar]
- Zhang LL, Ashwell KW. The development of cranial nerve and visceral afferents to the nucleus of the solitary tract in the rat. Anat Embryol (Berl) 2001b;204:135–151. doi: 10.1007/s004290100185. [DOI] [PubMed] [Google Scholar]