

Abstract
Parallel ON and OFF pathways conduct visual signals from bipolar cells in the retina to higher centers in the brain. ON responses are thought to originate by exclusive use of metabotropic glutamate receptor 6 (mGluR6) expressed in retinal ON bipolar cells. Paradoxically, we find ON responses in retinal ganglion cells of mGluR6-null mice, but they occur at long latency. The long-latency ON responses are not blocked by metabotropic glutamate or cholinergic receptor antagonists and are not produced by activation of receptive field surrounds. We show that these longer-latency ON responses are initiated in the OFF pathways. Our results expose a previously unrecognized intrinsic property of OFF retinal pathways that generates responses to light onset. In mGluR6-null mice, long-latency ON responses are observed in the visual cortex, indicating that they can be conducted reliably to higher visual areas. In wild-type (WT) mice, APB (dl-2-amino-4-phosphonobutyric acid), an mGluR6 agonist, blocks normal, short-latency ON responses but unmasks longer-latency ones. We find that these potentially confusing ON responses in the OFF pathway are actively suppressed in WT mice via two pharmacologically separable retinal circuits that are activated by the ON system in the retina. Consequently, we propose that a major function of the signaling of the ON pathway to the OFF pathway is suppression of these mistimed, and therefore inappropriate, light-evoked responses.
Keywords: retina, visual cortex, retinal ganglion cells, long-latency ON response, mGluR6 knock-out mouse, multielectrode array
Introduction
The retina transforms light patterns of visual scenes into several parallel information streams that are transmitted to higher visual centers. Two of these fundamental streams are the ON and OFF retinal pathways. These pathways originate at depolarizing (ON) and hyperpolarizing (OFF) bipolar cells, which receive inputs from the photoreceptors. In mammals, ON bipolar cells exclusively use metabotropic glutamate receptors (mGluRs) containing the group III subunit 6 (mGluR6) to transform photoreceptor signals at light onset into depolarizing responses (Nomura et al., 1994; Masu et al., 1995; Vardi and Morigiwa, 1997). Retinal ganglion cells (RGCs), driven by depolarization-induced glutamate release from ON bipolar cells, have short-latency, ON spiking responses. In contrast, OFF bipolar cells rely on ionotropic glutamate receptors and hyperpolarize at light onset (DeVries, 2000). At light offset, OFF bipolar cells transiently depolarize, increase their release of glutamate, and cause short-latency, OFF spiking responses in RGCs. Some RGCs receive inputs from both types of bipolar cell and respond with action potentials to both light onset and light offset (ON-OFF RGCs).
dl-2-Amino-4-phosphonobutyric acid (APB), an mGluR6 agonist, eliminates light-evoked ON bipolar cell depolarization and the associated b-wave of the flash electroretinogram (ERG) [mouse (Green et al., 2004); rabbit (Massey et al., 1983); salamander (Slaughter and Miller, 1981; Tian and Slaughter, 1995)]. APB has been reported to eliminate RGC spiking in response to light onset and has been used to dissect the putative contributions of the ON pathway to response properties of visual neurons in the lateral geniculate nucleus (LGN) and cortex (Schiller, 1982; Horton and Sherk, 1984). In accord with results using APB, the b-wave of the ERG was completely eliminated in response to a short light flash in a line of mice lacking mGluR6 (Masu et al., 1995). Unexpectedly, however, light stimuli presented to the retina evoked responses to light onset in the superior colliculus (SC) of mGluR6-null mice (Sugihara et al., 1997). These unforeseen ON responses had a much longer latency than ON responses in wild-type (WT) mice.
We examined responses of visual cortical neurons and RGCs in these mGluR6-null mice. As in the SC, steps of light presented to the eye produced longer-latency ON responses in cortical neurons of mGluR6 nulls than in the WT. Spiking responses, recorded using a multielectrode array, revealed that a majority of ganglion cell layer neurons in mGluR6-null retinas responded to light onset at long latency. In WT animals, we found APB eliminated the short-latency ON responses of RGCs, as expected, but a long-latency ON response emerged in the presence of this agonist, similar to the response seen in the mGluR6-null retina. We conclude that the OFF system circuitry can generate responses to light onset at long latency. These responses are transmitted to the visual cortex of the mGluR6-null mouse. In the WT retina, however, long-latency ON responsiveness is significantly suppressed by the ON system through both glutamatergic and GABAergic/glycinergic inhibitory pathways, presumably to maintain an accurate representation of light onset and offset timing.
Materials and Methods
Animals
The MGLUR6 gene was disrupted by homologous recombination to produce a line of homozygous null mice lacking mGluR6 protein (Masu et al., 1995). Breeding pairs were genotyped to confirm that they lacked both copies of the gene (data not shown), and the colony was maintained as homozygous nulls [“knock-outs” (KOs)] in a C57BL/6 background. WT mice were C57BL/6 (Simonsen Labs, Gilroy, CA). Null and WT animals did not differ significantly in weight (data not shown).
Protocols followed University of California, San Francisco (UCSF) Animal Care and Use guidelines and were approved by the Committee for Animal Research. Animals were reared in the UCSF animal facility under a 12 h light/dark regimen.
Multiunit recording of light-evoked responses of cortical neurons
Action potentials were recorded from the visual cortex of urethane-anesthetized mice [adapted from Gordon and Stryker (1996) and Kalatsky and Stryker (2003)]. Briefly, adult mice between 2 and 6 months of age were anesthetized with urethane (1.0 g/kg) supplemented with chlorprothixene (0.2 mg/mouse, i.m.). Atropine (5 mg/kg) and dexamethasone (0.2 mg/mouse) were injected subcutaneously. A tracheotomy was performed, and a craniotomy was made over the visual area of the left hemisphere; the dura mater was left intact. The animals were placed in a stereotaxic apparatus, and their temperature was maintained at 37.5°C. Large spots (40-50° in diameter) of flashing light were delivered on a computer monitor 25 cm away from the right eye, contralateral to the cortex being studied. Single or arrays of four tungsten electrodes (2-4 MΩ; Frederick Haer Company, Bowdoinham, ME) were used to penetrate the cortex. Multiunit spikes were recorded from three to five sites (at least 100 μm apart) during each penetration across all layers of the cortex. The spikes were acquired using the System 3 workstation (Tucker-Davis Technologies, Alachua, FL) and analyzed using Matlab (The MathWorks, Natick, MA).
Multielectrode extracellular recording of light-evoked responses of retinal neurons
Action potentials were recorded from mouse retinas as described previously (Tian and Copenhagen, 2003). Briefly, animals were killed after at least 30 min of dark adaptation, and an eye was removed under dim red illumination. The neural retina was dissected under infrared illumination and observation and placed ganglion cell-side down in a recording chamber using a piece of nitrocellulose paper as support. The retina was typically placed on the array within a millimeter of the optic nerve head. A manipulator (Cell Micro Controls, Norfolk, VA) was used to hold the tissue down with slight pressure. The multielectrode chambers (MEA-60 system; MultiChannel Systems, Reutlingen, Germany) consisted of an array of 60 planar electrodes, each 10 μm in diameter, in eight rows and spaced 100 μm apart for a total array size of 700 μm2. Retinas were perfused at room temperature for 30 min and at 34°C for another 30 min before recordings were started, and the temperature was maintained at 34°C throughout the recordings. The perfusion saline consisted of the following (in mm): 124 NaCl, 2.5 KCl, 2 CaCl2, 2 MgCl2, 1.25 NaH2PO4, 26 NaHCO3, and 22.2 glucose, and the pH was maintained at 7.3-7.4 by bubbling with 95% O2/5% CO2 mixed gas. Acquired voltage signals were bandpass filtered at 0.1 Hz to 3 kHz and sampled at 20 kHz (MC_Rack, version 2.0; MultiChannel Systems).
Light stimuli were presented either from a 500 nm (green) lightemitting diode (LED) (Newport, Irvine, CA) connected to a variableintensity LED driver (custom) and stimulus generator (MultiChannel Systems) or from a monitor (Dell Ultrascan P780; 85 Hz vertical refresh) imaged onto the retinal surface at an approximate intensity of 0.35 μW/cm2. Stimulus images were generated and presented on the monitor by custom macros written for Matlab using the Psychophysics Toolbox extensions (Brainard, 1997; Pelli, 1997). For this stimulus, “full field” meant illumination of a circular area with a diameter of 2.5 mm; spots could be centered over any desired electrode in the array. Trigger pulses were sent to the acquisition computer using the INOUTP Minitoolbox for Matlab. For the LED, “full field” meant illumination of the entire retina.
Generally, we recorded 4-5 s of stimulus-evoked data, 2 or 3 s with the stimulus light on and 2 s with the light off, with 20 s between presentations. For full-field stimuli, 10 or 20 of these periods were recorded at each of five intensities (in the case of the LED) or at maximum luminance (pixel value, 255) for the monitor. For spot stimuli, nine different spot diameters were used (50, 100, 200, 300, 400, 600, 900, 1200, and 2500 μm on the retina), also at maximum luminance. The nine different diameters were presented sequentially, centered on a particular electrode, and this sequence was repeated either three or five times for each data file recorded. Only data from the electrode on which the spots were centered and those immediately surrounding it were recorded. Neurons with responses to the three largest spot stimuli that were all lower than the peak response to any spot size for that neuron were considered to exhibit surround antagonism. We likely underestimated the fraction of RGCs having antagonistic surround fields because of brighter center activation during the larger spot presentations attributable to light scattered off of the nitrocellulose support. Generally, background illumination was only from the dark monitor (pixel value, 0), and the setup was kept in the dark and protected from stray light entry. During drug applications, usually for 6-10 min before recording, the display monitor was dark or covered.
Data analysis and cell types
After recording, action potential waveforms from high-pass-filtered data (100 Hz lower cutoff) were detected by threshold crossing and then clustered based on the first two principal components, as described previously (Tian and Copenhagen, 2003). Cluster contours in principal components space were either manually selected or derived from a k-means algorithm (OfflineSorter, version 1.3; Plexon, Dallas, TX). The algorithm eliminated outlier waveforms at a threshold of 1.3 times the mean distance from the calculated cluster center, and not every detected waveform was assigned to a unit. Obvious automatic sorting errors were corrected for each cluster manually. Time stamps for each action potential of each sorted unit were used to generate peristimulus time histograms and peristimulus spike rasters and for autocorrelation and cross-correlation analyses (NeuroExplorer, version 2.6; Nex Technologies, Dallas, TX). Other analyses were performed with IGOR Pro (WaveMetrics, Lake Oswego, OR) using custom macros.
Autocorrelograms (bin width, 1 ms) of the spike times for each unit were examined for several retinas (n = 5 WT; n = 5 mGluR6 KO). None of the sorted units had spikes within 2 ms of each other in the histograms (data not shown). This indicates a refractory period for each RGC and shows that each classified unit represented the firing of a single neuron. The space constant for spike waveforms recorded with a similar array from salamander retina has been measured to be 28 μm (Segev et al., 2004), suggesting that spikes from a single RGC should only be prominently recorded by a single electrode for the arrays we used, which had electrode spacings of 100 μm. In confirmation, crosscorrelograms (bin width, 1 ms) comparing spike times of individual units to the spike times from neighboring electrodes to the same stimuli revealed no peaks, indicating that there was very little if any recording of a single neuron by multiple electrodes (data not shown).
RGC density and spiking characteristics strongly suggest that the over whelming majority of spiking units we recorded were RGCs. The ganglion cell layer of the mouse retina contains RGCs as well as a larger number of displaced amacrine cells. RGCs are estimated to comprise 41% (Jeon et al., 1998) to 60% (Drager and Olsen, 1981) of the neurons in the layer, and RGC density is high relative to the size of the array at ∼3300 RGCs/mm2 (Jeon et al., 1998). At this density, approximately eight RGCs are within the 28 μm space constant of any given electrode. Yet most electrodes recorded only 1-3 units at high signal-to-noise ratios. Because, at most, only a few distinct RGCs were recorded at each of our electrodes, only those neurons with larger spike amplitudes could be distinguished above the noise level. Spiking of displaced amacrine cells has been extensively studied in the salamander to test their impact on multielectrode array recording of retina (Segev et al., 2004). Many amacrine cells did not spike. Those that did had spikes of much lower amplitude than those of RGCs and frequency content only up to 80 Hz. Thus, we conclude that most of the neurons recorded in our study were likely RGCs, and they are called such throughout the text. Nevertheless, contamination of our sample with some amacrine cells would not alter the conclusions of our study because of the large number of neurons that had the long-latency ON response.
Some spiking RGCs could have been recorded from their axons instead of from their cell somata if the axons passed near an electrode. Axonal spike waveforms recorded using these extracellular electrodes differ from spike waveforms produced by the cell body (Segev et al., 2004) and could be distinguished at the sorting step. Few of the waveforms were of the axonal type. Even if a few of these were included in the sample, the relative spike timing and patterns of the light response would be preserved but offset by the small conduction time from the RGC somata to the recorded location of the axon.
Our recordings had a lower number of pure ON RGCs than reported by others (Nirenberg and Meister, 1997; Tian and Copenhagen, 2003), which was likely attributable to the young age of the mice, several of which were younger than postnatal day 25 (P25), and to the stringency both for accepting spikes during clustering and in defining ON and OFF responses by spikes during presentations instead of by peak frequency measures. The animals used in the retinal recordings of this study were young mice, ranging from P15 to P55, with the majority being P20 to P34. These young mice generally gave more robust recordings than older mice. Nonetheless, all ages of mGluR6-null mice showed the retinal long-latency ON response reported here. The mice used in visual cortical recordings were 1-6 months in age, and all of the nulls had cortically recorded, long-latency ON responses.
A small number of mGluR6-null retinas failed to show large numbers of neurons with long-latency ON responses, although some OFF responses were recorded. Because we suspected that the health of these retinas might have been compromised during dissection, these particular retinas were not analyzed further.
Classification of RGC responses
We defined a short-latency ON response as at least one action potential from 50 to 300 ms after light onset in at least one-half of the light presentations. OFF responses were defined as at least one action potential from 50 to 500 ms after light offset in at least one-half of the light presentations. Long-latency ON responses had at least three spikes between 700 ms and the end of the light stimulus and had a higher peak rate (100 ms bin width) in this interval than between 500 and 700 ms; this was necessary because some ON sustained responses from WT RGCs might be considered to be composed of a transient, short-latency ON response followed by a gap in spiking followed by a long-latency ON component. Custom macros (IGOR Pro) implementing these criteria were used to classify responses using time stamps of sorted action potentials from recorded RGCs. Response latency was defined as the time after light onset or offset to the peak firing frequency (10 ms bin width) for the given time periods.
Carcieri et al. (2003) also identified a long-latency ON responding RGC class based on a peak firing frequency criterion. It is difficult to determine whether their long-latency group of RGCs from WT mouse retina would comprise responses we classified here as “long-latency ON” because of incomplete information about their responses. The published responses do not indicate whether there was a weaker, short-latency ON response in these RGCs nor whether they typically had OFF responses.
Electroretinogram recordings with long stimulus presentations
Adult WT and mGluR6-null mice were dark-adapted overnight and anesthetized with a mixture of ketamine (87 mg/kg) and xylazine (13 mg/kg). Pupils were dilated with 2.5% phenylephrine and 1% atropine under dim red illumination. Animals were placed on a heating pad to maintain body temperature in a covered, dark Faraday cage. All animals recovered after recording. A needle electrode was placed subcutaneously as a ground, and glass electrodes filled with saline were placed against each cornea and connected to a differential amplifier (DAM-70; World Precision Instruments, Sarasota, FL). One eye was covered and used as a reference. A halogen lamp with selectable neutral density filters in the path was used to illuminate the other eye from a set distance. ERG traces to 2 s light stimuli at intervals of 30 s were acquired (Pulse software; HEKA Elektronik, Lambrecht/Pfalz, Germany) and analyzed using custom macros (IGOR Pro). The background DC voltage was subtracted for all traces using the average value during the 800 ms before light onset.
Drugs and chemicals
All drugs were purchased from Tocris (Ellisville, MO), except picrotoxin, (1,2,5,6-tetrahydropyridin-4-yl)methylphosphinic acid (TPMPA), and strychnine, which were from Sigma (St. Louis, MO). All other chemicals used were from Sigma except as noted above.
Results
Neurons in the visual cortex of mGluR6-null mice respond to light stimuli with a long-latency ON response
A long-latency ON response was recorded in the SC of mGluR6null mice (Sugihara et al., 1997). Preliminary data mentioned by Sugihara et al. (1997), however, suggested that the LGN of the mGluR6-null mouse does not exhibit long-latency ON responses. This raised the possibility that a long-latency ON response is generated by the SC of these mice. However, if the long-latency ON response were generated in the retina, it would be surprising to find this response only in the SC and not in the retino-geniculo-cortical pathways. We tested this by recording light-evoked activity in the visual cortex of mGluR6-null mice. Multiunit recordings of responses to full field, 2 s light presentations were made from the visual cortices of WT and mGluR6-null mice. WT cortical neurons had ON and OFF responses (Fig. 1A). Cortical neurons from the null also responded to light onset and offset (Fig. 1B), but the ON response had a longer latency than the WT ON response. Of the 42 multiunit sites recorded in WT visual cortices (n = 3 animals), 100% had ON responses, whereas 88% had OFF responses. Of the 42 multiunit sites recorded in visual cortices of mGluR6-null animals (n = 4 animals), 79% had ON responses, whereas 86% had OFF responses. The mean latency to ON peak frequency in the null was longer than in the WT (Fig. 1C) (mean ± SEM, WT, 138 ± 14 ms; KO, 308 ± 40 ms; p < 0.001, t test). These ON latencies were only slightly longer than the latencies reported for the WT and null SC (50-100 and 200-300 ms, respectively) (Sugihara et al., 1997). The cortical ON responses from the null were also weaker than the WT responses (peak firing rate, mean ± SEM: WT, 73 ± 7 Hz; KO, 41 ± 4 Hz; p < 0.001, t test) (Fig. 1B), whereas the OFF responses were not significantly different. These data indicate that neurons in the visual cortex of mGluR6-null animals do respond to light onset but with a longer latency than WT.
Figure 1.

Neurons in the visual cortex of mGluR6 homozygous null mice respond to the onset of light stimuli with a long-latency response. Multiunit, extracellular electrode recordings of responses to 2 s, full-field light presentations were made from the visual cortices of WT and mGluR6-null mice anesthetized with urethane. A, Peristimulus time histograms (PSTHs) of two recordings from neurons in WT visual cortex. B, PSTHs of two recordings from neurons in visual cortex of the mGluR6 homozygous null mouse. Bin width, 50 ms. The light/dark bar below the histograms represents the light stimulus, which originated from a computer monitor. C, Summary of visual cortical neuron latencies to peak frequency after light onset. Light bars show WT latencies; black bars show mGluR6-null latencies. Neurons in the mGluR6 null have a longer latency on average compared with that of WT. Frequency is in impulses (spikes) per second (imp/sec).
RGCs in mGluR6-null retinas respond to long-duration light stimuli with a long-latency ON response
The existence of a long-latency ON response in both SC and visual cortex in mGluR6-null mice strongly suggested this response was generated in the retina. The remainder of this paper demonstrates and characterizes the long-latency ON response in the retina. Using a multielectrode array to record extracellularly from whole-mounted retinas, we observed the basic types of RGC responses in the WT retina: ON transient and ON sustained, OFF transient, and ON-OFF (Fig. 2A). In WT retina, 79% (882 of 1111 RGCs from 18 retinas) responded to light onset, and all of these responses were at short latency (mean ± SEM, WT, 100 ± 30 ms). Sixty percent of WT RGCs had an OFF response, and none had a long-latency ON response, although some (10%) (see Materials and Methods) also had what might be considered a long-latency ON component (see Fig. 6B, top panel).
Figure 2.

RGCs of the mGluR6 homozygous null retina have a long-latency ON response. Responses of RGCs were recorded from WT and mGluR6-null retinas using a multielectrode array. These responses were sorted into individual units representing spiking responses from individual RGCs. A, Example raster plots of spiking responses from WT RGCs to individual stimulus presentations and their resulting peristimulus time histograms (PSTHs) are shown. Short-latency, transient ON, sustained ON, ON-OFF, and OFF responses are all recorded by the array. B, Example raster plots and corresponding PSTHs for mGluR6-null neurons with prominent long-latency ON responses are shown. No transient or sustained ON responses with short latency were recorded in these retinas. For all retinal PSTHs, bin width is 10 ms. The light/dark bar below the histograms represents the light stimulus, which originated from a computer monitor and was projected onto the retinal surface. Frequency is in impulses (spikes) per second (imp/sec). C, A large percentage of RGCs from mGluR6-null retinas had a long-latency ON response and an OFF response. Values indicate the number of neurons recorded from 32 null retinas.
Figure 6.

Blockade of ON bipolar cell function in the WT retina causes a long-latency ON response to emerge. Treatment of WT retinas with the mGluR6 agonist APB leads to generation of a long-latency ON response in many RGCs. A-D, Examples of raster plots (top graphs) and corresponding peristimulus time histograms (PSTHs) (bottom graphs) from strongly responding individual RGCs during 2 s light presentations before (top panel) and after (bottom panel) treatment with APB (100 μm) show blockade of short-latency ON responses, both transient and sustained, and the presence of long-latency ON responses in APB. In D, an OFF neuron in control saline has a long-latency ON response in APB. Light/dark bars below the panels indicate the light stimulus timing. Note that, in C and D, the first 60 ms of the response are not shown. For these RGCs, increased spontaneous dark activity in the presence of APB continued into the light onset period, giving the mistaken impression of a short-latency ON response during some of the stimulus presentations. The actual short-latency response, which has a latency >60 ms under these conditions, can be seen in the control responses in C. Frequency (Freq) is in impulses (spikes) per second (imp/sec).
In contrast, in the mGluR6-null retina, we found no RGCs with a short-latency ON response, 73% with an OFF response, and 43% with a long-latency ON response. The latencies of the ON responses in the mGluR6-null retinas were very long (mean ± SEM, KO, 1140 ± 300 ms; p < 0.0001, t test comparison to WT) and were never in the short latency range exhibited by WT RGCs. Over one-half of the OFF responding RGCs had a long-latency ON response (53%) (Fig. 2C), and 96% of the long-latency ON responding RGCs had an OFF response. Thus, both the collicular and visual cortical responses likely originate from long-latency ON responses in RGCs of the mGluR6-null retina. These long latencies from the isolated null retina were typically longer than those recorded from the visual cortex in intact animals. Although this may be attributable to removal of the retina for recording and the slightly lower temperature used for the whole-mount recordings, the in vitro ON transient latency in the WT retina was similar to the in vivo cortical ON latency. This suggests that the long-latency ON response is more sensitive to the differences in recording and stimulus conditions for the in vitro multielectrode array versus the in vivo cortical experiments. We sought to determine the retinal pathways or intrinsic mechanisms that produce this long-latency ON response.
mGluR antagonists do not block the long-latency ON response
In the mGluR6-null retina, mGluR7, a group III metabotropic glutamate receptor normally expressed in several bands in the inner plexiform layer, is expressed ectopically in the outer plexiform layer (OPL) (Tagawa et al., 1999). Could this or other metabotropic glutamate receptors compensate for the lack of mGluR6 subunits and underlie the long-latency ON response through activation of the ON bipolar pathway? We tested responses of mGluR6-null retinas to light stimuli before and after application of antagonists to all three groups of mGluRs [50 μM 2S-2-amino-2-(1S,2S-2-carboxycycloprop-1-yl)-3-(xanth-9-yl)propanoic acid (LY341495): antagonist for mGluR2, -3, -7, -8, and partially for mGluR4a at this concentration, n = 334 neurons from four retinas; (S)-(+)-α-amino-4-carboxy-2-methylbenzeneacetic acid (LY367385): mGluR1 antagonist, n = 59 neurons from one retina; 2-methyl-6-(phenylethynyl)-pyridine (MPEP): mGluR5 antagonist, n = 88 neurons from one retina; (RS)-α-cyclopropyl-4-phosphonophenylglycine (CPPG): mGluR4 and -6 antagonist, n = 157 neurons from two retinas]. LY341495, which blocks signaling by mGluR7-containing receptors (Schoepp et al., 1999), had no effect (Fig. 3), indicating that although mGluR7 was upregulated in the mGluR6-null OPL, the receptor did not serve to drive long-latency ON responsiveness. None of the other antagonists blocked the long-latency ON response either (Fig. 3). These pharmacological experiments indicate that no other mGluR-mediated pathway in outer retina generates the long-latency ON responses.
Figure 3.
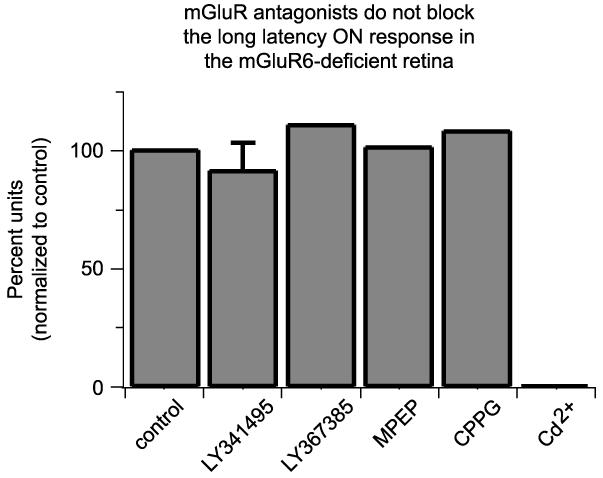
mGluR antagonists do not prevent the long-latency ON response in the mGluR6 homozygous null retina. Antagonists to group I, II, and III metabotropic glutamate receptors did not block the long-latency ON response in the mGluR6-null retina. Control, Untreated; LY341495 (50 μm), antagonist for mGluR2, -3, -7a, -8, and partially for mGluR4a at this concentration; LY367385, mGluR1a antagonist; MPEP, mGluR5 antagonist; CPPG, mGluR4 and mGluR6 antagonist. The percentage of total units with a long-latency ON response was compared before and after treatment of retinas with antagonists. In contrast, cadmium (100 μm), which blocks synaptic transmission, blocked all light responses. Error bar indicates SEM.
The electroretinogram of the mGluR6-null mouse does not have a delayed b-wave
The b-wave of the ERG results from ON bipolar activity after a light presentation; b-wave and ON bipolar response amplitudes are correlated throughout the response range, their time courses are similar, and their sensitivity to APB is similar (Tian and Slaughter, 1995). ERGs from mGluR6-null mice have no b-wave, as would be expected in the absence of ON bipolar cell function, but the a- and c-waves are normal (Masu et al., 1995). The light pulse used in that study, however, a short flash of ∼20 ms, may not have been long enough to evoke the long-latency ON response reported here. A late-onset b-wave could have been missed if the ON bipolar cells of the mGluR6 null were somehow still functional but delayed in activation. Therefore, we recorded the ERG generated by long light stimuli (2 s) presented to both WT (n = 3) and mGluR6-null (n = 3) animals. In Figure 4, the WT response (gray curve) is compared with that of the null (black curve), at the same stimulus intensity. The WT ERGs with the 2 s stimulus resemble mouse ERGs previously reported using the same, long stimulus duration (Balkema et al., 1981). No b-wave was discerned in the mGluR6-null mice at any latency during the entire stimulus presentation and over 2 log units of light intensity (other intensity data not shown). The ERG of the null lacks a b-wave although these light intensities produced the long-latency ON responses recorded from the ganglion cells of other mGluR6-null animals. Together with the finding that mGluR antagonists did not block the response, these ERG results support the idea that the long-latency ON response in mGluR6-null mice does not arise from a delayed ON bipolar cell response and suggest that these responses may originate in light activation of other retinal pathways.
Figure 4.

The electroretinogram of the mGluR6 homozygous null mouse does not have a delayed b-wave during 2 s light stimulus presentations. Electroretinograms in response to 2 s light stimuli from a WT mouse (gray curve) and from an mGluR6-null mouse (black curve) are shown. The a-, b-, c-, and d-waves are indicated. The b-wave in the WT results from ON bipolar cell activity. No b-wave activity was apparent in the mGluR6-null mouse. The light/dark bar below the traces represents the light stimulus.
Presynaptic input to RGCs is required for the long-latency ON response
We tested for alternative pathways that might drive the long-latency ON responses in the mGluR6-null retina. RGCs containing melanopsin are intrinsically photosensitive (ipRGCs). They depolarize and fire action potentials in response to bright light stimuli even without their normal excitatory synaptic inputs (Berson et al., 2002). One possibility was that the number of ipRGCs was much higher in the mGluR6-null mouse and we were observing long-latency ON responses from this class of RGCs. Several lines of evidence indicate that ipRGCs were not responsible for the response. First, as opposed to ipRGC responses, synaptic transmission was required for the light-evoked long-latency ON response. Figure 3 shows that cadmium (100 μM; n = 99 neurons from one retina), a calcium channel blocker known to suppress synaptic transmission in retina, blocked all light-evoked spiking, both short- and long-latency ON and OFF responses. Second, the long-latency ON responses did not resemble those of ipRGCs (Berson et al., 2002; Warren et al., 2003). For example, the latency of long-latency ON responses increased with increasing light intensity (data not shown), whereas brighter stimuli lead to faster melanopsin-driven responses. Third, the lower light intensities that evoked long-latency ON responses in the mGluR6-null retinas were too low to activate melanopsin-driven spiking (Berson et al., 2002; Warren et al., 2003). Finally, evidence from retinas stained with an antimelanopsin antibody indicated that the number of melanopsin-positive ganglion cell layer neurons was not discernibly increased in the mGluR6-null relative to the WT retina (data not shown).
Excitatory synaptic pathways other than the principal glutamatergic ones exist in the retina. In particular, the retina uses acetylcholine as a second excitatory transmitter. However, neither a muscarinic (scopolomine, 1 mM; n = 112 neurons from one retina) nor a nicotinic (d-tubocurarine, 250 μM; n = 414 neurons from four retinas) antagonist blocked long-latency ON responses in the mGluR6-null retina. These results indicate that presynaptic activity was necessary for the response, this activity did not arise from the ON bipolar pathway or from ipRGC activity, and it was noncholinergic. This implicated the glutamatergic, OFF bipolar pathway, which could be acting through excitatory inputs to RGCs directly or through inhibitory circuitry to generate the long-latency ON response in RGCs.
An ON surround component of the OFF receptive field does not account for the long-latency ON response
The OFF bipolar pathway can produce responses to light onset in OFF RGCs because of surround activation. The classic receptive field organization of RGCs is an excitatory center combined with an antagonistic surround. In RGCs of WT retina, for example, a spot of a certain size and of the preferred contrast will stimulate robust spiking responses when presented to the center of the receptive field of the RGC. Presenting the stimulus outside of the center, however, activates surround circuitry that inhibits that same RGC. Presentation of a stimulus of nonpreferred contrast can cause spiking in an RGC when it is presented within the surround (Kuffler, 1953; Stone and Pinto, 1992, 1993; Sagdullaev and McCall, 2005). For an OFF RGC, this would be an ON response. Activation of the center and the surround with either large diameter light spots or full-field stimuli activates both the center and surround and can lead to both ON and OFF spiking in RGCs.
If surround, instead of center, activation were causing long-latency ON responses in mGluR6-null retinas, we might expect two behaviors of responses to spots of light of increasing diameter. First, as the size of the stimulus spot is increased, the long-latency ON response should also increase as more of the surround is recruited. Second, small spots presented to the receptive field center, which do not appreciably activate the surround, should not generate the long-latency ON response. Neither of these occurred. Long-latency ON responses in the mGluR6-null retinas were elicited by small spots and had center-surround organization similar in character to the responses of RGCs in WT animals.
Typical WT RGC response amplitudes to light spots of increasing diameter are shown in Figure 5A for an ON, an OFF, and an ON-OFF neuron. The normalized response represents the total number of spikes recorded over a set time period after light onset or light offset (see Materials and Methods). As the light spots increase in diameter, the response first increases as more and more of the center is activated, and then decreases as the larger spots activate increasing amounts of the surround. This occurs for both ON and OFF responses in the WT, as can be seen in Figure 5A. Not all RGCs had this organization, with some having no or only weak surrounds and others showing greater responses at the largest spot sizes. In the WT, the percentages of RGCs with a surround for ON transient, ON sustained, and OFF responses were 70, 61, and 72%, respectively (from 79 total neurons). The average spot size that generated the most spikes had a diameter of 325 ± 141 μm (mean ± SD) for short-latency ON responses and 269 ± 95 μm for OFF responses. These sizes are similar to center sizes previously reported for individual WT mouse RGCs (Stone and Pinto, 1993; Carcieri et al., 2003); for comparison, results for a single RGC recorded by Stone and Pinto (1993) are plotted with the ON unit data in Figure 5A (dashed curve).
Figure 5.

The long-latency ON response of ganglion cell neurons in the mGluR6 homozygous null retina has center-surround characteristics. Receptive field organization of individual neurons was determined using nine light spots of increasing diameter presented three or five times each. Total spike counts for windows of time representing short (open triangles)- and long (open circles)-latency ON responses and OFF responses (X symbols) were normalized to the maximum count for each neuron. A, Examples of WT responses indicating typical organization of the center and antagonistic surround for an ON, OFF, and ON-OFF neuron are shown. The antagonistic surround depresses the spiking response during the presentation of the larger diameter spots. The previously published data of Stone and Pinto (1993) (dashed line) from intracellular recordings of whole-mounted mouse retina are presented in the left example. B, Examples of receptive field organization based on responses recorded from mGluR6-null retinas are shown. No short-latency ON responses were observed. Of the nine spot sizes presented, the optimal size for the long-latency response tended to be larger than that for the OFF responses in the same neurons and larger than the optimal WT spot size. Nonetheless, an antagonistic surround was observed, suppressing the responses to larger spot sizes. C, Raster plots of the spike responses to multiple presentations of spots of increasing diameter are displayed for the neuron from an mGluR6-null retina that is graphed on the right in B. The increase in latency associated with increasing spot diameter is attributable to increased brightness caused by scatter in the center as the spot size is made larger as well as activation of larger amounts of the center area.
Many OFF and long-latency ON responses in mGluR6-null retinas also show center-surround organization (Fig. 5B). The amplitude of ON responses here are quantified as the total spikes in the period from 300 ms after light onset until light offset at 2 s. The shapes of these curves are very similar to the WT curves, showing an increase in spikes as the spot size is increased until an optimal spot size is reached, followed by a decrease in spikes in response to presentation of even larger spots as more of the surround is illuminated. This decrease indicates the presence of an antagonistic surround. In mGluR6-null retinas, the percentages of RGCs with a surround for long-latency ON and OFF responses were 76 and 85%, respectively (from 137 total neurons). For the neuron shown in the rightmost plot in Figure 5B, raster plots of spiking responses to individual presentations of several of the different spot sizes are shown in Figure 5C. Surrounds for both the OFF and long-latency ON responses are apparent in these rasters. Importantly, small spot sizes produced long-latency ON spiking. The average spot size that generated the most spikes in the null had a diameter of 555 ± 539 μm for long-latency ON responses and 313 ± 492 μm for OFF responses.
In the null, these optimal spot sizes for the long-latency ON and for OFF responses appeared different based on the criterion of maximal number of spikes. To examine this difference in more detail, we determined optimal spot size using a second measure, latency to peak frequency of response for spots from 50 to 600 μm in diameter. The shortest latency, for typical ON transient and OFF responses, or the longest latency, in the case of long-latency ON responses, was used as the criterion for optimal spot size determination. For mGluR6-null OFF responses, optimal spot size was 376 ± 154 μm (mean ± SD) as judged by the latency criterion versus 313 μm as assessed by total spikes. For long-latency ON responses in the mGluR6 null, optimal spot size was smaller when determined by the latency criterion rather than by the total spikes criterion, 423 ± 228 μm versus 555 μm. WT optimal spot sizes also differed. For WT OFF responses, optimal spot size was 438 ± 133 μm using the latency criterion as compared with 269 μm using the total spikes criterion. Therefore, the differences in optimal spot sizes for ON and OFF responses in the null varied depending on the method of analysis and did not necessarily indicate a difference in the pathways that generate the responses.
In summary, a clear antagonistic surround was apparent in a large majority of RGCs, and small spots were effective at eliciting long-latency ON responses. These results are taken as evidence that the surround circuitry of the OFF system in the mGluR6-null retina is not independently responsible for generating the long-latency ON response. Rather, long-latency ON responses in OFF circuitry appear to be sufficient to drive surround circuitry and suppress, via surround antagonism, long-latency ON responses produced in the center of OFF RGC receptive fields.
Blockade of inhibition in the mGluR6-null retina does not prevent the long-latency ON response
Retinal amacrine and horizontal cells provide both wide-field and local inhibition. Wide-field circuits mediate RGC surrounds; narrow field amacrine cells could provide local inhibition to modulate spiking. To test whether any inhibitory inputs were required for the generation of the long-latency ON response, we applied inhibitory receptor antagonists to mGluR6-null retinas while recording responses to full-field light flashes. Blockade of GABA and glycine receptors, either alone or in combination, did not block the long-latency ON responses. The GABAAR antagonists picrotoxin (50 or 100 μM) and 6-imino-3-(4-methoxyphenyl)-1(6H)-pyridazinebutanoic acid (SR95531) (3 μM) were ineffective at blocking the responses. Picrotoxin is not an antagonist of the GABAC receptor in the mouse, but TPMPA does block GABAC receptors at the bipolar cell terminal in the mouse (McCall et al., 2002). TPMPA (50 μM), alone or in combination with GABAA and GABAB [(2S)-3-[[(1S)-1-(3,4-dichlorophenyl)ethyl]amino-2-hydroxypropyl](phenylmethyl) phosphinic acid (CGP55845); 3 μM] receptor blockade, was also ineffective at blocking the long-latency ON responses, although it did broaden OFF responses (data not shown), consistent with GABAC receptor antagonism (Zhang and Yang, 1997; Dong and Werblin, 1998). Strychnine (1 μM), a glycine receptor antagonist, also did not block long-latency ON responses in the mGluR6-null retinas, although it did decrease overall spiking (data not shown). The actions of strychnine and TPMPA on RGC spiking patterns indicated that these drugs were antagonizing their respective receptors under our experimental conditions. These results demonstrate that the long-latency ON response remained in the null when known inhibitory receptors, including GABAA, GABAB, GABAC, and glycine receptors, were blocked. Thus, the long-latency ON response appears to be an intrinsic property of the glutamatergic OFF circuit and does not require inhibitory circuits.
APB reveals long-latency ON responses in the WT retina
Maturation of the retina in the absence of mGluR6 function could have led to abnormal circuit development that became capable of generating an increased frequency of long-latency ON responses. We reasoned that, if the long-latency ON response were due simply to the blockade of the ON pathway, pharmacological interference with the ON pathway in the WT retina might lead to increased generation of similar long-latency ON responses. This drug activates the endogenous glutamate receptor of ON bipolar cells, which hyperpolarizes these cells and blocks their light responses. In WT retinas recorded on the multielectrode array, application of APB eliminated all of the short-latency ON responses seen in control conditions, as predicted from blockade of ON bipolar signaling (Fig. 6). In addition, a long-latency ON response emerged in RGCs (neurons with long-latency ON in APB: 63% or 312 of 497 from six treated retinas; p < 0.001, paired t test). Examples of the action of APB can be seen in the RGC raster plots and peristimulus time histograms in Figure 6. Together, these results indicate that the long-latency ON response is not a result of altered circuitry in the mGluR6 null and that the response is intrinsic to normal pathways.
ON RGCs do not have long-latency ON responses in APB
Existence of the long-latency ON response in both mGluR6-null and APB-treated, WT retinas provides strong evidence that OFF pathway circuitry was generating this response. If the long-latency ON response reflects inputs from the OFF pathway, purely ON-responding RGCs in WT retinas should not gain long-latency ON spiking in APB. We directly tested this idea by examining ON RGC responses before and after APB application. In five retinas, 49 RGCs (14%) appeared to have only ON responses to large field stimuli in control saline. The ON cells were classified using a strict standard that no more than one of the light presentation trials had any spikes after light offset.
The responses of these same 49 ON RGCs were examined after treatment with APB. Of these, 14 (or 29%) gained a long-latency ON response. Interestingly, 11 of these 14 (or 79%) also gained an OFF component to their responses in the presence of APB, with 8 having OFF spiking in at least one-half of the light presentations in the presence of APB. This suggested that these putative “ON” RGCs actually received OFF bipolar input as well and were thus ON-OFF neurons in terms of their inputs. Only 3 of the initial 49 ON RGCs had long-latency ON spiking but no OFF spikes in the presence of APB. The remaining 35 ON RGCs did not gain a long-latency ON response in APB and either completely lost all spike activity or only exhibited spontaneous spiking that appeared to be independent of the light stimulus timing.
In summary, most of the WT ON RGCs that gained a long-latency ON response in the presence of APB also developed an OFF response in APB. Conversely, most of the RGCs that gained an OFF response in the presence of APB also developed a long-latency ON response in APB. Together, these data indicate that some of the RGCs defined as “ON” when recorded in normal saline actually received input from the OFF bipolar pathway and that only RGCs with demonstrable access to the OFF pathway were capable of producing a long-latency ON response.
Multiple pathways suppress long-latency ON responses in the OFF pathway
The long-latency ON response was infrequently observed in the normal retina but appeared after APB treatment. The much lower percentage of these responses in the untreated, WT retina strongly suggests that the ON system normally actively suppresses long-latency ON responsiveness. We explored how this suppression might occur. The ON system is known to have inhibitory input to the OFF system (Wässle et al., 1986; Cohen, 1998; Zaghloul et al., 2003). Inhibitory amacrine cells driven by ON bipolar cells could suppress intrinsic long-latency ON responses in WT animals via amacrine to OFF bipolar or amacrine to OFF RGC synapses. We tested whether inhibition is capable of suppressing long-latency ON responses by applying inhibitory receptor antagonists to the WT retina and recording light responses on the multielectrode array. SR95531 (3 μM), CGP55845 (3 μM), TPMPA (30 or 50 μM), and strychnine (1 or 2 μM) were used to block GABAA, GABAB, GABAC, and glycine receptors, respectively. In four of six retinas, blockade of GABA and glycine receptors increased the percentage of RGCs with a long-latency ON response (mean ± SEM, in normal saline: 7.8 ± 3.4%; in antagonist cocktail: 29 ± 5.8%; n = 180 total neurons from four retinas; p < 0.05). In two treated retinas, a long-latency ON response did not appear in the presence of inhibitory antagonists (for n = 6 of 6 retinas: mean ± SEM, in antagonist cocktail: 20 ± 7.3%) (see Fig. 9) but did after APB was added to the cocktail. (A neuron that behaved in this way is shown in Fig. 8D.) Several examples of RGCs that gained long-latency ON responses in the presence of the inhibitory antagonist cocktail are shown in both Figures 7 and 8. The antagonist cocktail itself did not block ON transient spiking, and a second response at long latency appears in the responses of these neurons to light. We take the emergence of the long-latency ON response in inhibitory antagonists as evidence that GABAergic and glycinergic amacrine circuits can play a role in suppressing it normally.
Figure 9.

Inhibitory antagonists with and without APB cause a long-latency ON response to emerge in WT retina. Retinas perfused with normal saline (ctrl) (n = 6 total retinas) or treated with a cocktail of inhibitory antagonists (inhib. antags.) (n = 6 of 6 retinas) (see Results) or the cocktail plus APB (n = 5 of 5 retinas) are compared. The bar for each condition shows the mean percentage ± SEM of total units recorded per retina that had a long-latency ON response.
Figure 8.

Blockade of ON bipolar cell function in combination with inhibitory antagonists in the WT retina can enhance the emergent long-latency ON response. APB, an mGluR6 agonist that blocks the short-latency ON response, can enhance the long-latency ON response that emerges in the WT retina when inhibitory receptors are antagonized. A-D, The top panels show examples of the responses of WT neurons to 3 s light stimulus presentations in control saline. The middle panels show the responses of these same neurons in the presence of GABAA, GABAB, GABAC, and glycine receptor antagonists. The bottom panels show the responses of these same neurons in the presence of APB (100 μm) in addition to the inhibitory receptor antagonists. In all cases, APB eliminated the short-latency ON response. In D, the ON neuron gained an OFF component to its response in the presence of the inhibitory receptor antagonist cocktail only exhibited a long-latency ON response once APB was added. Light/dark bars show the timing of the light stimulus. Frequency (Freq) is in impulses (spikes) per second (imp/sec).
Figure 7.

Blockade of inhibition in the WT retina causes a long-latency ON response to emerge. Treatment of WT retinas with antagonists to GABAA (SR95531), GABAB (CGP55845), GABAC (TPMPA), and glycine (strychnine) receptors leads to generation of a long-latency ON response in many RGCs. A-C, The top panels show examples of neuronal responses (as trial spike rasters and their corresponding PSTHs) to 3 s light stimulus presentations in control saline, whereas the bottom panels show the responses of the same neurons while the retina was perfused with the antagonist mixture. Short-latency ON responses were maintained, and a long-latency ON response appeared. In C, the neuron also gained an OFF component to its response in the antagonists. Light/dark bars show the timing of the light stimulus. Frequency (Freq) is in impulses (spikes) per second (imp/sec).
Because the percentage of long-latency ON responses in APB alone was higher than in inhibitory antagonists alone, inhibitory blockade did not reveal all of the RGCs capable of generating these responses. To determine whether the ON pathways might also be directly suppressing the long-latency ON responses via a non-GABAergic and nonglycinergic pathway, we added APB to the inhibitory antagonist cocktail. Addition of APB in the presence of GABA and glycine receptor antagonists caused the magnitude of the long-latency ON response to be increased in many RGCs (Fig. 8). Furthermore, many RGCs that did not have long-latency ON responses in the presence of the inhibitory antagonists alone acquired them after APB was added to the antagonist cocktail (Fig. 8 D). The percentage of total neurons recorded in each retina having a long-latency ON response rose to 59 ± 8.4%, the level seen with APB alone and significantly higher than in the presence of only inhibitory antagonists (n = 5 of 5 treated retinas; p < 0.01, repeated-measures ANOVA with Tukey’s multiple comparison test) (Fig. 9). These data suggest that the ON pathway interacts with the OFF pathway through inhibitory (GABAergic or glycinergic) pathways and likely through an APB-sensitive, glutamatergic pathway as well.
Virtually all RGCs that developed a long-latency ON response in APB plus inhibitory receptor antagonists had an OFF response
The ability to pharmacologically unmask long-latency ON responses in WT retinas gave us another opportunity to test whether these responses require OFF pathway input. We examined the neurons that had long-latency ON spiking when APB was added to the inhibitory antagonists. Of these, 97 ± 2% (185 RGCs from six retinas) had OFF responses. Very few had what could be considered a long-latency ON response without also spiking at light offset. This finding independently confirms that RGCs with long-latency ON responses had input from the OFF pathway.
Discussion
Visual information flow is functionally divided into parallel streams, of which ON and OFF are two major pathways. We report that long-latency ON responses after light onset can be generated in the retina by the OFF system and transmitted to the visual cortex. In mGluR6-null mice, which lack ON bipolar signaling, many recorded RGCs had a long-latency ON response. In the retina of WT mice, blockade of ON bipolar signaling with the mGluR6 agonist APB unmasked a long-latency ON response in a majority of recorded RGCs. The presence of these ON responses contradicts the notion that ON and OFF signals are restricted to separate pathways.
Long-latency ON responses are driven by OFF pathway inputs
Several lines of evidence rule out the possibility that long-latency ON responses seen in RGCs originate from ON bipolar cells. ON bipolar cell light responses are eliminated in the mGluR6-null mice as judged by the lack of a b-wave and the elimination of short-latency ON responses in RGCs. In teleost fish, ON bipolar cell responses result from both mGluR6 activation and an anion current associated with plasma membrane glutamate transport (Grant and Dowling, 1996). This transporter current is not present in rodent retina (Euler and Masland, 2000). Thus, we conclude ON bipolars do not produce long-latency ON responses.
Instead, our data indicates that long-latency ON responses are generated by the OFF pathways and require synaptic inputs to RGCs. Long-latency ON responses occurred in neurons recorded from retinas of mGluR6 knock-out mice, which lack normal ON pathway function. In WT retinas, almost all of the strictly identified ON neurons did not generate long-latency ON spiking in APB. In WT retinas treated with APB plus inhibitory receptor antagonists, virtually all of the RGCs that developed the long-latency ON response also had OFF spiking, indicating they received OFF pathway input. Intrinsically photosensitive RGCs and cholinergic excitatory pathways were ruled out as generators of long-latency ON spiking. Finally, the response required calcium-dependent synaptic release.
Light-evoked activation of antagonistic surrounds (Kuffler, 1953) did not drive long-latency ON responses. For both OFF and long-latency ON responses in the mGluR6-null retina, smallspot stimuli caused the maximal response, whereas larger stimuli reduced the response, revealing normal surround inhibition. If the long-latency ON response were attributable to surround activation, small spots presented in the receptive field center should not have caused the response. Furthermore, inhibitory antagonists that block surround responses recorded in RGCs (Flores-Herr et al., 2001) did not block the long-latency ON response in mGluR6-null mice.
What OFF pathway mechanism generates the long-latency ON response?
The long-latency ON response appears to be a natural consequence of OFF pathway circuitry and the intrinsic properties of the neurons in the circuit. Several previously described properties of excitatory neurotransmission in the OFF pathway might account for depolarization of RGCs during a prolonged light stimulus. Glutamate release from photoreceptors and OFF bipolar cells is high in the dark. Consequently, ionotropic receptors at photoreceptor-OFF bipolar and OFF bipolar-RGC synapses will be in a more desensitized state (Tran et al., 1999; DeVries, 2000). During a light stimulus, photoreceptors and OFF bipolar cells hyperpolarize and decrease their glutamate release. RGCs with OFF inputs thus hyperpolarize initially, allowing recovery from desensitization at RGC synapses. In maintained light, photoreceptor membrane potentials and glutamate release gradually return toward dark levels as light adaptation occurs (Normann and Werblin, 1974). Similarly, OFF bipolars depolarize slowly during long light steps, returning to their initial polarization level in some cases (Euler and Masland, 2000). Glutamate released from these OFF bipolars could activate resensitized glutamate receptors, driving RGCs to spike. Additionally, bipolar cells (Ma et al., 2003) and RGCs (Tabata and Ishida, 1996) exhibit Ih, a depolarizing current activated by hyperpolarization, which could contribute to the crossing of spike threshold by RGCs. The apparent transient nature of the long-latency ON response supports these mechanisms, because depolarization would inactivate Ih and glutamate would desensitize AMPA receptors. However, RGC spiking in light but not in darkness via an OFF pathway excitatory mechanism seems to go against the known higher release of glutamate in darkness; this mechanism requires that hyperpolarization makes RGCs excitable enough to compensate for this difference. Although additional experiments would be necessary to dissect the exact origin of the response, these two mechanisms would be initial candidates to test experimentally.
ON pathways suppress long-latency ON responses
We conclude that significant suppression of the long-latency ON response in WT retina is mediated by inhibitory pathways and an APB-sensitive pathway. Known, direct inhibition from ON to OFF pathways during light steps (Wässle et al., 1986; Cohen, 1998; Zaghloul et al., 2003) could shunt or offset excitatory depolarization resulting from the OFF pathway rebound and recovery mechanisms proposed above, suggesting that the balance of inputs to an RGC critically influences its firing pattern during a long light step. Sustained inhibition from amacrines during illumination has been observed in the mouse in OFF α ganglion cells (Pang et al., 2003) and from glycinergic AII amacrines (Pang et al. 2004).
Inhibitory antagonists unmasked long-latency ON spiking in some RGCs, but further addition of APB increased the numbers of neurons showing this response. In some RGCs in the antagonist cocktail, the long-latency ON response also appeared to be of larger magnitude after APB addition. Because the retina contains group III mGluRs other than mGluR6 (Brandstätter et al., 1996), APB could activate mGluRs on RGCs or on presynaptic terminals driving RGCs. Awatramani and Slaughter (2001) reported that activation of group III mGluRs at bipolar terminals can modulate transmitter release from bipolar cells. Although APB action might also be expected to cause a general increase in release of excitatory peptidergic or other neuromodulators in the retina, as a result of relief of ON bipolar-driven inhibition, Zaghloul et al. (2003) found that APB does not alter the depolarizing response of OFF RGCs to light decrements. These data are contrary to an APB-mediated disinhibition of neuromodulatatory circuits, which would likely have altered multiple response components. Our APB results suggest glutamatergic signaling from ON bipolar cells directly or indirectly suppresses long-latency ON responsiveness.
OFF pathways can generate OFF RGC surrounds
Previous studies showing antagonist interactions from ON pathways onto OFF pathways raise the possibility that signals from the ON pathways generate surround responses in OFF center RGCs (Roska et al., 2006). We found that receptive field surrounds of OFF RGCs were normal in mGluR6-null mice. Because these retinas lack ON pathway signaling, we conclude that surrounds can be generated within the OFF pathways alone. The center-surround receptive field of the long-latency ON response suggests that both the OFF and long-latency ON responses can use the same pathways for antagonistic surrounds. Thus, the long-latency ON response of an RGC generated by center activation can be antagonized by the long-latency ON responses in other RGCs peripheral to it.
Can APB be used to separate ON and OFF signaling in higher visual centers?
Our findings suggest that some caution is advised in the interpretation of experiments in which higher visual function is examined in mGluR6-null mice or with the use of APB. In both cases, ON responses are not completely eliminated as has been typically assumed (Schiller, 1982; Knapp and Mistler, 1983; Thurlow et al., 1993). In fact, Horton and Sherk (1984) reported that a small percentage of LGN neurons driven by stimulation of an APB-treated eye had ON responses with a long latency. The existence of long-latency ON responses might also explain why both mGluR6-null and WT mice responded similarly to light increments in an avoidance test (Masu et al., 1995).
Long-latency ON responses need to be suppressed
The ON and OFF pathways remain separated until the visual cortex (Hubel and Wiesel, 1968; Schiller, 1982; Hubel and Livingstone, 1990). Having ON and OFF channels has been proposed to equalize sensitivity to increments and decrements of light, provide rapid information transfer for both types of signal, and facilitate high contrast sensitivity (Schiller, 1982). Motion perception in humans is reported to rely on signals carried independently in ON and OFF pathways (Wehrhahn and Rapf, 1992). If decrements of illumination are signaled to higher visual centers as an increase in the spiking rate of an OFF pathway, long-latency ON responses in this pathway would be a source of confusion in terms of accurately detecting light stimulus timing. Thus, actively preventing spurious spiking in the OFF pathways during light makes sense. One important function of the ON pathway in normal retina appears to be suppression of this long-latency ON response.
Acknowledgments
This work was supported by grants from National Institutes of Health (D.R.C., M.P.S., R.C.R.), That Man May See, Research to Prevent Blindness (D.R.C. received a Senior Investigator Award), and Life Sciences Research Foundation (J.C. is an Aventis Pharmaceuticals Fellow). We thank Dr. Jeff Diamond for critically reading this manuscript, members of the Copenhagen laboratory for valuable discussions, and George Nune and Dr. Jacque Duncan for technical assistance with the ERGs.
References
- Awatramani GB, Slaughter MM. Intensity-dependent, rapid activation of presynaptic metabotropic glutamate receptors at a central synapse. J Neurosci. 2001;21:741–749. doi: 10.1523/JNEUROSCI.21-02-00741.2001. [DOI] [PMC free article] [PubMed] [Google Scholar]
- Balkema GW, Jr, Pinto LH, Drager UC, Vanable JW., Jr Characterization of abnormalities in the visual system of the null mouse pearl. J Neurosci. 1981;1:1320–1329. doi: 10.1523/JNEUROSCI.01-11-01320.1981. [DOI] [PMC free article] [PubMed] [Google Scholar]
- Berson DM, Dunn FA, Takao M. Phototransduction by retinal ganglion cells that set the circadian clock. Science. 2002;295:1070–1073. doi: 10.1126/science.1067262. [DOI] [PubMed] [Google Scholar]
- Brainard DH. The psychophysics toolbox. Spat Vis. 1997;10:433–436. [PubMed] [Google Scholar]
- Brandstätter JH, Koulen P, Kuhn R, van der Putter H, Wässle H. Compartmental localization of a metabotropic glutamate receptor (mGluR7): two different active sites at a retinal synapse. J Neurosci. 1996;16:4749–4756. doi: 10.1523/JNEUROSCI.16-15-04749.1996. [DOI] [PMC free article] [PubMed] [Google Scholar]
- Carcieri SM, Jacobs AL, Nirenberg S. Classification of retinal ganglion cells: a statistical approach. J Neurophysiol. 2003;90:1704–1713. doi: 10.1152/jn.00127.2003. [DOI] [PubMed] [Google Scholar]
- Cohen ED. Interactions of inhibition and excitation in the light-evoked currents of X type retinal ganglion cells. J Neurophysiol. 1998;80:2975–2990. doi: 10.1152/jn.1998.80.6.2975. [DOI] [PubMed] [Google Scholar]
- DeVries SH. Bipolar cells use kainate and AMPA receptors to filter visual information into separate channels. Neuron. 2000;28:847–856. doi: 10.1016/s0896-6273(00)00158-6. [DOI] [PubMed] [Google Scholar]
- Dong CJ, Werblin FS. Temporal contrast enhancement via GABAC feedback at bipolar terminals in the tiger salamander retina. J Neurophysiol. 1998;79:2171–2180. doi: 10.1152/jn.1998.79.4.2171. [DOI] [PubMed] [Google Scholar]
- Drager UC, Olsen JF. Ganglion cell distribution in the retina of the mouse. Invest Ophthalmol Vis Sci. 1981;20:285–293. [PubMed] [Google Scholar]
- Euler T, Masland RH. Light-evoked responses of bipolar cells in a mammalian retina. J Neurophysiol. 2000;83:1817–1829. doi: 10.1152/jn.2000.83.4.1817. [DOI] [PubMed] [Google Scholar]
- Flores-Herr N, Protti DA, Wässle H. Synaptic currents generating the inhibitory surround of ganglion cells in the mammalian retina. J Neurosci. 2001;21:4852–4863. doi: 10.1523/JNEUROSCI.21-13-04852.2001. [DOI] [PMC free article] [PubMed] [Google Scholar]
- Gordon JA, Stryker MP. Experience-dependent plasticity of binocular responses in the primary visual cortex of the mouse. J Neurosci. 1996;16:3274–3286. doi: 10.1523/JNEUROSCI.16-10-03274.1996. [DOI] [PMC free article] [PubMed] [Google Scholar]
- Grant GB, Dowling JE. On bipolar cell responses in the teleost retina are generated by two distinct mechanisms. J Neurophysiol. 1996;76:3842–3849. doi: 10.1152/jn.1996.76.6.3842. [DOI] [PubMed] [Google Scholar]
- Green DG, Guo H, Pillers DA. Normal photoresponses and altered b-wave responses to APB in the mdx(Cv3) mouse isolated retina ERG supports role for dystrophin in synaptic transmission. Vis Neurosci. 2004;21:739–747. doi: 10.1017/S0952523804215085. [DOI] [PMC free article] [PubMed] [Google Scholar]
- Horton JC, Sherk H. Receptive field properties in the cat’s lateral geniculate nucleus in the absence of on-center retinal input. J Neurosci. 1984;4:374–380. doi: 10.1523/JNEUROSCI.04-02-00374.1984. [DOI] [PMC free article] [PubMed] [Google Scholar]
- Hubel DH, Livingstone MS. Color and contrast sensitivity in the lateral geniculate body and primary visual cortex of the macaque monkey. J Neurosci. 1990;10:2223–2237. doi: 10.1523/JNEUROSCI.10-07-02223.1990. [DOI] [PMC free article] [PubMed] [Google Scholar]
- Hubel DH, Wiesel TN. Receptive fields and functional architecture of monkey striate cortex. J Physiol (Lond) 1968;195:215–243. doi: 10.1113/jphysiol.1968.sp008455. [DOI] [PMC free article] [PubMed] [Google Scholar]
- Jeon CJ, Strettoi E, Masland RH. The major cell populations of the mouse retina. J Neurosci. 1998;18:8936–8946. doi: 10.1523/JNEUROSCI.18-21-08936.1998. [DOI] [PMC free article] [PubMed] [Google Scholar]
- Kalatsky VA, Stryker MP. New paradigm for optical imaging: temporally encoded maps of intrinsic signal. Neuron. 2003;38:529–545. doi: 10.1016/s0896-6273(03)00286-1. [DOI] [PubMed] [Google Scholar]
- Knapp AG, Mistler LA. Response properties of cells in rabbit’s lateral geniculate nucleus during reversible blockade of retinal on-center channel. J Neurophysiol. 1983;50:1236–1245. doi: 10.1152/jn.1983.50.5.1236. [DOI] [PubMed] [Google Scholar]
- Kuffler SW. Discharge patterns and functional organization of mammalian retina. J Neurophysiol. 1953;16:37–68. doi: 10.1152/jn.1953.16.1.37. [DOI] [PubMed] [Google Scholar]
- Ma YP, Cui J, Hu HJ, Pan ZH. Mammalian retinal bipolar cells express inwardly rectifying K+ currents (IKir) with a different distribution than that of Ih. J Neurophysiol. 2003;90:3479–3489. doi: 10.1152/jn.00426.2003. [DOI] [PubMed] [Google Scholar]
- Massey SC, Redburn DA, Crawford ML. The effects of 2-amino-4-phosphonobutyric acid (APB) on the ERG and ganglion cell discharge of rabbit retina. Vision Res. 1983;23:1607–1613. doi: 10.1016/0042-6989(83)90174-8. [DOI] [PubMed] [Google Scholar]
- Masu M, Iwakabe H, Tagawa Y, Miyoshi T, Yamashita M, Fukuda Y, Sasaki H, Hiroi K, Nakamura Y, Shigemoto R, Takada M, Nakamura K, Nakao K, Katsuki M, Nakanishi S. Specific deficit of the ON response in visual transmission by targeted disruption of the mGluR6 gene. Cell. 1995;80:757–765. doi: 10.1016/0092-8674(95)90354-2. [DOI] [PubMed] [Google Scholar]
- McCall MA, Lukasiewicz PD, Gregg RG, Peachey NS. Elimination of the rho1 subunit abolishes GABAC receptor expression and alters visual processing in the mouse retina. J Neurosci. 2002;22:4163–4174. doi: 10.1523/JNEUROSCI.22-10-04163.2002. [DOI] [PMC free article] [PubMed] [Google Scholar]
- Nirenberg S, Meister M. The light response of retinal ganglion cells is truncated by a displaced amacrine circuit. Neuron. 1997;18:637–650. doi: 10.1016/s0896-6273(00)80304-9. [DOI] [PubMed] [Google Scholar]
- Nomura A, Shigemoto R, Nakamura Y, Okamoto N, Mizuno N, Nakanishi S. Developmentally regulated postsynaptic localization of a metabotropic glutamate receptor in rat rod bipolar cells. Cell. 1994;77:361–369. doi: 10.1016/0092-8674(94)90151-1. [DOI] [PubMed] [Google Scholar]
- Normann RA, Werblin FS. Control of retinal sensitivity. I. Light and dark adaptation of vertebrate rods and cones. J Gen Physiol. 1974;63:37–61. doi: 10.1085/jgp.63.1.37. [DOI] [PMC free article] [PubMed] [Google Scholar]
- Pang JJ, Gao F, Wu SM. Light-evoked excitatory and inhibitory synaptic inputs to ON and OFF α ganglion cells in the mouse retina. J Neurosci. 2003;23:6063–6073. doi: 10.1523/JNEUROSCI.23-14-06063.2003. [DOI] [PMC free article] [PubMed] [Google Scholar]
- Pang JJ, Gao F, Wu SM. Light-evoked current responses in rod bipolar cells, cone depolarizing bipolar cells and AII amacrine cells in darkadapted mouse retina. J Physiol (Lond) 2004;558:897–912. doi: 10.1113/jphysiol.2003.059543. [DOI] [PMC free article] [PubMed] [Google Scholar]
- Pelli DG. The VideoToolbox software for visual psychophysics: transforming numbers into movies. Spat Vis. 1997;10:437–442. [PubMed] [Google Scholar]
- Roska B, Molnar A, Werblin FS. Parallel processing in retinal ganglion cells: how integration of space-time patterns of excitation and inhibition form the spiking output. J Neurophysiol. 2006;95:3810–3822. doi: 10.1152/jn.00113.2006. [DOI] [PubMed] [Google Scholar]
- Sagdullaev BT, McCall MA. Stimulus size and intensity alter fundamental receptive-field properties of mouse retinal ganglion cells in vivo. Vis Neurosci. 2005;22:649–659. doi: 10.1017/S0952523805225142. [DOI] [PubMed] [Google Scholar]
- Schiller PH. Central connections of the retinal ON and OFF pathways. Nature. 1982;297:580–583. doi: 10.1038/297580a0. [DOI] [PubMed] [Google Scholar]
- Schoepp DD, Jane DE, Monn JA. Pharmacological agents acting at subtypes of metabotropic glutamate receptors. Neuropharmacology. 1999;38:1431–1476. doi: 10.1016/s0028-3908(99)00092-1. [DOI] [PubMed] [Google Scholar]
- Segev R, Goodhouse J, Puchalla J, Berry MJ., II Recording spikes from a large fraction of the ganglion cells in a retinal patch. Nat Neurosci. 2004;7:1154–1161. doi: 10.1038/nn1323. [DOI] [PubMed] [Google Scholar]
- Slaughter MM, Miller RF. 2-Amino-4-phosphonobutyric acid: a new pharmacological tool for retina research. Science. 1981;211:182–185. doi: 10.1126/science.6255566. [DOI] [PubMed] [Google Scholar]
- Stone C, Pinto LH. Receptive field organization of retinal ganglion cells in the spastic null mouse. J Physiol (Lond) 1992;456:125–142. doi: 10.1113/jphysiol.1992.sp019330. [DOI] [PMC free article] [PubMed] [Google Scholar]
- Stone C, Pinto LH. Response properties of ganglion cells in the isolated mouse retina. Vis Neurosci. 1993;10:31–39. doi: 10.1017/s0952523800003205. [DOI] [PubMed] [Google Scholar]
- Sugihara H, Inoue T, Nakanishi S, Fukuda Y. A late ON response remains in visual response of the mGluR6-deficient mouse. Neurosci Lett. 1997;233:137–140. doi: 10.1016/s0304-3940(97)00656-3. [DOI] [PubMed] [Google Scholar]
- Tabata T, Ishida AT. Transient and sustained depolarization of retinal ganglion cells by Ih. J Neurophysiol. 1996;75:1932–1943. doi: 10.1152/jn.1996.75.5.1932. [DOI] [PubMed] [Google Scholar]
- Tagawa Y, Sawai H, Ueda Y, Tauchi M, Nakanishi S. Immunohistological studies of metabotropic glutamate receptor subtype 6-deficient mice show no abnormality of retinal cell organization and ganglion cell maturation. J Neurosci. 1999;19:2568–2579. doi: 10.1523/JNEUROSCI.19-07-02568.1999. [DOI] [PMC free article] [PubMed] [Google Scholar]
- Thurlow GA, Bowling DB, Cooper RM. ON and OFF activity gradients in the lateral geniculate nucleus of the cat: a combined 14C 2-deoxyglucose and d,l-2-amino-4-phosphonobutyric acid study. Vis Neurosci. 1993;10:1027–1033. doi: 10.1017/s0952523800010130. [DOI] [PubMed] [Google Scholar]
- Tian N, Copenhagen DR. Visual stimulation is required for refinement of ON and OFF pathways in postnatal retina. Neuron. 2003;39:85–96. doi: 10.1016/s0896-6273(03)00389-1. [DOI] [PubMed] [Google Scholar]
- Tian N, Slaughter MM. Correlation of dynamic responses in the ON bipolar neuron and the b-wave of the electroretinogram. Vision Res. 1995;35:1359–1364. doi: 10.1016/0042-6989(95)98715-l. [DOI] [PubMed] [Google Scholar]
- Tran MN, Higgs MH, Lukasiewicz PD. AMPA receptor kinetics limit retinal amacrine cell excitatory synaptic responses. Vis Neurosci. 1999;16:835–842. doi: 10.1017/s0952523899165039. [DOI] [PubMed] [Google Scholar]
- Vardi N, Morigiwa K. ON cone bipolar cells in rat express the metabotropic receptor mGluR6. Vis Neurosci. 1997;14:789–794. doi: 10.1017/s0952523800012736. [DOI] [PubMed] [Google Scholar]
- Warren EJ, Allen CN, Brown RL, Robinson DW. Intrinsic light responses of retinal ganglion cells projecting to the circadian system. Eur J Neurosci. 2003;17:1727–1735. doi: 10.1046/j.1460-9568.2003.02594.x. [DOI] [PMC free article] [PubMed] [Google Scholar]
- Wässle H, Schafer-Trenkler I, Voigt T. Analysis of a glycinergic inhibitory pathway in the cat retina. J Neurosci. 1986;6:594–604. doi: 10.1523/JNEUROSCI.06-02-00594.1986. [DOI] [PMC free article] [PubMed] [Google Scholar]
- Wehrhahn C, Rapf D. ON- and OFF-pathways form separate neural substrates for motion perception: psychophysical evidence. J Neurosci. 1992;12:2247–2250. doi: 10.1523/JNEUROSCI.12-06-02247.1992. [DOI] [PMC free article] [PubMed] [Google Scholar]
- Zaghloul KA, Boahen K, Demb JB. Different circuits for ON and OFF retinal ganglion cells cause different contrast sensitivities. J Neurosci. 2003;23:2645–2654. doi: 10.1523/JNEUROSCI.23-07-02645.2003. [DOI] [PMC free article] [PubMed] [Google Scholar]
- Zhang DQ, Yang XL. OFF pathway is preferentially suppressed by the activation of GABA(A) receptors in carp retina. Brain Res. 1997;759:160–162. doi: 10.1016/s0006-8993(97)00340-5. [DOI] [PubMed] [Google Scholar]