Abstract
In this study, we investigated whether activated T cells (ATC) armed with bispecific antibodies (aATC) can inhibits tumor growth and MDSC development in a Th1 cytokine–enriched (IL-2 and IFN-γ) microenvironment. Cytotoxicity mediated by aATC was significantly higher (P <0.001) against breast cancer cell lines in the presence of Th1 cytokines as compared with control co-cultures. In the presence of aATC, CD33+/CD11b+/CD14−/HLA-DR−MDSC population was reduced significantly under both control (P <0.03) and Th1-enriched (P <0.036) culture conditions. Cytokine analysis in the culture supernatants showed high levels of MDSC suppressive chemokines CXCL9 and CXCL10 in Th1-enriched culture supernatants with highly significant increase (P <0.001) in the presence of aATC. Interestingly, MDSC recovered from co-cultures without aATC showed potent ability to suppress activated T-cell-mediated cytotoxicity (P <0.001), IFN-γ production (P <0.01) and T-cell proliferation (P <0.05) compared to those recovered from aATC-containing co-cultures. These data suggest that aATC can mediate enhanced killing of tumor cells and may suppress MDSC and Treg differentiation, and presence of Th1 cytokines potentiates aATC-induced suppression of MDSC, sug-gesting that Th1-enriching immunotherapy may be benefi-cial in cancer treatment.
Keywords: 3D culture model, Breast cancer, Activated T cells, Bispecific antibody, Peripheral blood mononuclear cells, Myeloid-derived suppressor cells
Introduction
A growing body of evidence suggests that host immune cells with a suppressive phenotype limit the efficacy of immunotherapy regimens and facilitate tumor progression [1–4]. Among the suppressor cell types, regulatory T cells (Tregs), tumor-associated macrophages, and myeloid-derived suppressor cells (MDSC) are key suppressor cell populations that accumulate and mediate immune tolerance in tumors and secondary lymphoid tissues in hosts with advanced malignancies [5–7]. MDSC are defined as a Lin−HLA-DR−CD33+ cells that are associated with disease progression and tumor burden and possess potent ability to suppress tumor-specific T-cell responses through the induction of T-cell anergy and the development of Tregs [8, 9]. Inhibition of MDSC function has been shown to delay tumor growth, suggesting that MDSC-mediated immune suppression can be reversed [10, 11].
Many cytokines, including interleukin 6 (IL-6), inter-leukin 13 (IL-13), granulocyte–macrophage colony-stimulating factor (GM-CSF), granulocyte-stimulating factor (G-CSF) and interferon γ (IFN-γ), have been implicated in the development and induction of effector functions of MDSC [9, 12–16]. Tumors themselves can release IL-6, IL-13, GM-CSF and G-CSF that in turn can lead to the recruitment and differentiation of granulocytic and monocytic precursors [17] possibly through the activation of the STAT3 signal transduction pathway [3, 18]. In our phase I clinical trial involving stage IV breast cancer patients who received activated T cells (ATC) armed with anti-CD3 × anti-Her2/neu bispecific antibody (Her2Bi), high levels of specific cytotoxicity by PBMC and circulating Th1 cytokines were observed [19, 20]. Since Th1 cytokine IFN-γ has been implicated in the induction and activation of MDSC, we asked whether: (1) a Th1 cytokine–enriched (IL-2 and IFN-γ) microenvironment inhibits tumor growth and MDSC development; (2) Th1-enriched microenvironment enhances targeted killing of tumor cells by Her2Bi-armed ATC (aATC); and (3) co-culture of tumor cells with aATC affects the development and suppressive ability of MDSC. Our data show that tumor spheres formed by breast cancer (BrCa) cell lines were visibly smaller in size in a Th1-enriched microenvironment, and differentiation of granulocytic CD14−/HLA-DR−/CD11b+/CD33+ and monocytic CD14+/HLA-DR−/CD11b+/CD33+MDSC populations was reduced with further reduction and attenuation of their suppressive activity in presence of aATC.
Materials and methods
Cell lines
The human breast cancer (BrCa) cell lines (SK-BR-3 and MDA-MB-231) were maintained in RPMI-1640 or DMEM culture media (Lonza Inc., Allendale, NJ) supplemented with 10% FBS (Lonza Inc.), 2 mM L-glutamine (Invitro-gen, Carlsbad, CA), 50 units/ml penicillin and 50 μg/ml streptomycin (Invitrogen).
Expansion and generation of ATC
CD3+ T cells from PBMC were expanded using 20 ng/ml of OKT3 and 100 IU/ml of IL-2 for 14 days at a concentration of 1–2 × 10⁶ PBMC/ml in RPMI-1640 supplemented with 10% FBS [21].
Production of anti-OKT3 × anti-Her2 bispecific antibodies
BiAb were produced by chemical heteroconjugation of OKT3 (a murine IgG2a anti-CD3 monoclonal antibody, Ortho Biotech, Horsham, PA) and Herceptin (a humanized anti-Her2 IgG1, Genentech Inc., San Francisco, CA) as described [21]. Before use, ATC were armed with anti-CD3 × anti-Her2 (Her2Bi) bispecific antibodies (aATC) using a previously optimized concentration of BiAb (50 ng/106 ATC) for 30 min.
3D culture in matrigel
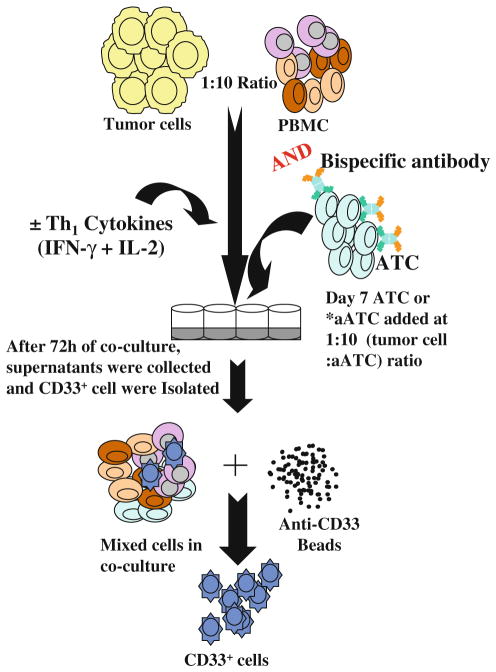
Cells were prepared at a concentration of 2,500 cells/ml in RPMI-1640 or DMEM culture media. Single cells are overlaid on a solidified layer of matrigel measuring approximately 1 mm in thickness as described [22]. Wells were coated with 100% matrigel in 0.25-ml aliquots in 24-well glass bottom plates and allowed to solidify by incubating at 37°C for 30 min. Breast cancer cells were then seeded onto the matrigel base as a single-cell suspension in the medium containing 2% matrigel, in the presence or absence of Th1 cytokines (10 ng/ml IFN-γ and 100 IU/ml IL-2). After 5–7 days when tumor spheres were formed, PBMC were added at 10:1 ratio (10 PBMC/1 tumor cell). Her2Bi-armed ATC were added after 7 days of tumor cell and PBMC 3D co-culture at 10:1 (10 aATC/1 tumor cell) ratio (Fig. 1). The medium was replaced every 4 days. Tumor spheres were visualized in 5–7 days in 3D culture. In selected experiments, recombinant human MIG/ CXCL9 (100 ng/ml) and IP-10/CXCL10 (100 ng/ml) were added to control cultures in the presence or absence of aATC.
Fig. 1.
Co-cultures in 3D model to assess the effects of Th1 cytokines and Her2Bi-armed ATC (aATC) on the development and regulatory activity of MDSC. PBMC were plated in matrigel at 1:10 (tumor cell/ PBMC). aATC were added after a week of tumor cells and PBMC co-culture. Following 3–5 days of additional co-culture, matrigel was digested and single-cell suspension was harvested for phenotyping or separation of CD33+ cells to evaluate their functional properties. Culture supernatants were assessed for cytokine levels
Live cell imaging by inverted confocal microscopy using DiI and DiO dyes
Images were observed with a spinning disk microscope (Perkin Elmer UltraVIEW). Vybrant® DiI or DiO was added directly to normal culture media to uniformly label either cell suspensions (activated T cells) or adherent cells (BrCa) and incubated for 5 and 10 min at 37°C, respectively. Tumor spheres stained on the matrigel were washed thrice, similarly non-adherent ATC after loading were spun down, rinsed (3×) and resuspended in fresh medium before adding these cells to DiO-labeled tumor cells. Immuno-stained co-cultures were photographed using a Perkin Elmer UltraVIEW microscope. These dyes uniformly label cells via lateral diffusion in the plasma membrane and do not transfer from labeled to unlabeled cells. DiI (D3911) and DiO (D275) have fluorescence excitation and emission maxima separated by about 65 nm and thus can facilitate two-color labeling.
Cytotoxicity assay
Tumor cells were seeded in 24-well plate at 100,000 cells/ well in volume of 1 ml. Cells were allowed to adhere followed by incubation with aATC for 3–5 days at 1:1 E/T in the presence or absence of Th1 cytokines. At the end of incubation, 3-(4,5-dimethylthiazolyl-2)-2,5-diphenyltetrazo-lium bromide (MTT) was added (40 μl/well of 5 mg/ml MTT in PBS) to each well and incubated in the dark for 3 h at 37°C. After removal of the medium, the dye crystals formed in viable cells were dissolved in isopropanol and detected by reading the absorption at 595 nm in the Tecan Ultra plate reader. Experiments were repeated three times in quadruplicate wells to ensure the reproducibility of results.
Flow cytometric quantification of CD11b+CD33+/ HLA-DR− MDSC and CD4+/CD25+/CD127lo regulatory T cells
The phenotype of MDSC generated in 3D co-culture of tumor cells with PBMC was evaluated for the expression of CD33, CD11b, CD14 and HLA-DR. After non-adherent cells were collected, matrigel was digested to collect tumor cells, tumor-associated MDSC or Tregs, washed with FACS buffer (0.2% BSA in PBS). Cells collected prior to digestion were pooled with matrigel-digested single-cell suspension before staining. Cells were stained for 30 min on ice with mixtures of fluorescently conjugated mAbs or isotype-matched controls, washed twice with FACS buffer and analyzed. Antibodies used for staining include: anti-CD3, -CD4, -CD25, -CD127, -CD11b, -CD14, -CD33, and -HLA-DR (BD Biosciences San Jose, CA). Cells were analyzed on a FACScalibur (BD Biosciences), and data were analyzed using CellQuest software (BD Biosciences). Cells were gated for CD14−/HLA-DR− and CD14+/ HLA-DR− expression and analyzed for CD11b+ versus CD33+ expression. Tregs were determined by gating for CD4+ expression and analyzed for CD25hi versus CD127lo expression.
Cytokine profiling of co-cultures
Cytokines were quantitated in culture supernatants collected from matrigel co-cultures in the presence or absence of Th1 cytokines and in the presence or absence of armed ATC using a 25-plex human cytokine Luminex Array (Invitrogen, Carlsbad, CA) on a Bio-Plex system (Bio-Rad Lab., Hercules, CA). The limit of detection for these assays is <10 pg/ml based on detectable signal of greater than twofold above background (Bio-Rad). Cytokine concentrations were automatically calculated by the BioPlex Manager Software (Bio-Rad).
MDSC isolation
Cells were collected from the digested matrigel cultures. CD33+ cells were isolated from each culture using anti-CD33 magnetic microbeads (Miltenyi Biotec,). The purity of isolated cell populations was found to be>90% by flow cytometry.
Inhibition of IFN-γ-secretion by MDSC
Effect of MDSC on IFN-γ production by tumor cell stimulated aATC were detected by IFN-γ-specific EliSpot assay (BD Biosciences, San Jose, CA). Positive control EliSpots were assessed after 18 h exposure to the stimulant cells at 10:1 effector to target ratio (E/T). Effect of MDSC was assessed at 10:2:1 ratio (10 aATC: 2 MDSC: 1 tumor cell) in EliSpot plates [28]. Spots were captured and counted on CTL Immunospot counter using Immu-nospot software version 4 (Cellular Technology Ltd, Shaker Heights, OH).
Inhibition of T-cell proliferation by MDSC
To measure the inhibitory capacity of the MDSC cells, CD33+ cells isolated from matrigel co-cultures were co-incubated with purified CD3+ T cells. Briefly, purified CD3 + T cells plated at 0.5 × 10⁴ cells/well in 96-well microtiter plates coated with anti-CD3 antibodies (0.5 μg/ ml in PBS), and irradiated (2,500 rads) CD33+ cells were added at various ratios of MDSC/T cells ranging from 1:5 to 1:20 in a final volume of 200 μl of medium. Control wells did not receive any MDSC. The plates were incu-bated for 72 h at 37°C in humidified 5% CO2 atmosphere followed by a proliferation assay determined by titer-Glo (Promega).
Inhibition of cytotoxicity by MDSC
MDSC suppression of aATC-mediated cytotoxicity directed at specific targets was measured by chromium (51Cr) release assay in 96-well flat-bottomed microtiter plates as described [25]. Briefly, aATC were added to target cells at 10:1 E/T in the absence or presence of CD33+ cells at 10:2:1 (aATC/MDSC/tumor cell) ratio. 51Cr release was measured after 18 h, and percent cytotoxicity was calculated using the following formula: (experimental cpm – spontaneous cpm)/(maximum cpm – spontaneous cpm) × 100.
Statistical analysis
Quantitative data are presented as the mean of at least three or more independent experiments ± standard deviation. A one-way ANOVA was used to determine whether there were statistically significant differences within each experiment. Differences between groups were tested via an unpaired, two-tailed t test.
Results
Th1 cytokine–enriched microenvironment inhibits tumor growth
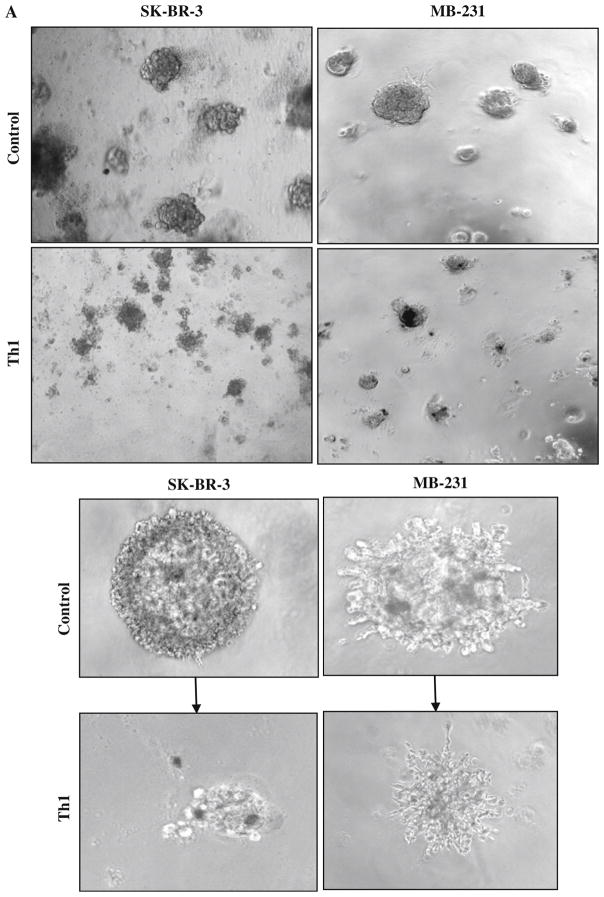
First, we explored whether Th1 cytokine–enriched micro-environment can suppress tumor growth. To this end, we set up the matrigel (3D) cultures of BrCa (SK-BR-3 and MDA-MB-231) cell lines in the presence or absence of IFN-γ (10 ng/ml) and IL-2 (100 IU/ml). SK-BR-3 cells over-expresses Her2/neu with epitheloid morphology, whereas MDA-MB-231 is a triple-negative and highly invasive cell line with mesenchymal morphology. Both BrCa cell lines grown under Th1 cytokine–enriched conditions exhibited smaller tumor spheres in 3D culture as compared to larger tumor spheres in regular growth medium without Th1 cytokines (Fig. 2a, top at 20× and bottom panel at 100× magnification).
Fig. 2.
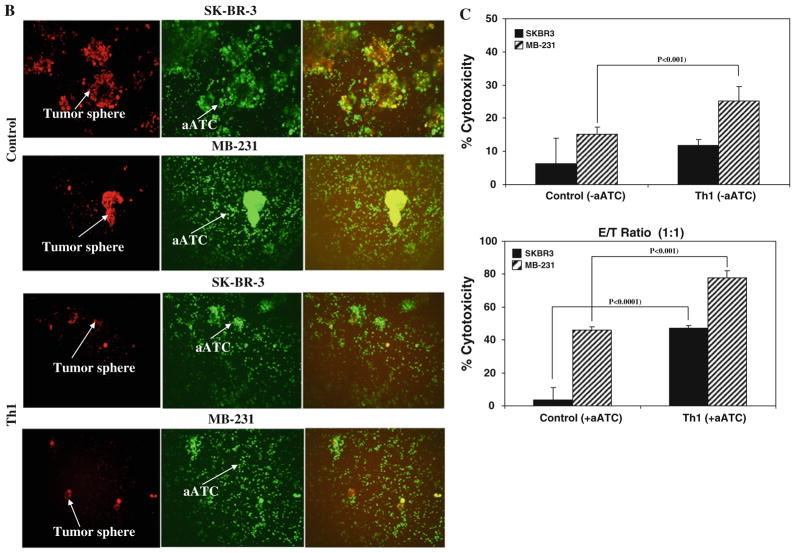
a Shows the effect of Th1 cytokines on tumor growth at day 7 using inverted microscopy. Visibly reduced size of tumor spheres for SK-BR-3 and MB-231 BrCa cells were evident under Th1 cytokines when compared with control condition (top panels, 20×; bottom panels, 100× magnification). b Confocal imaging of BrCa cells labeled with DiI (red fluorescent dye) at day 7 followed by co-culture with DiO (green fluorescent dye)-labeled aATC at a 10:1 E/T for an additional 72 h shows that armed ATC was able to engage tumor cells. In the presence of Th1 cytokines, reduced size of tumor spheres were observed (20× magnification). c Cytotoxicity quantitated by MTT assay in 2D cultures of tumor cells and aATC for 3 days at an E/T ratio of 1:1
Th1 cytokine–enriched microenvironment enhances aATC-mediated tumor cell killing
Next, we tested whether the Th1 cytokine–enriched microenvironment promoted aATC-mediated killing of tumor spheres. This was tested using visual inspection by confocal imaging in 3D cultures and by the MTT assay in 2D cultures. For confocal imaging, BrCa cells were labeled with DiI (red) at day 7 followed by co-culture with DiO (green)-labeled aATC at a 10:1 E/T for an additional 72 h. Confocal imaging show that aATC completely surrounded the tumor spheres, suggesting highly efficient binding of aATC with tumor cells in the presence or absence of Th1 cytokines. In the presence of Th1 cyto-kines, aATC are able to kill tumor spheres effectively as evidenced by a marked decrease in tumor spheres (Fig. 2b). Figure 2b shows confocal imaging of SK-BR3 (upper panels) and MDA-MB-231(lower panels). These results show that Th1 cytokines inhibit tumor growth and prime tumor cells for enhanced killing by aATC. Cyto-toxicity quantitated by MTT assay in 2D cultures of tumor cells and aATC for 3–5 days at 1:1 (Fig. 2c) E/T in the presence or absence of Th1 cytokines corroborate the results of confocal imaging that Th1 cytokines render susceptibility to tumor cells for aATC (n = 3; P <0.001)-mediated killing (Fig. 2c).
Th1 cytokine–enriched microenvironment inhibits MDSC development
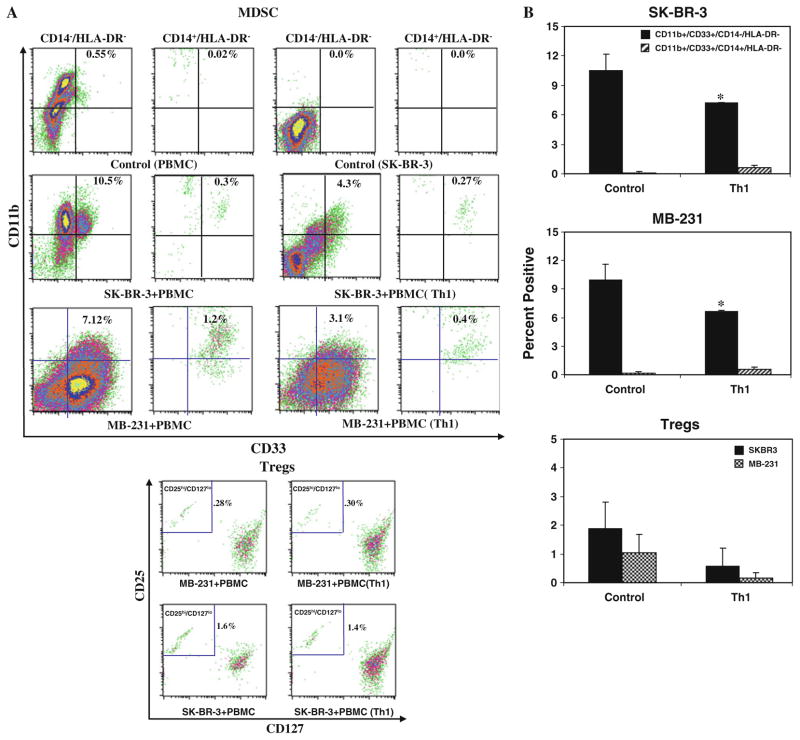
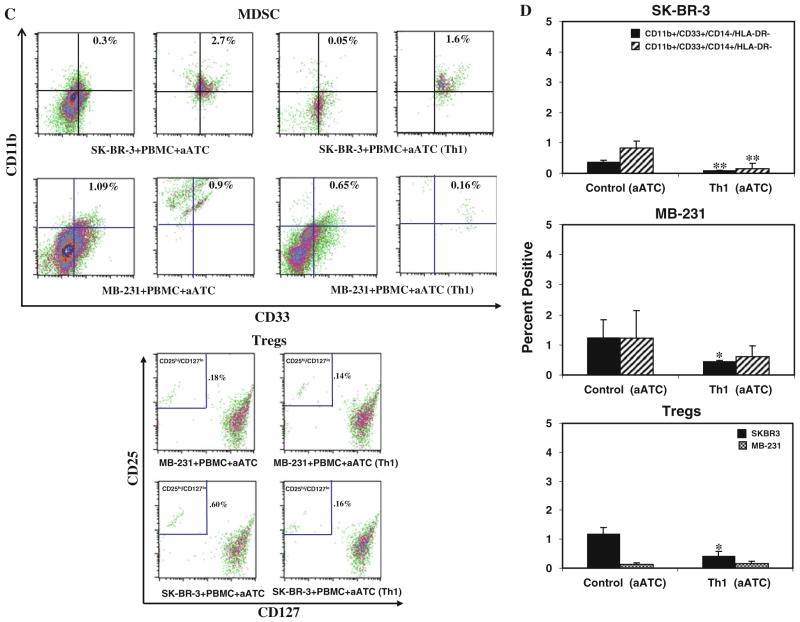
Since IFN-γ has been reported to have conflicting effects on MDSC development, we asked whether a Th1 cyto-kine–enriched microenvironment can modulate MDSC development. A representative flow cytometric analysis of MDSC populations presented in Fig. 3a clearly shows a reduced percentage of CD33+/CD11b+/CD14−/HLA-DR− MDSC population in the presence of Th1 cytokines for both cell lines. Quantitative data in Fig. 3b show that CD33+/CD11b+/CD14−/HLA-DR− MDSC population is significantly reduced for both cell lines (SK-BR-3 co-cultures, P <0.013; for MB-231 co-cultures, P <0.037) in the presence of Th1 cytokines compared to co-culture without Th1 cytokines. Percentage of CD33+/CD11b+/ CD14+/HLA-DR− population slightly increased in the presence of Th1 cytokines compared to co-cultures without Th1 cytokines, but the difference was not significant (n = 3). These data suggest that Th1 cytokine–enriched microenvironment inhibits the development of MDSC. No difference was observed for the Treg CD4+/CD25hi/ CD127lo population in the presence or absence of Th1 cytokines for both cell lines (Fig. 3a, b, bottom panels).
Fig. 3.
Shows a representative flow cytometry data for MDSC and Treg populations in the presence or absence of Th1 cytokines and aATC for SK-BR-3 and MB-231 co-cultures. a Flow cytometry showing the MDSC populations, CD11b+ and CD33+ population was gated on either CD14−/HLA-DR− (granulocytic) or CD14+/HLA-DR− (monocytic) cell populations. The granulocytic population was reduced by less than half in the presence of Th1 cytokines. The lower panel shows the flow cytometry data for Treg cells in the presence or absence of Th1 cytokines, CD25hi and CD127lo population was gated on CD4+ cells. b Shows the quantitative data (n = 3) for MDSC (upper and middle panels) and Treg populations under control and Th1 culture conditions (lower panel). c Shows the representative flow cytometry data for MDSC for SK-BR-3 (upper panel, top) and for MB-231 (upper panel, bottom) and Treg (lower panel) populations in the presence or absence of Th1 cytokines and aATC. Both MDSC and Tregs were reduced in the presence of Th1 cytokines and/or aATC. d Shows the quantitative data (n = 3) for MDSC and Treg populations in the presence or absence of Th1 cytokines and aATC for both cell lines. */**signifies statistically significant differences between control and Th1-enriched culture conditions in the presence or absence of aATC (*P <0.05, **P <0.01)
Her2Bi-armed activated T cells (aATC) inhibit the development of MDSC and Tregs under both control and Th1 cytokine–enriched conditions Because aATC-mediated killing of tumor cells produce Th1 cytokines and chemokines, we hypothesized that microenvi-ronment generated during aATC interaction with tumor cells modulate the function or development of MDSC. A representative flow analysis of MDSC and Treg populations is shown in the presence of aATC under both control and Th1 cytokine–enriched culture conditions for SK-BR-3 and MB-231 in Fig. 3c (upper and lower panels). Reduction in CD33+/CD11b+/CD14−/HLA-DR− MDSC population was highly significant under both control (SK-BR-3, P <0.0001; MB-231, P <0.03) and Th1 (SK-BR-3, P <0.001; MB-231, P <0.036) conditions in the presence of aATC compared to without aATC (Fig. 3d). These data suggest that aATC-generated microenvironment leads to MDSC elimination and is not dependent on pre-existing Th1-enriched microenvironment (n = 3). Unlike MDSC, a significant suppression of CD4+/CD25hi/CD127lo Treg differentiation (P <0.028) only occurred in the presence of both a Th1 cytokines–enriched microenvironment and aATC (Fig. 3c, d, lower panels) for SK-BR-3 cells. No difference was observed for MB-231 cultures with or without Th1 cytokines and aATC.
Comparison of MDSC populations in culture conditions with or without aATC showed significantly reduced percentage of CD33+/CD11b+/CD14−/HLA-DR− MDSC population in aATC-containing control culture (P <0.001) or aATC-containing Th1-enriched culture condition (P <0.001) compared with control or Th1-enriched culture conditions without aATC. However, no difference was observed for CD33+/CD11b+/CD14+/HLA-DR− MDSC population among these culture conditions.
Her2Bi-armed activated T cells (aATC) attenuates the immunosuppressive ability of MDSC. Next, we tested whether MDSC can exhibit an inhibitory effect on T-cell functions and whether presence of Th1 cytokines and aATC can modulate the suppressive activity of MDSC.
Suppression of proliferation
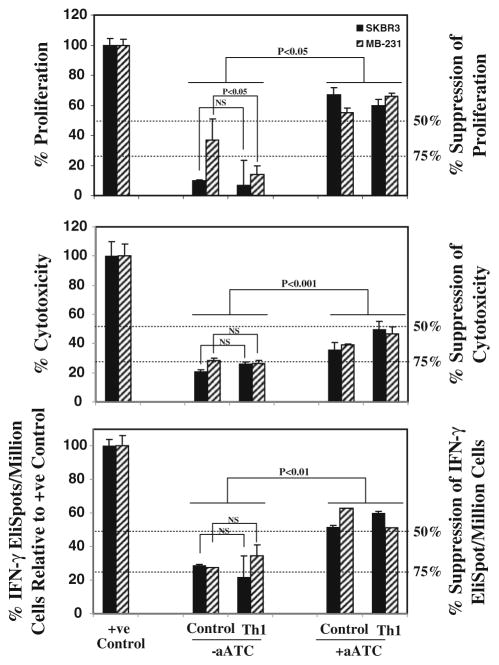
For this, cells were sorted into CD33+MDSC and co-cultured with aATC at 1:5 ratio. T-cell proliferation was suppressed by 70–90% with the addition of CD33+ MDSC; noteworthy is that cultures containing aATC reversed the suppressive ability of CD33+MDSC by >50% in the presence or absence of Th1 cytokines for both cell lines (n = 3; Fig. 4, top panel).
Fig. 4.
Functional properties of MDSC. For analysis of inhibitory ability of MDSCs, CD33+ cells were added at 1:5 (CD33+/aATC) ratio to T-cell proliferation, 1:2 ratio to cytotoxicity and IFN-γ EliSpot assays. Top panel shows the suppressive effect of CD33+ MDSC on anti-CD3-stimulated autologous T-cell proliferation. Proliferation was significantly suppressed by 70–90% in the presence of CD33+ MDSC that was reversed if aATC were present in co-cultures. CD33+ cells isolated from various culture conditions when added to positive controls (Her2Bi-armed ATC-mediated killing of SK-BR-3 for cytotoxicity; SK-BR-3 stimulated Her2Bi-armed ATC for Eli-Spots) showed approximately 75% suppression of cytotoxicity (middle panel) and IFN-γ EliSpots (bottom panel). In the presence of aATC under both control and Th1-enriched culture conditions, suppressive ability of CD33+ cells was significantly attenuated
Suppression of cytotoxicity
Furthermore, we asked whether the addition of MDSC to aATC would inhibit the ability of Her2Bi-armed ATC to kill SK-BR-3 targets at a 1:10:2 ratio (Tumor cell/aATC/ CD33+). The cytotoxicity mediated by aATC directed at SK-BR-3 targets was inhibited by 75% in the presence of CD33+ cells. Interestingly, CD33+ cells isolated from aATC-containing co-cultures showed a significant attenuation in suppressive ability of CD33+ MDSC for both BrCa cell lines (n = 3; Fig. 4, middle panel).
Suppression of IFN-γ production by aATC
CD33+ MDSC also suppressed IFN-γ production in target stimulated aATC by 70–75%. The addition of aATC to the co-cultures attenuated the suppressive ability of CD33+ MDSC by ~ 50–60% for both BrCa cell lines (n = 3; Fig. 4, bottom panel).
Low levels of IFN-γ, CXCL9 and CXCL10 were associated with increased numbers of MDSC
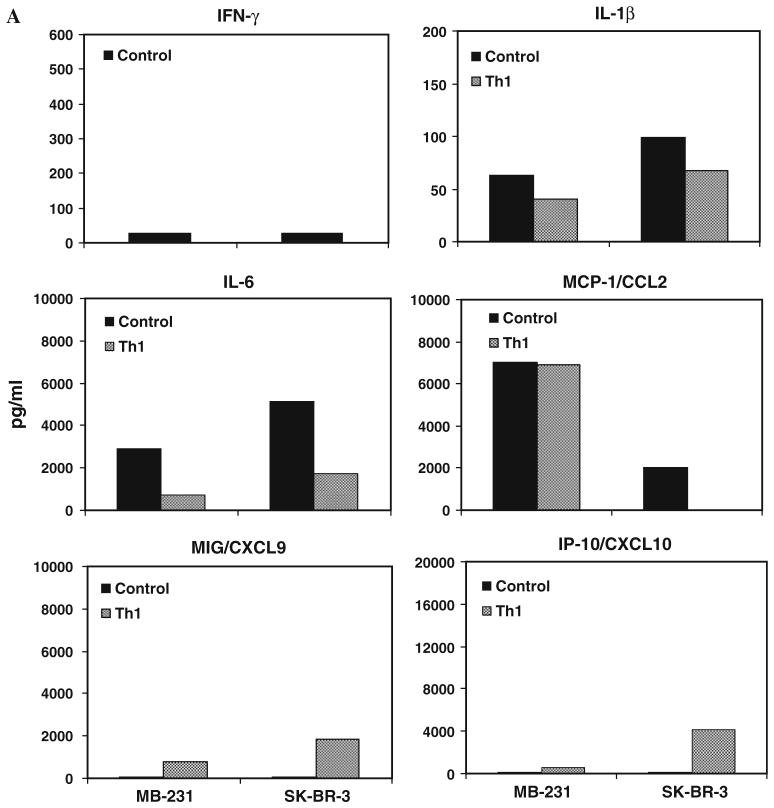
We examined whether the presence of MDSC in co-cultures will induce cytokines/chemokines that promote expansion and activation of MDSC and whether Th1 cytokine–enriched microenvironment can alter the cyto-kines/chemokines induced by MDSC. Our data show marked increases in the proinflammatory cytokines IL-1β and IL-6 in control culture supernatants compared with Th1 cytokines–enriched culture supernatants for both SK-BR-3 and MB-231 cell lines (Fig. 5a). On the other hand, IFN-γ and chemokines induced by IFN-γ MIG/CXCL9 and IP-10/ CXCL10 were present in extremely low levels in control culture supernatants compared with Th1 cytokines–enri-ched culture supernatants for both SK-BR-3 and MB-231 cell lines. Pattern for MCP-1/CCL2 expression was different in both cell lines. In MB-231, high levels of MCP-1/CCL2 were present in both Th1 cytokines–enriched culture supernatants and control culture supernatants. Whereas, in SK-BR-3, MCP-1/CCL2 protein was not detected in Th1 cytokine–enriched culture supernatants compared high levels in control culture supernatants. In Th1 cytokine–enriched microenvironment, MIG/CXCL9 and IP-10/ CXCL10 were upregulated, while IL-1β and IL-6 were downregulated with concurrent reduction in the percentage of MDSC compared with control condition. These data suggest that low levels of IFN-γ, MIG/CXCL9 and IP-10/CXCL10 along with high levels of IL-1β and IL-6 may promote MDSC differentiation.
Fig. 5.
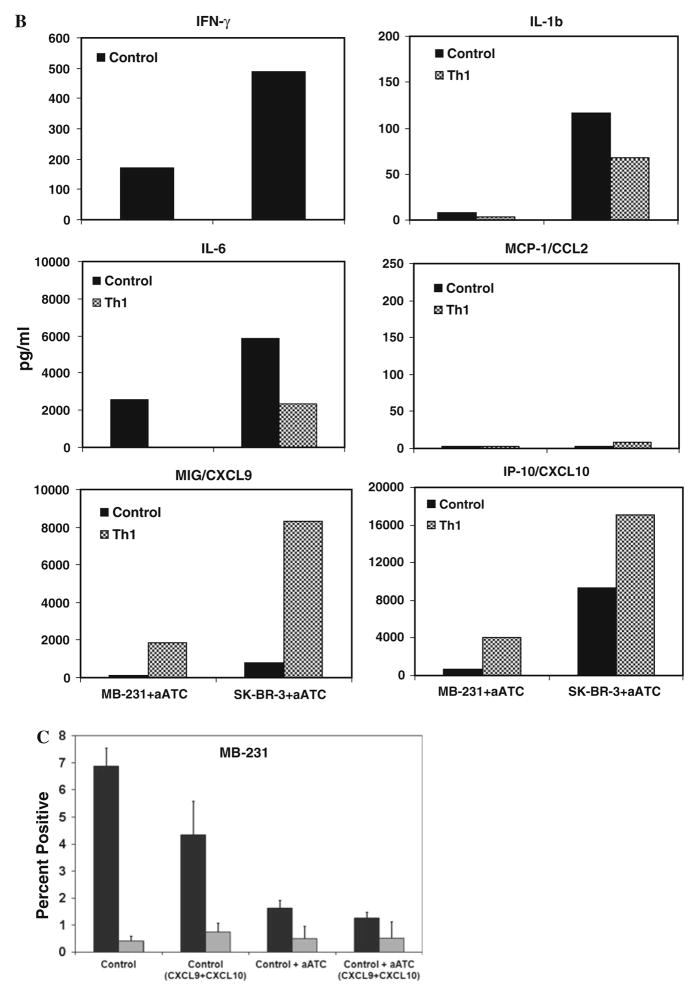
Cytokine profiles of culture supernatants detected by multiplex luminex system show the increased levels of cytokines IL-1β and IL-6, and chemokine MCP-1 in the absence of Th1 cytokines, while IFN-γ inducible chemokines MIG/ CXCL9 and IP-10/CXCL10 showed increased levels in the presence of Th1 cytokines a in the presence or absence of Th1 cytokines and b in the presence of aATC under control and Th1 cytokines, c Shows significantly reduced percentage (P <0.05) of CD33+/CD11b+/CD14−/ HLA-DR− MDSC population in the presence of recombinant human CXCL10 and CXCL9 proteins in control culture condition
Increased levels of IFN-γ, CXCL9 and CXCL10 corroborate with reduced number of MDSC
Next, we addressed whether the presence of aATC can influence the cytokine and chemokine profiles. Proinflam-matory cytokines IL-1β and IL-6 levels were not altered in the presence of aATC under control and Th1 cytokine–enriched culture conditions compared to without aATC (Fig. 5a). However, in the presence of aATC MIG/CXCL9 and IP-10/CXCL10 were highly upregulated under both control and Th1 culture conditions (Fig. 5b). These data suggest that high levels of IFN-γ-induced CXCL9 and CXCL10 may contribute in the suppression MDSC development. To confirm whether increased levels of MIG/ CXCL9 and IP-10/CXCL10 may suppress MDSC development, we added these two chemokines in control culture condition in the presence or absence of aATC. Intriguingly, co-cultures containing MIG/CXCL9 and IP-10/CXCL10 in the absence of aATC showed reduced percentage of CD33+/CD11b+/CD14−/HLA-DR− MDSC population (Fig. 5c), suggesting that MIG/CXCL9 and IP-10/CXCL10 may suppress MDSC development.
Discussion
This is the first study to show that a Th1 cytokine–enriched microenvironment hampered tumor growth, significantly enhanced aATC-mediated killing of tumor cells and significantly reduced the absolute numbers of granulocytic CD14−/HLA-DR−/CD11b+/CD33+and monocytic CD14+/ HLA-DR−/CD11b+/CD33+ MDSC populations compared with control culture conditions. More importantly, co-cultures with aATC showed highly significant reduction in MDSC populations regardless of Th1 cytokines in culture. Furthermore, CD33+ MDSC isolated from cultures containing aATC exhibited reduced suppressive ability, suggesting that aATC were able to attenuate the suppressive activity of MDSC.
In order to understand how Th1 cytokines and aATC affect the development of MDSC, we analyzed the cyto-kine profiles in the culture supernatants produced by cells in co-culture under both Th1 and control conditions with or without aATC. Our data show distinct patterns of cytokines and chemokines in Th1 cytokine–enriched versus control culture conditions. There were lower levels of cytokines IL-6 (~ threefold lower) and IL-1β under Th1 cytokines–enriched culture supernatants (contained artificially high IFN-γ) compared with control culture supernatants for both cell lines. Cytokines provide key signaling in the generation of MDSC; both IL-6 and IL-1β have been shown to promote in vitro generation and the regulation of MDSC and their suppressive function in vivo [23–25]. Consistent with these reports, our results show decreased levels of IL-6 and IL-1β associated with decreased numbers of MDSC in Th1 cytokines–enriched culture supernatants. On the other hand, increased levels of IL-6 and IL-1β in control culture supernatants were associated with increased numbers of MDSC underscoring their roles in generation and/or activation of MDSC.
Similar to cytokines, chemokines exhibited different expression patterns between control and Th1 cytokine–enriched culture conditions. Our data show higher levels of IFN-γ-induced CXC chemokines such as MIG/CXCL9 (monokine induced by IFN-γ) and IP-10/CXCL10 (inter-feron-inducible protein-10) under Th1 condition. The higher levels of IFN-γ in both cell lines were associated with decreased numbers of MDSC in co-cultures containing Th1 cytokines. Both, SK-BR-3 and MB-231, cells showed high levels of MCP-1/CCL2 expression under control condition, but levels were reduced under Th1 condition for MB-231 cells, while MCP-1/CCL2 protein was not detectable for SK-BR-3 in Th1 cytokines–enriched culture supernatants. MIG/CXCL9 and IP-10/CXCL10) are chemoattractants for IL-2 inducible CXCR3-expressing activated T cells [26, 27] and inhibit the neovascularization induced by powerful angiogenic factors such as MCP-1/ CCL2 through CXCR3 receptor signaling [28]. These CXC chemokines with their ability to recruit T cells and inhibit angiogenic activity, suggest these chemokines as potential anti-tumor factors. However it is not known how these chemokines affect MDSC differentiation in our in vitro 3D model, we hypothesize that these chemokines may potentiate the anti-tumor activity of T cells directly affecting tumor growth which in turn can affect MDSC development and activation.
Since aATC can produce IFN-γ upon interaction with tumor targets, we hypothesized that presence of aATC in control cultures (resembling the in vivo aATC immuno-therapy situation) will induce high levels of IFN-γ, CXCL10 and CXCL9 and decrease in MDSC populations. As predicted, control cultures containing aATC showed the similar pattern of cytokines and chemokines as was in Th1 cytokine–enriched culture condition without aATC. In addition, aATC in control co-cultures downregulated MCP-1/CCL2. Although the pattern of all the cytokines and chemokines was similar to Th1 cytokines–enriched culture condition except for MCP-1/CCL2, the levels were strikingly lower in cultures containing aATC under both culture conditions. MCP-1/CCL2 is an angiogenic and immuno-modulatory factor that is highly chemotactic for monocytes and regulatory T cells [29, 30] while specifically inhibiting CD8+ T-cell effector functions [31]. Huang et al. [32]. showed that the recruitment of MDSC into tumors is mediated by the CCL2/CCR2 axis and absence of CCL2/CCR2 signaling hindered both MDSC migration and MDSC-promoted tumor growth. In our in vitro 3D model, lower levels of MCP-1/CCL2 may have added effect in suppressing MDSC development in addition to suppressive affects of increased levels of IFN-γ, CXCL10 and CXCL9 on MDSC. The role of CXCL10 and CXCL9 in suppressing MDSC population was further evidenced by adding CXCL10 and CXCL9 in control culture condition that resulted in reduced percentage of MDSC (Fig. 5c).
Chemokines can play dual role in tumor development [33]. Mullins et al. [34, 35]. reported that recruitment of CD8 + T lymphocytes expressing CXCR3 by chemokines leads to the improvement of patient survival in melanoma. Lack of critical chemokines (CCL2, CXCL9 and CXCL10) in melanoma metastases aggravated disease due to blockage in activated T-cell migration and anti-tumor immunity [36]. On the other hand, the aberrant expression of chemokines in tumors has been shown to induce immuno-suppression that favors tumor growth. In hepatocellular carcinoma, high levels of CXCL9 and CXL10 have been associated with inhibition of CXCR3 expression by CD8 + T lymphocytes, reduction in T-cell tumor infiltra-tion and cytotoxic functions and tumor growth [37].
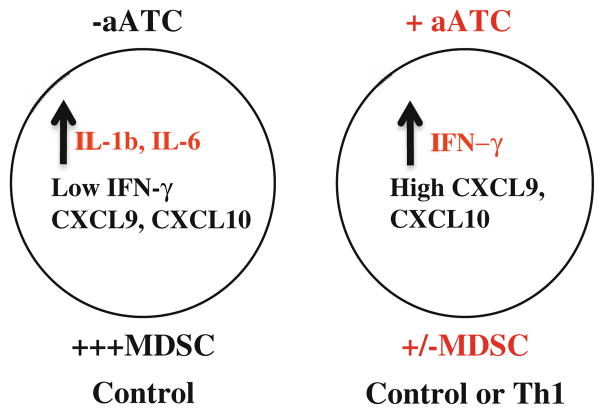
The important finding in this study is that IFN-γ was able to suppress both tumor growth and MDSC development and rendering tumor cells susceptible to enhanced aATC-mediated killing. However, the mechanisms of multiple effects of IFN-γ in our model are not clear, and thus warrants further investigation. While IFN-γ has been shown to sensitize tumor cells for enhanced Fas-mediated killing by CTL [38, 39], role of IFN-γ in the development and activation of MDSC remains controversial. However, a recent study demonstrated that activated T cells can mediate MDSC apoptosis through Fas/FasL pathway [40]. IFN-γ produced by tumor-specific T lymphocytes has been shown to trigger MDSC maturation with subsequent amplification of IL-13 and IFN-γ produced by MDSC to maintain a prolonged activation of the immunosuppressive mediators NOS and ARG [8]. On the contrary, Nonaka et al. showed that Th1-dominant tumor environmentn induced marked T-cell infiltration, created IFN-γ- and GM-CSF-rich microenvironment without IL-4 or IL-13. The absence of IL-4 and IL-13 in the Th1-dominant and T-cell infiltration-rich environment suppressed the maturation of MDSC compared with IL-4 and IL-13 (Th2-enriched microenvironment) [41]. Based on our data, we propose a working hypothesis that context-dependent homeostatic balance of various cytokines and chemokines may determine their pro or anti-MDSC activity (Fig. 6).
Fig. 6.
A schematic summary of the present study show that high levels of IFN-γ either in the presence of aATC alone under control condition or in the presence of aATC and Th1 cytokines can induce high levels of IFN-γ-driven chemokines CXCL9 and CXCL10 that may suppress MDSC development and differentiation. On the other hand, in the control condition, high levels of tumor-derived IL-1β and IL-6 may negate the effects of low levels of IFN-γ and IFN-γ-driven chemokines CXCL9 and CXCL10 and may support MDSC development
In summary, we show that either an artificially generated Th1 cytokine–enriched microenvironment or Th1 microenvironment generated during aATC-mediated killing of tumor cells, both conditions resulted in a significant reduction in MDSC development or elimination, respectively. Our study suggests that targeted immunotherapy with aATC directed at tumor targets will not only kill tumor cells but may also reduce MDSC populations as part of the targeting response. Further studies are needed to demonstrate the effect of aATC therapy on MDSC in pre-and post-aATC-treated breast cancer patients.
Acknowledgments
These studies were funded in part by R01 CA 092344 (L.G.L.), R01 CA 140412 (L.G.L), 5P39 CA 022453 from National Cancer Institute, Translational Grants #6066-06 and #6092-09 from the Leukemia and Lymphoma Society (L.G.L), Susan G. Komen Foundation Translational Grant #BCTR0707125 (L.G.L), and Michigan Cell Therapy Center for Excellence Grant from the State of Michigan #1819, and startup funds from the Barbara Ann Karmanos Cancer Institute.
Footnotes
Conflict of interest L.G.L. hold founder’s shares of Transtarget, Inc. The other authors have no financial conflict of interest.
Contributor Information
Archana Thakur, Email: thakur@karmanos.org, Department of Oncology, Wayne State University School of Medicine and Barbara Ann Karmanos Cancer Institute, 723 Hudson Webber Cancer Research Center, 4100 John R, Detroit, MI 48201, USA. Department of Oncology, Wayne State University and Karmanos Cancer Institute, Detroit, MI 48201, USA.
Dana Schalk, Department of Oncology, Wayne State University School of Medicine and Barbara Ann Karmanos Cancer Institute, 723 Hudson Webber Cancer Research Center, 4100 John R, Detroit, MI 48201, USA. Department of Oncology, Wayne State University and Karmanos Cancer Institute, Detroit, MI 48201, USA.
Sanila H. Sarkar, Department of Pathology, Wayne State University and Karmanos Cancer Institute, Detroit, MI 48201, USA
Zaid Al-Khadimi, Department of Oncology, Wayne State University School of Medicine and Barbara Ann Karmanos Cancer Institute, 723 Hudson Webber Cancer Research Center, 4100 John R, Detroit, MI 48201, USA. Department of Oncology, Wayne State University and Karmanos Cancer Institute, Detroit, MI 48201, USA.
Fazlul H. Sarkar, Department of Pathology, Wayne State University and Karmanos Cancer Institute, Detroit, MI 48201, USA
Lawrence G. Lum, Department of Oncology, Wayne State University School of Medicine and Barbara Ann Karmanos Cancer Institute, 723 Hudson Webber Cancer Research Center, 4100 John R, Detroit, MI 48201, USA. Department of Oncology, Wayne State University and Karmanos Cancer Institute, Detroit, MI 48201, USA. Department of Immunology and Microbiology, Wayne State University and Karmanos Cancer Institute, Detroit, MI 48201, USA
References
- 1.Bronte V, Zanovello P. Regulation of immune responses by L-arginine metabolism. Nat Rev Immunol. 2005;5(8):641–654. doi: 10.1038/nri1668. [DOI] [PubMed] [Google Scholar]
- 2.Nagaraj S, Gabrilovich DI. Tumor escape mechanism governed by myeloid-derived suppressor cells. Cancer Res. 2008;68(8):2561–2563. doi: 10.1158/0008-5472.CAN-07-6229. [DOI] [PubMed] [Google Scholar]
- 3.Gabrilovich DI, Nagaraj S. Myeloid-derived suppressor cells as regulators of the immune system. Nat Rev Immunol. 2009;9(3):162–174. doi: 10.1038/nri2506. [DOI] [PMC free article] [PubMed] [Google Scholar]
- 4.Marigo I, Dolcetti L, Serafini P, Zanovello P, Bronte V. Tumor-induced tolerance and immune suppression by myeloid derived suppressor cells. Immunol Rev. 2008;222:162–179. doi: 10.1111/j.1600-065X.2008.00602.x. [DOI] [PubMed] [Google Scholar]
- 5.Mantovani A, Schioppa T, Porta C, Allavena P, Sica A. Role of tumor-associated macrophages in tumor progression and invasion. Cancer Metast Rev. 2006;25(3):315–322. doi: 10.1007/s10555-006-9001-7. [DOI] [PubMed] [Google Scholar]
- 6.Mantovani A, Allavena P, Sica A, Balkwill F. Cancer-related inflammation. Nature. 2008;454(7203):436–444. doi: 10.1038/nature07205. [DOI] [PubMed] [Google Scholar]
- 7.Sakaguchi S, Sakaguchi N, Shimizu J, et al. Immunologic tolerance maintained by CD25(+) CD4(+) regulatory T cells: their common role in controlling autoimmunity, tumor immunity, and transplantation tolerance. Immunol Rev. 2001;182:18–32. doi: 10.1034/j.1600-065x.2001.1820102.x. [DOI] [PubMed] [Google Scholar]
- 8.Gallina G, Dolcetti L, Serafini P, et al. Tumors induce a subset of inflammatory monocytes with immunosuppressive activity on CD8(+) T cells. J Clin Invest. 2006;116(10):2777–2790. doi: 10.1172/JCI28828. [DOI] [PMC free article] [PubMed] [Google Scholar]
- 9.Serafini P, Borrello I, Bronte V. Myeloid suppressor cells in cancer: recruitment, phenotype, properties, and mechanisms of immune suppression. Semin Cancer Biol. 2006;16(1):53–65. doi: 10.1016/j.semcancer.2005.07.005. [DOI] [PubMed] [Google Scholar]
- 10.Ko JS, Bukowski RM, Fincke JH. Myeloid-derived suppressor cells: a novel therapeutic target. Curr Oncol Rep. 2009;11(2):87–93. doi: 10.1007/s11912-009-0014-6. [DOI] [PubMed] [Google Scholar]
- 11.Morse MA, Hall JR, Plate JMD. Countering tumor-induced immunosuppression during immunotherapy for pancreatic cancer. Expert Opin Biol Ther. 2009;9(3):331–339. doi: 10.1517/14712590802715756. [DOI] [PubMed] [Google Scholar]
- 12.Kusmartsev S, Gabrilovich DI. Immature myeloid cells and cancer-associated immune suppression. Cancer Immunol Immunother. 2002;51(6):293–298. doi: 10.1007/s00262-002-0280-8. [DOI] [PMC free article] [PubMed] [Google Scholar]
- 13.Kusmartsev S, Gabrilovich DI. Effect of tumor-derived cytokines and growth factors on differentiation and immune suppressive features of myeloid cells in cancer. Cancer Metast Rev. 2006;25(3):323–331. doi: 10.1007/s10555-006-9002-6. [DOI] [PMC free article] [PubMed] [Google Scholar]
- 14.Bronte V, Serafini P, Apolloni E, Zanovello P. Tumor-induced immune dysfunctions caused by myeloid suppressor cells. J Immunother. 2001;24(6):431–446. doi: 10.1097/00002371-200111000-00001. [DOI] [PubMed] [Google Scholar]
- 15.Bronte V, Chappell DB, Apolloni E, et al. Unopposed production of granulocyte-macrophage colony-stimulating factor by tumors inhibits CD8(+) T cell responses by dysregulating antigen-presenting cell maturation. J Immunol. 1999;162(10):5728–5737. [PMC free article] [PubMed] [Google Scholar]
- 16.Menetrier-Caux C, Montmain G, Dieu MC, et al. Inhibition of the differentiation of dendritic cells from CD34(+) progenitors by tumor cells: role of interleukin-6 and macrophage colony-stimulating factor. Blood. 1998;92(12):4778–4791. [PubMed] [Google Scholar]
- 17.Peranzoni E, Zilio S, Marigo I, et al. Myeloid-derived suppressor cell heterogeneity and subset definition. Curr Opin Immunol. 2010;22(2):238–244. doi: 10.1016/j.coi.2010.01.021. [DOI] [PubMed] [Google Scholar]
- 18.Nefedova Y, Huang M, Kusmartsev S, et al. Hyperactiva-tion of STAT3 is involved in abnormal differentiation of den-dritic cells in cancer. J Immunol. 2004;172(1):464–474. doi: 10.4049/jimmunol.172.1.464. [DOI] [PubMed] [Google Scholar]
- 19.Davol PA, Gall JM, Grabert RC, et al. Infusions of T cells armed with anti-CD3 × anti-her2/neu bispecific antibody modulate in vivo patient immune responses in phase I clinical trials for breast and hormone refractory prostate cancers. Blood. 2004;104(11):379a. (11-16-2004. Ref Type: Abstract) [Google Scholar]
- 20.Grabert RC, Cousens LP, Smith JA, et al. Human T cells armed with Her2/neu bispecific antibodies divide, are cytotoxic, and secrete cytokines with repeated stimulation. Clin Cancer Res. 2006;12(2):569–576. doi: 10.1158/1078-0432.CCR-05-2005. [DOI] [PubMed] [Google Scholar]
- 21.Sen M, Wankowski DM, Garlie NK, Siebenlist RE, Van Epps D, LeFever AV, et al. Use of anti-CD3 x anti-HER2/neu bi-specific antibody for redirecting cytotoxicity of activated T cells toward HER2/neu tumors. J Hematother Stem Cell Res. 2001;10:247–260. doi: 10.1089/15258160151134944. [DOI] [PubMed] [Google Scholar]
- 22.Lee GY, Kenny PA, Lee EH, Bissell MJ. Three-dimensional culture models of normal and malignant breast epithelial cells. Nat Methods. 2007;4(4):359–365. doi: 10.1038/nmeth1015. [DOI] [PMC free article] [PubMed] [Google Scholar]
- 23.Marigo I, Bosio E, Solito S, et al. Tumor-induced tolerance and immune suppression depend on the C/EBP beta transcription factor. Immunity. 2010;32(6):790–802. doi: 10.1016/j.immuni.2010.05.010. [DOI] [PubMed] [Google Scholar]
- 24.Elkabets M, Ribeiro VSG, Dinarello CA, et al. IL-1 beta regulates a novel myeloid-derived suppressor cell subset that impairs NK cell development and function. Eur J Immunol. 2010;40(12):3347–3357. doi: 10.1002/eji.201041037. [DOI] [PMC free article] [PubMed] [Google Scholar]
- 25.Tu S, Bhagat G, Cui G, et al. Overexpression of interleukin-1 beta induces gastric inflammation and cancer and mobilizes myeloid-derived suppressor cells in mice. Cancer Cell. 2008;14(5):408–419. doi: 10.1016/j.ccr.2008.10.011. [DOI] [PMC free article] [PubMed] [Google Scholar]
- 26.Loetscher M, Gerber B, Loetscher P, et al. Chemokine receptor specific for IP10 and Mig: structure, function, and expression in activated T-lymphocytes. J Exp Med. 1996;184(3):963–969. doi: 10.1084/jem.184.3.963. [DOI] [PMC free article] [PubMed] [Google Scholar]
- 27.Yoshie O, Imai T, Nomiyama H. Chemokines in immunity. Adv Immunol. 2001;78:57–110. doi: 10.1016/s0065-2776(01)78002-9. [DOI] [PubMed] [Google Scholar]
- 28.Vandercappellen J, Van Damme J, Struyf S. The role of CXC chemokines and their receptors in cancer. Cancer Lett. 2008;267(2):226–244. doi: 10.1016/j.canlet.2008.04.050. [DOI] [PubMed] [Google Scholar]
- 29.Conti I, Rollins BJ. CCL2 (monocyte chemoattractant protein-1) and cancer. Semin Cancer Biol. 2004;14(3):149–154. doi: 10.1016/j.semcancer.2003.10.009. [DOI] [PubMed] [Google Scholar]
- 30.Loberg RD, Ying C, Craig M, Yan L, Snyder LA, Pienta KJ. CCL2 as an important mediator of prostate cancer growth in vivo through the regulation of macrophage infiltration. Neo-plasia. 2007;9(7):556–562. doi: 10.1593/neo.07307. [DOI] [PMC free article] [PubMed] [Google Scholar]
- 31.Hasegawa H, Inoue A, Muraoka M, Yamanouchi J, Miyazaki T, Yasukawa M. Therapy for pneumonitis and sialadenitis by accumulation of CCR2-expressing CD4(+)CD25(+) regulatory T cells in MRL/lpr mice. Arthr Res Ther. 2007;9(1):1–12. doi: 10.1186/ar2122. [DOI] [PMC free article] [PubMed] [Google Scholar]
- 32.Huang B, Lei Z, Zhao J, et al. CCL2/CCR2 pathway mediates recruitment of myeloid suppressor cells to cancers. Cancer Lett. 2007;252(1):86–92. doi: 10.1016/j.canlet.2006.12.012. [DOI] [PubMed] [Google Scholar]
- 33.Dunn GP, Old LJ, Schreiber RD. The immunobiology of cancer immunosurveillance and immunoediting. Immunity. 2004;21(2):137–148. doi: 10.1016/j.immuni.2004.07.017. [DOI] [PubMed] [Google Scholar]
- 34.Mullins DW, Anderson SG, Mayer ME, et al. Chemokine receptor expression patterns on activated CD8(+) T lymphocytes correlate with survival in melanoma patients receiving peptide-based immunotherapy. FASEB J. 2004;18(4):A64–A65. [Google Scholar]
- 35.Mullins IM, Slingluff CL, Lee JK, et al. CXC chemokine receptor 3 expression by activated CD8(+) T cells is associated with survival in melanoma patients with stage III disease. Cancer Res. 2004;64(21):7697–7701. doi: 10.1158/0008-5472.CAN-04-2059. [DOI] [PubMed] [Google Scholar]
- 36.Harlin H, Meng Y, Peterson AC, et al. Chemokine expression in melanoma metastases associated with CD8(+) T-cell recruitment. Cancer Res. 2009;69(7):3077–3085. doi: 10.1158/0008-5472.CAN-08-2281. [DOI] [PMC free article] [PubMed] [Google Scholar]
- 37.Liu YQ, Poon RT, Hughes J, Feng XQ, Yu WC, Fan ST. Chemokine receptors support infiltration of lymphocyte subpop-ulations in human hepatocellular carcinoma. Clin Immunol. 2005;114(2):174–182. doi: 10.1016/j.clim.2004.10.006. [DOI] [PubMed] [Google Scholar]
- 38.Shin EC, Shin WC, Choi Y, Kim H, Park JH, Kim SJ. Effect of interferon-gamma on the susceptibility to Fas (CD95/ APO-1)-mediated cell death in human hepatoma cells. Cancer Immunol Immunother. 2001;50(1):23–30. doi: 10.1007/s002620000166. [DOI] [PMC free article] [PubMed] [Google Scholar]
- 39.Selleck WA, Canfield SE, Hassen WA, et al. IFN-gamma sensitization of prostate cancer cells to Fas-mediated death: a gene therapy approach. Mol Ther. 2003;7(2):185–192. doi: 10.1016/s1525-0016(02)00040-0. [DOI] [PubMed] [Google Scholar]
- 40.Sinha P, Chornoguz O, Clements VK, Artemenko KA, Zubarev RA, Ostrand-Rosenberg S. Myeloid-derived suppressor cells express the death receptor Fas and apoptose in response to T cell-expressed FasL. Blood. 2011;117(20):5381–5390. doi: 10.1182/blood-2010-11-321752. [DOI] [PMC free article] [PubMed] [Google Scholar]
- 41.Nonaka K, Saio M, Suwa T, et al. Skewing the Th cell phenotype toward Th1 alters the maturation of tumor-infiltrating mononuclear phagocytes. J Leukoc Biol. 2008;84(3):679–688. doi: 10.1189/jlb.1107729. [DOI] [PubMed] [Google Scholar]


