

Abstract
This parametric functional magnetic resonance imaging (fMRI) study investigates the balance of negative, and positive fMRI signals in the brain. A set of visual attention (VA) and of working memory (WM) tasks with graded levels of difficulty was used to deactivate separate, but overlapping networks that include the frontal, temporal, occipital, and limbic lobes; regions commonly associated with auditory and emotional processing. Brain activation (% signal change, and volume) was larger for VA tasks than for WM tasks, but deactivation was larger for WM tasks. BOLD responses cross-correlated strongly in the deactivated network during VA but less so during WM. The variability of the deactivated network across different cognitive tasks supports the hypothesis that global CBF vary across different tasks, but not between conditions of the same task. The task-dependent balance of activation and deactivation might allow maximization of resources for the activated network.
Introduction
fMRI studies of visual stimulation in cats (Harel, et al. 2002) and humans (Shmuel, et al. 2002) demonstrated negative blood oxygenation level dependent (BOLD) responses (NBR) in non-stimulated areas of the visual cortex. Similarly, fMRI studies using cross-modal stimuli showed deactivation of the auditory cortices during visual stimulation, while deactivation of the visual cortices occurred during auditory stimulation (Laurienti, et al. 2002; Lewis, et al. 2000). These findings suggest that the concomitant deactivation could represent cross-modal inhibition (an active suppression of neural activity), to minimize potentially distracting, task-irrelevant neural processes. Nevertheless, studies in rodents using optical imaging of hemoglobin oxygenation, and physiological recordings of spiking activity and local field potentials have shown that the negative hemodynamic activity might not correspond to changes in neuronal activity (Devor, et al. 2005).
fMRI deactivation may also represent a direct hemodynamic response (“blood stealing”) in the vascular system in response to changes in adjacent regional cerebral blood flow (rCBF), since negative BOLD signals are accompanied by decreases in rCBF (Hoge, et al. 1999b; Raichle 1998; Shmuel, et al. 2002; Stefanovic, et al. 2004). In this model, rCBF-increases (Δ+)in activated regions would necessitate synchronous rCBF-decreases (Δ− in other brain regions (Δ+ = kΔ−, where the constant k depends on the vascular distribution). This hypothesis is supported by the finding that global brain metabolism, which is proportional to global CBF, is remarkably constant despite varying mental and motor activity (Raichle and Gusnard 2002). The BOLD signal depends in a complex manner on CBF, cerebral blood volume (CBV), and cerebral metabolic rate of oxygen consumption (CMRO2) (Buxton 2002). Hoge et al, however, have suggested that during visual stimulation (flickering checkerboard), Δ± and the BOLD± signals in the human occipital cortex are coupled (Hoge, et al. 1999a); Δ± is proportional to CMRO2 increases, and the BOLD± signal ∝ Δ±0.9
Positron emission tomography (PET) also showed rCBF-decreases in visual (Kawashima, et al. 1995) and auditory (Shulman, et al. 1997) cortices during spatial-, visual- or selective-attention tasks, and in auditory and somatosensory cortices during tasks that did not require attention. (Born, et al. 2002; Haxby, et al. 1994; Shulman, et al. 1997)
Brain deactivation also has been reported during attention requiring tasks (Deary, et al. 2004; Hester, et al. 2004; Lawrence, et al. 2003); however, whether it reflects neural inhibition of task-irrelevant neural processing or hemodynamic compensatory mechanisms in the brain is still unclear. Deficits in attention and memory are common in many brain disorders, including Alzheimer’s disease, attention deficit hyperactivity disorder, schizophrenia, Parkinson’s disease, HIV-infection, and drug addiction. Therefore, a better understanding of the mechanism for deactivation may be important if fMRI is used to evaluate brain pathophysiology or to monitor treatments.
In a recent fMRI study on the effect of scanner noise on visual attention and working memory processing in healthy subjects and HIV patients(Tomasi, et al. 2005a; Tomasi, et al. 2005b; Tomasi, et al. 2005c), we observed similar patterns of brain deactivation for both tasks; therefore the goal of this study was to investigate if the activation-deactivation balance during attention demanding tasks [working memory (WM), and visual attention (VA) tasks with graded levels of difficulty (Chang, et al. 2001; Chang, et al. 2004)] is task-dependent.
We hypothesized that if global CBF is constant across tasks, larger fMRI activation (% signal change, and activated volume) should be counterbalanced by larger fMRI deactivation. This hypothesis assumes the same (constant) global CBF during the tasks (Δ+ = kΔ−), and that fMRI signals and hemodynamic responses are coupled (BOLD ± ∝ Δ∝± where ∝ is a constant); if so, BOLD-activation should be accompanied by synchronous proportional BOLD-deactivation (BOLD+ = q BOLD− where q is a constant). Therefore two different tasks (WM and VA), with parametric changes of cognitive load were used to modulate brain activation and deactivation to allow a comparative analysis of activation and deactivation. The study was conducted at high magnetic field strength (4 Tesla) in a cohort of twenty-two healthy volunteers.
Materials and Methods
Subjects
Twenty-two healthy, non-smoking, right-handed volunteers (10 men and 12 women, age 30±8 years, education: 16±2 years) with normal vision participated in the study. The subjects signed a written consent, approved by the Institutional Review Board at Brookhaven National Laboratory, and were screened carefully with a detailed medical history, physical and neurological examination, blood and urine screening tests, to ensure they fulfilled all the inclusion (age 18 years or older; English as their first language; healthy and on no medications), and exclusion criteria (history of head injury; current or past drug abuse or dependence including positive urine toxicology; any past or current medical or neuropsychiatric illnesses; significant abnormalities on screening blood tests; pregnancy tested by urine test or breast-feeding if female subjects; any contraindications for MRI).
Neuropsychological Tests
All subjects were evaluated with a battery of neuropsychological tests to evaluate attention [Symbol Digit Modalities(Smith 1982)], working memory [forward and backward digit span, and letter-number sequencing, Wechsler Adult Intelligence Scale-Third Edition, WAIS-III], and executive function [Stroop Color Interference Test (Stroop 1935)].
Visual attention paradigm
Subjects performed a set of three visual-attention tasks that involved mental tracking of two, three, or four out of 10 moving balls (Culham, et al. 1998; Jovicich, et al. 2001; Tomasi, et al. 2004). During the “TRACK” periods, the target balls (2, 3 or 4) were briefly highlighted, and then all 10 balls started to move. Subjects were instructed to fixate on the cross while mentally tracking the target balls as they moved randomly across the display. At the end of “TRACK” periods, the balls stopped moving and a new set of balls was highlighted, and subjects were trained to press a button if these balls are the same as the target set. Hence, reaction times and accuracy in performance were recorded. After 0.5 seconds delay, the original target balls were then re-highlighted to re-focus the subjects’ attention on these balls, and the sequence was repeated 5 times. During “DO NOT TRACK” periods, all 10 balls moved in the same manner; however, no balls were highlighted. The subjects were instructed to stop tracking the balls and view them passively. These tasks activate a neural network that includes primarily the dorsolateral prefrontal cortex (DLPFC), inferior and superior parietal lobes (IPL and SPL, respectively), cerebellum, and motion areas V5/MT+ (Culham, et al. 1998; Jovicich, et al. 2001). The stimuli were created as movies in AVI (“Audio Video Interleave”) format using Matlab, and presented to the subjects on MRI-compatible LCD goggles connected to a personal computer. The display software was synchronized precisely with the MR acquisition using an MRI trigger pulse.
Working memory paradigm
Three sequential letter tasks were used to test working memory. The 0-back task was a simple reaction task: During the 30 seconds long task block, a letter was flashed for 500 milliseconds at random times (10 events). The task was to push a response button as soon as a letter appeared on the screen. During the control periods of 30 seconds, only a fixation cross was displayed. For the 1-, and 2-back tasks, random alphabetical letters were presented sequentially at a rate of 1 per second. The subjects were instructed to push a button as quickly as possible when the current letter was the same as the one before (one-back task) or two before (two-back task). During each task period of 30 seconds, five targets were presented at random time points. During the resting period (30 seconds), nonsense characters were randomly displayed at the same size, rate, and luminance, and the subjects were instructed not to respond but to maintain fixation at the center cross.
Task order was counterbalanced to minimize habituation effects. Half the studies started with WM tasks; the remaining studies started with VA tasks. The stimuli were presented to the subjects on MRI-compatible LCD goggles connected to a personal computer. All response button events during stimulation were recorded to determine task performance.
The subjects were briefly trained outside the scanner (for approximately 10 minutes), using shortened versions of the paradigms, to ensure that they understood and were able to perform the tasks.
Data acquisition
Subjects underwent MRI in a 4 Tesla whole-body Varian/Siemens MRI scanner, equipped with a self-shielded whole-body SONATA gradient set. A T2*-weighted single-shot gradient-echo EPI sequence with ramp-sampling (TE/TR=25/3000 ms, 4 mm slice thickness, 1 mm gap, typically 33 coronal slices covering the whole brain, 48×64 matrix size, 4.1 × 3.1 mm in-plane resolution, 90°-flip angle, time points: 84 for WM, 124 for VA) was used to measure the blood oxygenation level dependent (BOLD) responses. The entire battery was performed twice to increase statistical power. Padding was used to minimize motion. Task performance and subject motion were determined immediately after each fMRI trial, to assure performance accuracy better than 80%, and motion < 1 mm-translations and < 1° rotations (Caparelli, et al. 2003).
A T1-weighted 3D-MDEFT sequence (Lee, et al. 1995) (TE/TR = 7/15ms, 0.94 × 0.94 × 3 mm spatial resolution, axial orientation, 256 readout and 192×48 phase-encoding steps, 8 minutes scan time) and a modified T2-weigthed Hyperecho sequence (Hennig and Scheffler 2001) (TE/TR = 42/10000 ms, echo train length = 16, 256×256 matrix size, 30 coronal slices, 0.86 × 0.86 mm in-plane resolution, 5 mm thickness, 1 mm gap, 2 min scan time) were used to obtain anatomical images.
Data processing
The first four volumes in the time series were discarded to avoid non-equilibrium effects of the MR signal. The statistical parametric mapping package SPM99 (Welcome Department of Cognitive Neurology, London UK) was used for fMRI analyses. A six-parameter rigid body transformation was used for image realignment, to correct for head motion. Only scans with head motion less than 1-mm translations and 1°-rotations were included in the analysis. The realigned datasets were normalized to a Talairach template using a 3×3×3 mm3 voxel size, and an affine transformation (Ashburner, et al. 1997). The data were smoothed using an 8-mm FWHM Gaussian kernel. A general linear model (Friston, et al. 1995), and a box-car design convolved with a canonical hemodynamic response function (HRF) were used to calculate the activation maps. Since global normalization in SPM can produce false deactivation signals (Aguirre, et al. 1998; Gavrilescu, et al. 2002), the BOLD signal strength was estimated without the removal of global effects. The time series were band-pass filtered with the HRF as low pass filter, and an additional high-pass filter (cut-off frequency: 1/126Hz for WM, 1/256 for VA).
Statistical analyses
BOLD-responses (% signal change maps) for each trial and subject were included in a voxel-by-voxel repeated measures ANOVA model with six conditions (WM: 0-, 1-, and 2-back; VA: 2-, 3-, and 4-balls) to identify significantly activated and deactivated brain areas during WM and VA tasks. Masks of networks that activated or deactivated during WM or VA tasks were created using the repeated measures ANOVA model and a threshold p = 0.05. Simple regression analyses of BOLD signals and behavioral measurements during fMRI (reaction times, performance accuracy and task difficulty, as measured by the reaction times-to-performance accuracy ratio) were conducted across subjects and tasks to complement the statistical analyses of brain activation. Activation maps for group analyses were calculated using a voxel-level threshold (uncorrected) of p < 0.05 and a minimum cluster size of 15 voxels (400 mm3). Clusters with at least 15 voxels (400 mm3) and p < 0.05, corrected for multiple comparisons, were considered significant in the group analysis.
Region-of-interest (ROI) analysis
To validate the SPM results, functional ROIs with volume of 729 mm3 (cubic, 27 voxels) were defined at the cluster centers of brain activation (see Tables 1 and 2) to extract the average BOLD signal from these regions, using a customized program written in IDL (Research Systems, Boulder, CO). The position, shape, and size of the ROIs were invariant across subjects, tasks, and conditions. A repeated measures ANOVA was conducted for each ROI to validate the voxel-by-voxel statistical analyses described above. Additional cross-correlation analyses between load effects (differential BOLD responses; WM-load: “2-back” – “0-back”; VA-load: “4-balls” – “2-balls”) in different ROIs were performed across subjects to study a) potential interconnections in the networks, and b) if larger dynamic range of hemodynamic responses in the activated network is balanced out by larger dynamic range of hemodynamic responses in the deactivated network. Statistical significance for ROI analyses was defined as p = 0.05 (uncorrected).
Table 1.
Location of major areas of brain activation in the Talairach frame of reference, and statistical significance of BOLD responses in these voxel locations. Sample size: Twenty-two healthy subjects. Repeated measures ANOVA (random-effects) analyses; IFG: inferior frontal gyrus; MFG: middle frontal gyrus; medFG: medial frontal gyrus; FusG: fusiform gyrus; IPL: inferior parietal lobe; SPL: superior parietal lobe; PostCG: postcentral gyrus; PCL: paracentral lobule; SOG: superior occipital gyrus; IOG: inferior occipital gyrus; CER: cerebellum; BA: Brodmann area. Bonferroni corrections: (*) Cluster-level corrected p < 0.001, (∇) Cluster-level corrected p < 0.05.
| Brain Region | Side | Coordinates [mm] | T-scores | |||||||
|---|---|---|---|---|---|---|---|---|---|---|
| x | y | z | VA | WM | VA Load | WM Load | VA>WM | WM>VA | ||
| IFG (BA47) | L | −36 | 15 | −3 | 5.7* | 8.0* | 2.4* | 3.2∇ | NS | NS |
| R | 27 | 18 | 0 | 6.1* | 5.4* | NS | 2.1∇ | NS | NS | |
| MFG (BA6) | L | −24 | 6 | 60 | 8.8* | NS | NS | NS | 2.3* | NS |
| R | 33 | −12 | 57 | 4.0* | NS | NS | NS | 3.1* | NS | |
| MFG (BA9) | L | −36 | 21 | 15 | 2.9* | 7.7* | 2.7* | 2.8∇ | NS | 2.7∇ |
| R | 39 | 15 | 18 | 7.9* | 8.3* | NS | 2.3∇ | NS | NS | |
| medFG (BA8) | C | 3 | 21 | 39 | 5.1* | 7.0* | NS | 2.2∇ | NS | NS |
| FusG (BA19) | L | −39 | −63 | −6 | 8.7* | 10.0* | 4.9* | NS | NS | NS |
| R | 39 | −66 | −15 | 10.1* | 4.5* | 3.4* | NS | 2.0 | NS | |
| IPL (BA40) | L | −36 | −36 | 45 | 10.1* | 7.7* | 4.2* | 2.3∇ | 2.7* | NS |
| R | 39 | −36 | 45 | 9.1* | 4.8* | 5.3* | NS | 3.9* | NS | |
| SPL (BA7) | L | −30 | −51 | 45 | 10.0* | 13.1* | 3.8 | 4.6 | NS | NS |
| R | 30 | −54 | 51 | 12.0* | 12.2* | 2.3 | 2.8 | 3.7* | NS | |
| L | −21 | −57 | 66 | 19.4* | 5.7* | 3.6 | NS | 10.9* | NS | |
| R | 15 | −66 | 60 | 13.6* | 2.8* | NS | 2.3 | 8.4* | NS | |
| PostCG (BA7) | L | −3 | −51 | 69 | 8.8* | NS | NS | NS | 7.7* | NS |
| R | 3 | −51 | 69 | 10.4* | NS | NS | NS | 9.8* | NS | |
| PCL | C | 0 | −42 | 63 | 4.6* | NS | −2.5* | NS | 6.4* | NS |
| SOG (BA19) | L | −27 | −81 | 27 | 4.7* | NS | 5.5* | NS | NS | NS |
| R | 33 | −81 | 21 | 13.2* | NS | 5.9* | NS | 6.2* | NS | |
| IOG (BA19) | L | −36 | −66 | −6 | 6.4* | 7.1* | 5.4* | NS | NS | NS |
| R | 36 | −66 | −6 | 7.4* | 5.2* | 2.0 | NS | 2.2* | NS | |
| Thalamus | L | −9 | −18 | 9 | 8.3* | 8.2* | 3.4* | NS | NS | NS |
| R | 3 | −21 | 9 | 10.1* | 8.2* | 2.0 | NS | 2.3* | NS | |
| CER-Declive | L | −33 | −66 | −21 | 4.7* | 5.5* | 5.1* | NS | NS | NS |
| R | 33 | −66 | −21 | 8.1* | 12.0* | 4.2* | NS | NS | NS | |
| CER-Vermis | C | −3 | −78 | −15 | 10.9* | 11.0* | 4.5* | NS | NS | NS |
Table 2.
Location of major areas of brain deactivation in the Talairach frame of reference, and statistical significance of BOLD responses in these voxel locations. Sample size: Twenty-two healthy subjects. Repeated measures ANOVA (random-effects) analyses; SFG: superior frontal gyrus; ACG: anterior cinculate gyrus; PHG: parahippocampal gyrus; PreCG: precentral gyrus; MTL: middle temporal gyrus; CG: cingulated gyrus; PCL: paracentral lobule; PCG: postcentral gyrus; BA: Brodmann area. Bonferroni corrections: (*) Cluster-level corrected p < 0.001, (∇) Cluster-level corrected p < 0.05.
| Brain Region | Side | Coordinates [mm] | T-scores | |||||||
|---|---|---|---|---|---|---|---|---|---|---|
| x | y | z | VA | WM | VA Load | WM Load | VA>WM | WM>VA | ||
| SFG (BA 9) | L | −12 | 54 | 36 | −2.0 | −2.8 | NS | NS | NS | NS |
| R | 12 | 57 | 33 | NS | −2.8 | NS | NS | NS | NS | |
| ACG (BA 24) | C | −6 | 36 | 0 | −4.9 | −4.5 | NS | 3.6 | NS | NS |
| Insula (BA 13) | L | −36 | −18 | 12 | −4.3 | −5.5 | NS | −2.1 | NS | NS |
| R | 42 | −9 | 3 | −2.8 | −4.0 | NS | NS | NS | NS | |
| PHG (BA 35) | L | −21 | −24 | −18 | NS | −2.7 | 3.1 | NS | NS | NS |
| R | 24 | −21 | −18 | NS | −3.2 | NS | NS | NS | −2.0 | |
| (BA 36) | L | −24 | −42 | −9 | NS | −2.6 | 3.0 | NS | NS | NS |
| (BA 30) | L | −9 | −48 | 0 | NS | −2.9 | 4.0 | NS | NS | NS |
| R | 9 | −48 | 0 | NS | −3.7 | 2.7 | NS | NS | NS | |
| PreCG (BA 4) | L | −24 | −21 | 57 | NS | −2.1 | NS | NS | NS | −2.3 |
| R | 24 | −21 | 57 | NS | NS | NS | NS | NS | −2.0 | |
| MTG (BA 39) | L | −45 | −63 | 27 | NS | −2.3 | 3.8 | NS | NS | NS |
| R | 45 | −63 | 27 | NS | −4.8 | 2.0 | NS | NS | −2.0 | |
| CG (BA 31) | C | 0 | −48 | 27 | −7.2 | −10.9 | NS | −2.7 | NS | NS |
| (BA 24) | C | 3 | −6 | 42 | NS | −4.8 | NS | NS | NS | −2.4 |
| PCL (BA 5) | C | 0 | −42 | 63 | NS | −4.5 | NS | 2.5 | NS | −6.4 |
| PCG (BA 30) | L | −9 | −48 | 6 | NS | −3.1 | 3.9 | NS | NS | NS |
| R | 12 | −54 | 6 | −2.5 | −5.4 | 2.0 | NS | NS | NS | |
| Precuneus (BA 7) | L | −15 | −63 | 27 | NS | −3.0 | 4.9 | NS | NS | NS |
| R | 15 | −63 | 27 | 2.4 | −5.0 | 4.0 | NS | NS | NS | |
Results
Performance and reaction times
Figure 1 shows the average values of task performance and reaction time (RT) during fMRI. Subjects were able to perform the tasks with high performance accuracy (> 90%). Performance accuracy was significantly lower for 2-back compared to 0- and 1-back (p-value < 0.0001), but not for 1-back versus 0-back (p-value = 0.08). RT increased from 0-back to 1-back, and from 1-back to 2-back (p < 0.0001). Performance accuracy during 4-ball tracking was significantly lower compared to 3 and 2-ball tracking (p-value < 0.0001), but not between for tracking 2-balls versus 3-balls (p-value = 0.5). Although RT increased with increasing number of balls tracked, the increases were not statistically significant. Performance accuracy for WM and VA were similar; however, RT was slower during VA tasks compared to WM tasks (Fig 1). These task-dependent increases in RT and decreases in performance suggest increasing difficulty of the WM and VA tasks (WM-load, and VA-load, respectively). Task difficulty during fMRI was defined reaction time as the reaction time-to-performance accuracy ratio ( ); this performance accuracy behavioral measure during fMRI correlated across subjects with independent measures of subject’s abilities (digit-symbol (Smith 1982) R = −0.67, WAIS tests R < −0.42, Stroop tests R > 0.56) during neuropsychological testing outside the scanner. These correlations support the use of this parameter as a measure of task difficulty; subjects that performed worse on neurocognitive tasks might have perceived the tasks as more difficult than subjects that performed better on neurocognitive tasks.
Fig 1.
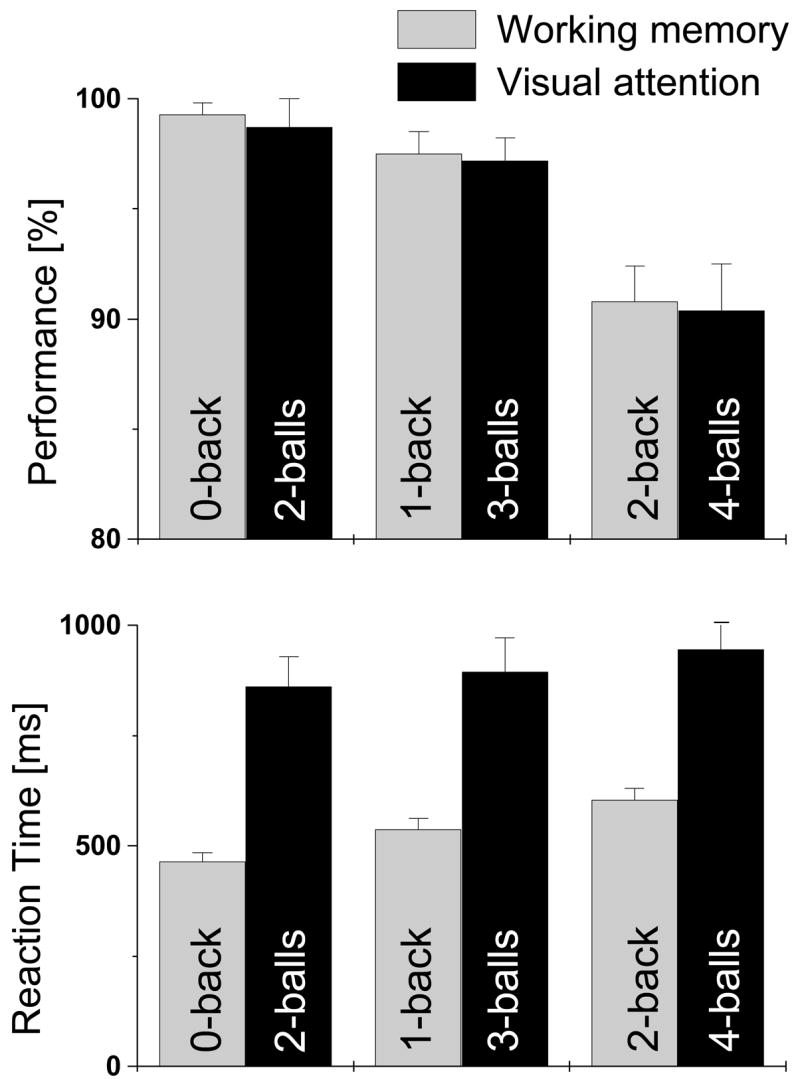
Performance accuracy and reaction times for working memory and visual attention tasks.
Activation
The WM tasks activated a network (Table 1) that includes the prefrontal (PFC) cortex [inferior (IFG; BA: 47), medial (medFG; BA: 8), middle (MFG; BA: 9) frontal gyri], inferior (IPL; BA: 40), and superior (SPL; BA: 7) parietal lobes, the inferior occipital (IOG; BA: 19), and fusiform (FusG; BA: 19) gyri, as well as the thalami and the cerebellum [declive, and vermis], in agreement with our prior observations (Chang, et al. 2001). VA tasks activated a network that involves the same brain regions and additionally the MFG (BA: 6), PostCG (BA: 7), and SOG (BA: 19), also in agreement with our previous studies (Chang, et al. 2004; Jovicich, et al. 2001). Brain activation was highly significant in all these regions for both WM and VA tasks.
Figure 2 shows the activation patterns (top panel; red) and the extent of common activation (bilateral) produced by both paradigms. Brain activation in the MFG (BA 9) was larger overall for WM tasks compared to VA tasks (Fig 2, middle panel; cyan), while brain activation in the SPL, IPL, MFG (BA 6), PostCG, IOG, SOG, and the thalamus was greater during VA than WM tasks (Fig 2, middle panel; yellow). The volume of the activated network was larger for VA tasks than for WM tasks (430±10 cm3, and 310±10 cm3, respectively).
Fig 2.
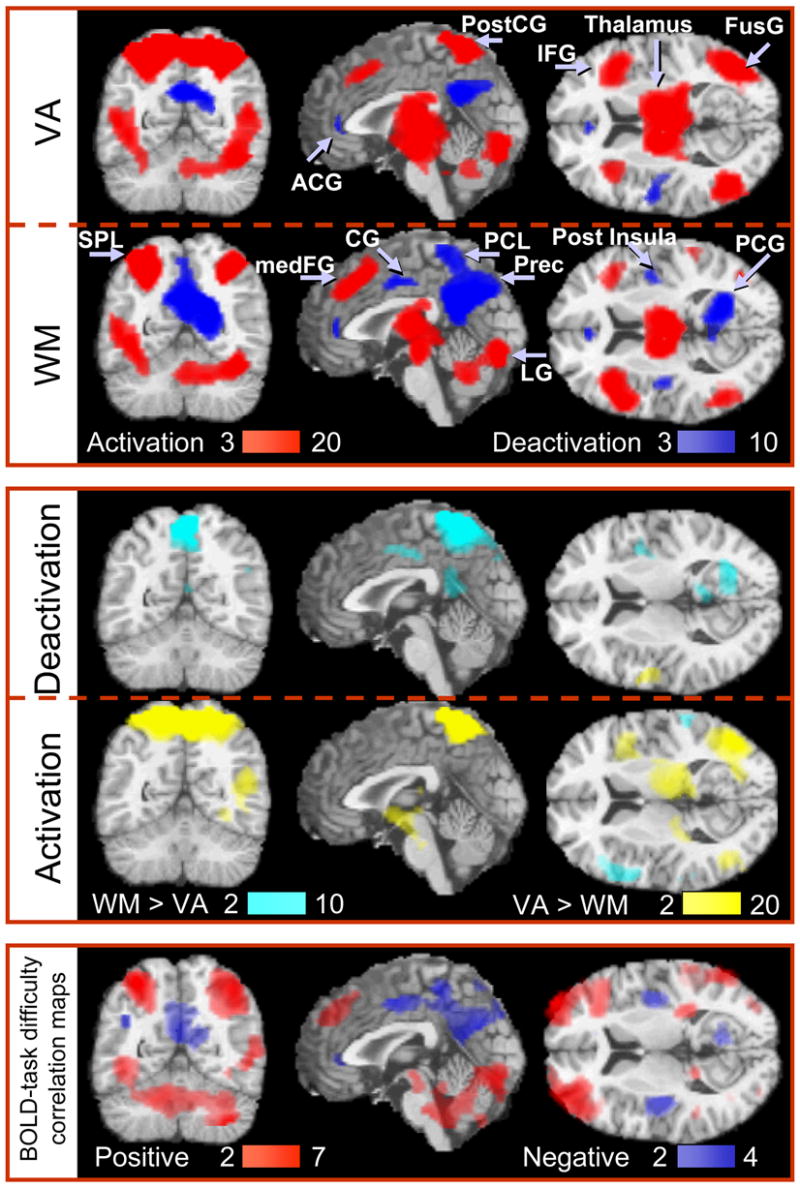
Statistical maps of [Top] positive (red) and negative (blue) BOLD signals during working memory (WM) and visual attention (VA) tasks, [Middle] differential BOLD signals between tasks, and [Bottom] positive and negative correlation with task difficulty (The color bars indicate the significance of the voxel-wise fit of the linear regression with parametric variation of the task difficulty). Sample size: Twenty-two healthy subjects, random-effects analyses (repeated ANOVA). Color bars show the T-score windows. IFG: inferior frontal gyrus; medFG: medial frontal gyrus; FusG: fusiform gyrus; SPL: superior parietal lobe; PostCG: postcentral gyrus; PCL: paracentral lobule; Prec: precuneus; ACG: anterior cingulate gyrus; CG: cingulate gyrus; PCG: posterior cingulate gyrus; LG: lingual gyrus;
For WM tasks, increased RT and task difficulty, and decreased performance accuracy, were associated with increased activation of the activated network. For VA tasks, however, increased task difficulty was coupled to increased activation in the cerebellum, IPL, SOG, and IOG (pcorrected < 0.001; Fig 2, bottom panel, red).
Deactivation
Figure 2 also shows the pattern of deactivation for WM and VA tasks (top panel, blue). WM tasks (0-, 1-, and 2-back combined) deactivated a bilateral network (Table 2) that comprises the frontal [superior frontal (SFG; BA: 9), precentral (PreCG; BA: 4), and anterior cingulate gyri (ACG; BA: 24), paracentral lobule (PCL; BA: 5), and the posterior insula], temporal [middle temporal gyrus (MTG; BA: 39)], limbic [cingulate (CG; BAs: 24, and 31), parahippocampal (PHG; BAs: 30, 35, and 36), posterior cingulate (PCG; BA: 30) gyri], and occipital [precuneus (BA: 7)] lobes. VA tasks (2-, 3-, and 4-balls combined) deactivated the insula, ACG, CG, PCG, and the precuneus (Table 2).
The amplitude of the negative BOLD responses was larger during WM than during VA in the right PHG (BA: 30), CG (BAs: 24, and 31), and the PCG (Fig 2, middle panel; cyan). Furthermore, the PCL deactivated during WM tasks, but activated during VA tasks (Fig 2, middle panel). The volume of the deactivated network was larger for WM tasks than for VA tasks (100±5 cm3, and 40±4 cm3, respectively).
Furthermore, increased RT and task difficulty, and reduced performance accuracy during WM tasks were associated with increased deactivation of the deactivation network (pcorrected < 0.008; Fig 2, bottom panel, blue). Specifically, BOLD signals correlated stronger with task difficulty than with either RT or performance accuracy. For VA tasks, increased task difficulty produced larger deactivation in the CG (BA: 31; pcorrected = 0.008). This demonstrates that the RT-to-performance accuracy ratio predicts both, activation and deactivation for WM tasks, but not for VA tasks.
ROI results
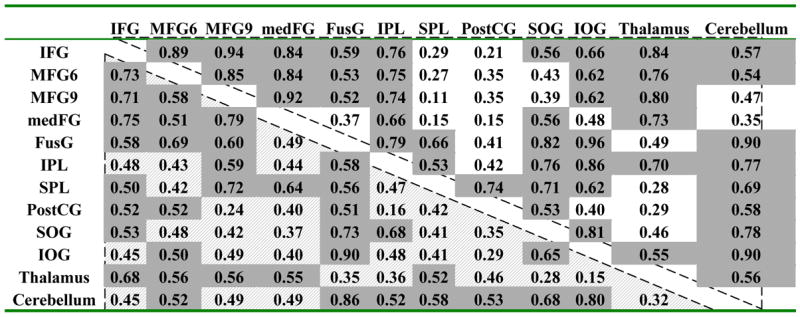
VA tasks produced larger positive BOLD responses than WM tasks in an occipito-parietal network comprising the FusG, PostCG, SOG, IPL, and SPL (p < 0.001; gray box in Fig. 3), but no differences were observed in the PFC (IFG and MFG) and the subcortical brain regions (thalamus and cerebellum). In the PostCG, the average BOLD responses were positive during VA tasks but negative during WM tasks (see Fig 3), and the responses did not modulate with either WM-load or VA-load. In the PFC (IFG, and MFG, medFG), BOLD responses modulated with WM-load (p < 0.004) but did not modulate significantly with VA-load. BOLD signals in other brain regions that activated during the tasks, however, modulated with WM-load and VA-load (p < 0.001). The BOLD signal amplitudes in the medFG and those in other regions of the PFC were strongly correlated across subjects for VA tasks (0.60 < R < 0.67; Table 3), but less so for WM tasks (0.26 < R < 0.56). In general, VA-load and WM-load effects exhibited remarkably similar cross-correlation coefficients in activated regions (Table 3). In these regions, the average BOLD responses in the ROIs followed a normal distribution (Gaussian) across subjects and trials; the mean of the distribution was different but its full-width-half-maximum (FWHM) was similar across all ROIs (FWHM = 3.1±0.4, and 3.0±0.4 %, for VA, and WM tasks, respectively) for VA and WM tasks.
Fig 3.

Average BOLD signals at specific ROIs in the activated network (see Table 1).
Table 3.
Cross correlation factors of load responses in the activated networks during WM (shaded up triangle) and VA (open down triangle) tasks. Gray: R > 0.6.
|
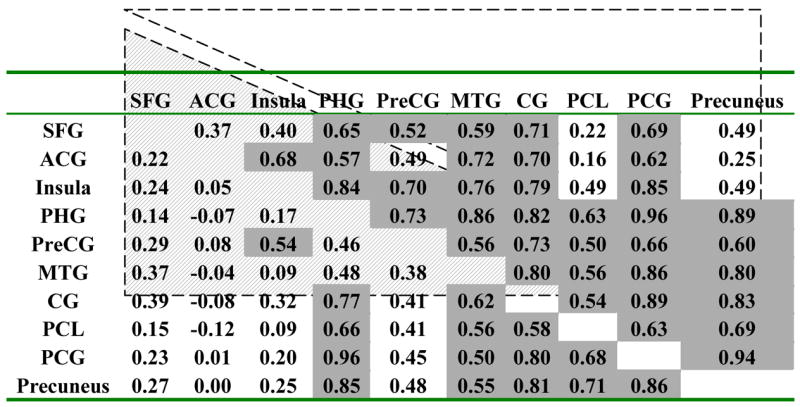
WM tasks produced larger average negative BOLD responses (across trials and subjects) than VA tasks in the PHG, MTG, PreCG, PCL, and PCG (p < 0.05; paired t-test; Fig. 4). Conversely, VA tasks did not produce larger deactivation than WM tasks in any brain region. The PreCG, PCL, and the precuneus deactivated during WM tasks (p < 0.0001), but activated during VA tasks (p < 0.0006). Increased WM-load produced increased deactivation in the SFG, ACG, Insula, CG, PreCG, PCG, and precuneus [p < 0.05; t-tests for differential (2-back – 0-back) BOLD amplitudes; Fig. 4]. For VA tasks, however, increased VA-load produced decreased deactivation in the PCG, MTG, and the precuneus (p < 0.05). Cross-correlations of load responses (% signal change) in the deactivated network were larger for VA tasks compared to WM tasks (Table 4). Figures 5A and 5B exemplify the linear correlations (across subjects) between BOLD amplitudes in the PCG and the precuneus, for VA and WM tasks. Figures 5C and 5D plot the distribution of BOLD signal amplitudes across subjects and tasks, demonstrating that WM and VA-tasks produce different Gaussian distributions of BOLD signals. The negative average of the distribution is larger during WM tasks, but its FWHM is larger during VA tasks (FWHM = 1.55±0.1, and 0.95±0.1 %, for VA, and WM tasks, respectively). The position (see Tables 1, and 2), shape and size of the ROIs were invariant across subjects, tasks, and conditions.
Fig 4.

Average BOLD signals at specific ROIs in the deactivated network (see Table 2).
Table 4.
Cross correlation factors of load responses in the deactivated network for WM (shaded up triangle) and VA (open down triangle) tasks. Gray: R > 0.6.
|
Fig 5.

Correlation of BOLD responses in ROIs that deactivated for VA (A) and WM (B) tasks, and BOLD signal distribution in the PCL (C) and the precuneus (D) for WM and VA tasks. Average BOLD amplitudes in bilateral cubic ROIs (27 3×3×3 mm3 voxels) for all subjects and conditions [22 subjects × 2 repetitions × 2 sides (left and right) × 3 tasks (0-, 1-, and 2-back) = 264 measurements (full, and open circles)].
Discussion
This study provides the first intra-subject comparison of fMRI-deactivation during two different cognitive tasks. The main findings are: a) VA and WM tasks commonly deactivate a network that includes the frontal, temporal, occipital, and limbic lobes; b) although WM tasks caused lower overall activation, they produced larger overall deactivation than VA tasks; and c) specific regions in the frontal lobes (PreCG, and PCL) deactivated during WM, but activated during VA tasks.
These findings suggest that global CBF is not constant across the tasks for two reasons: First, VA tasks produced greater activation but lesser amplitude of deactivation than WM tasks (Figs 2, 3, and 4); therefore the BOLD−in the deactivated network is not proportional to BOLD+ the in the activated network, thus Δ+ ≠ kΔ− across tasks; and Second, while cross-correlation of load responses in the activated network were similar during VA and WM tasks (Table 3), in the deactivated network the load responses cross-correlated better for VA tasks than for WM tasks (Table 4; Figs 5A and 5B). The correlation-differences between tasks result from the lower dynamic range of negative BOLD signals during WM tasks, compared to VA tasks. Similarly, in deactivated brain regions, the Gaussian distribution of BOLD responses has different FWHM (Figs 5C and 5D) for WM and VA tasks; in activated regions, however, the FWHM is the same for both tasks. This is also inconsistent with proportional blood flow changes in the activated and the deactivated networks across tasks.
Differently, the parametric increases of VA-load enhanced the positive BOLD signals in the IPL, SOG, IOG, thalamus, cerebellum, and the left DLPFC (IFG, and MFG), and the negative BOLD signals in the PCG, PHG, and the precuneus (see Tables 1, and 2, and Figs 3, and 4). Similarly, parametric increases of WM-load enhanced brain activation bilaterally in the PFC, and left IPL, and brain deactivation in the CG, and the insula (see Tables 1, and 2, and Figs 3 and 4). These corresponding increases of activation and deactivation support that global CBF is constant across conditions of the same task. Our results are supported by one previous fMRI study that used an auditory target detection task with parametric changes of task difficulty(McKiernan, et al. 2003), and that found increasing task difficulty results in greater degrees of brain deactivation in the ACG, SFG, MFG, PCG, SPL, and precuneus. This study suggested that the ongoing internal information processing during the conscious resting state is suspended during the task to allow for reallocation of processing resources. Therefore, the present study suggests that the hemodynamic responses in activated and deactivated networks are proportional across load conditions, but not across different tasks (WM, and VA).
There are two potential mechanisms underlying deactivation on BOLD fMRI: Model 1: local reduction of rCBF in less active brain regions to compensate for rCBF increases in activated brain regions, without central involvement (“blood stealing”), and Model 2: stimulus-correlated, centrally mediated inhibition of neural processes in task-irrelevant brain regions.
Model 1 relates primarily to shunting of blood flow to activated brain regions. Since increased neural activity in the activated network would require increased rCBF and oxygen consumption (CMRO2), and since the total metabolism of the brain is approximately constant over a wide range of mental and motor activities (Raichle and Gusnard 2002), increased rCBF in the activated network might require a synchronous decrease of rCBF in adjacent regions of the brain (i.e. a hemodynamic response). Consequently, these adjacent task-irrelevant regions might present negative, rather than positive, BOLD responses. In this purely hemodynamic model, regions with fMRI deactivation would reflect a transition from decreased rCBF-supply during “task” periods to normal rCBF-supply during “resting” periods. Despite greater global activation during VA tasks in this study, the PCL, PreCG, and precuneus deactivated during WM but activated during VA. This is inconsistent with the Model 1 since the cerebrovasculature is constant in anatomy and location within each subject; therefore, these areas also should deactivate during VA since all brain areas activated by WM tasks also activated during VA tasks, within the same cerebrovasculature in each subject.
Model 2 explains deactivation as a consequence of cross-modal inhibition mechanisms that reduce potentially distracting neural processes (Laurienti, et al. 2002). With respect to the present study, the Model 2 advocates that deactivation in the posterior insula, PCL, ACG, MTG, CG, PHG, PCG, and precuneus during WM but less so during VA is a result of direct neural inhibition. This inhibition may serve the purpose of optimizing performance by minimizing interference. Deactivation of these brain areas during rapid visual information processing (Lawrence, et al. 2003) and auditory target detection tasks (McKiernan, et al. 2003) were associated with the need for focused attention towards more difficult tasks. For instance, competing neural processes such as those produced by the stimulation of the auditory cortices (from scanner noise) or by attention to introspective or emotional factors (i.e. anxiety during fMRI) could interfere with cognitive task performance. Consequently, neural processing in task-irrelevant networks might be partially inhibited (during tasks periods, but not during rest periods) to increase efficiency of the task-activated network. In this model, deactivation reflects the transition from an inhibited neural state (during “task” periods) to a less inhibited state (during “resting” periods). Several regions in the deactivated networks in our study appear to be related to auditory and emotional tasks. For instance, passive music listening (Brown, et al. 2004) and facial emotion processing (Gur, et al. 2002; Kircher, et al. 2000; Lennox, et al. 2004; Pessoa, et al. 2002; Pierce, et al. 2004) engage the same regions in the limbic and paralimbic systems (insula, ACG, CG, PCG, PHG, MTG, and the retrosplenial cortex). In addition, event-related fMRI studies on inhibition using go/no-go tasks have shown that errors during the tasks are associated to activation of the CG, suggesting an important function of the CG in the dynamic control of behavior (Fassbender, et al. 2004; Garavan, et al. 2003; Garavan, et al. 2002). Therefore, the spatial specificity of deactivated brain regions in our current study makes a simple redistribution of blood supply unlikely, since these regions support neural processing that can interfere with attention processing. Furthermore, brain deactivation during WM tasks correlated with the behavioral data (RT and performance accuracy during the fMRI tasks; Fig. 2); the linear increase of deactivation with task difficulty might reflect greater suppression of neural processes during more demanding tasks, which is consistent with the inhibition model. Recent studies in the rodent somatosensory cortex, however, have failed to reveal any neuronal correlate of negative hemodynamic responses, and it did not support neuronal inhibition as the origin of brain deactivation (Devor, et al. 2005).
In addition to neural inhibition, brain deactivation might also be due to a simple reduction of neuronal activity in deactivated regions as other brain regions become more active (McKiernan, et al. 2003). Furthermore, deactivation could also result form subjects’ anxiety and discomfort in the MRI environment. Our MRI system is based on an older 4 Tesla magnet that has a very long (3 meters) bore, which increases the risk for claustrophobic reactions (two other subjects did not perform the fMRI study for this reason), and produces loud sound pressure levels of acoustic noise (98 dB at the entrance of the tube). fMRI studies on emotional pain modulation have shown that anxiety about pain activates the CG, posterior insula, and the hippocampus (Ploghaus, et al. 2001). PET studies on anticipatory anxiety (painful shocks to subject’s fingers) found that activation at the ACG correlates linearly with the anxiety ratings, suggesting that the rCBF in the medial PFC might reflect a combined effect of attentional demands causing reductions of rCBF, and accompanying performance anxiety that attenuate those reductions (Simpson, et al. 2001). Therefore, during the resting periods, neural processing in the limbic regions might have been enhanced due to greater awareness of the confined MR scanner environment. During the task periods, however, the subjects might have inhibited the interfering neural processing in the limbic system while focusing their attention on the tasks. Similarly, during the resting periods, neural processing in the auditory cortices (the posterior insula adjacent to the primary auditory cortex, BA 41) might have been enhanced by the loud scanner noise. During task periods, the interfering auditory processing might have been partially inhibited to maximize attention to the tasks.
Limitations of the study
Our study could have been improved by using an additional task that activates the insula and the limbic lobe (for instance an emotional task) to test if the areas activated for this task are the same “interfering” areas deactivated by cognitive tasks (working memory and visual attention tasks). In addition, matching the number and duration of tasks and resting blocks could have minimized the number of design feature differences between the tasks. We did not make these improvements because the study was based on a re-analysis of existing data. Furthermore, the order of task-difficulty levels was not counterbalanced (0-, 1-, and 2-back for WM; 2-, 3-, and 4-balls for VA; although the WM/VA-order was counterbalanced) in this work to minimize variance due to differential practice effects. (Tomasi, et al. 2004) This approach, however, could have reduced the effect of cognitive load (WM-load and VA-load).(Tomasi, et al. 2004)
In summary, the findings of this study (the first intra-subject comparison of fMRI-deactivation during different cognitive tasks) are multiple. First, distinct cognitive paradigms (WM(Chang, et al. 2001) and VA(Chang, et al. 2004)) commonly deactivated a network that comprises the frontal (SFG, PreCG, ACG, PCL, and posterior insula), temporal (MTG), occipital (precuneus), and limbic (CG, PHG, and PCG) lobes. Second, WM tasks produced larger deactivation than VA tasks. Third, the PreCG, and the PCL deactivated during WM tasks, but activated during VA tasks. WM and VA tasks both activated a network that includes prefrontal, parietal, and occipital cortices, thalamus and the cerebellum, as reported previously. In this network, positive BOLD signals probably reflect increased local oxygen consumption and increased rCBF. The larger deactivation during MW tasks compared to VA tasks suggests that global CBF is task-dependent. Brain deactivation appears to occur predominantly in brain regions that potentially interfere with or are unimportant for performing the required tasks and is probably a compensatory response to optimize task performance due to limitations in processing bandwidth.
Acknowledgments
We thank Dr. R. Goldstein for helpful discussions on emotional processing, and Dr. K. Leckova and Ms. K. Warren for their help in subject recruitment, assessment and coordination. The study was partly supported by the Department of Energy (Office of Biological and Environmental Research), the National Institutes of Health (GCRC 5-MO1-RR-10710), and the National Institute on Drug Abuse (K24 DA16170; K02 DA16991; R03 DA 017070-01).
References
- Aguirre GK, Zarahn E, DEsposito M. The inferential impact of global signal covariates in functional neuroimaging analyses. Neuroimage. 1998;8:302–306. doi: 10.1006/nimg.1998.0367. [DOI] [PubMed] [Google Scholar]
- Ashburner J, Neelin P, Collins DL, Evans AC, Friston KJ. Incorporating prior knowledge into image registration. Neuroimage. 1997;6:344–352. doi: 10.1006/nimg.1997.0299. [DOI] [PubMed] [Google Scholar]
- Born AP, Law I, Lund TE, Rostrup E, Hanson LG, Wildschiodtz G, Lou HC, Paulson OB. Cortical deactivation induced by visual stimulation in human slow-wave sleep. Neuroimage. 2002;17:1325–1335. doi: 10.1006/nimg.2002.1249. [DOI] [PubMed] [Google Scholar]
- Brown S, Martinez M, Parsons L. Passive music listening spontaneously engages limbic and paralimbic systems. Neuroreport. 2004;15(13):2033–2037. doi: 10.1097/00001756-200409150-00008. [DOI] [PubMed] [Google Scholar]
- Buxton RB. Introduction to Functional Magnetic Resonance Imaging: Principles and Techniques. Cambridge University Press; 2002. [Google Scholar]
- Caparelli EC, Tomasi D, Arnold S, Chang L, Ernst T. k-Space based summary motion detection for functional magnetic resonance imaging. NeuroImage. 2003;20:1411–1418. doi: 10.1016/S1053-8119(03)00339-2. [DOI] [PubMed] [Google Scholar]
- Chang L, Speck O, Miller E, Braun A, Jovicich J, Koch C, Itti L, Ernst T. Neural Correlates Of Attention And Working Memory Deficits In HIV Patients. Neurology. 2001;57:1001–1007. doi: 10.1212/wnl.57.6.1001. [DOI] [PubMed] [Google Scholar]
- Chang L, Tomasi D, Yakupov R, Lozar C, Arnold S, Caparelli E, Ernst T. Adaptation of the attention network in human immunodeficiency virus brain injury. Annals of Neurology. 2004;56(2):259–272. doi: 10.1002/ana.20190. [DOI] [PubMed] [Google Scholar]
- Culham JC, Brandt SA, Cavanagh P, Kanwisher NG, Dale AM, Tootell RBH. Cortical fMRI activation produced by attentive tracking of moving targets. Journal of Neurophysiology. 1998;80(5):2657–2670. doi: 10.1152/jn.1998.80.5.2657. [DOI] [PubMed] [Google Scholar]
- Deary I, Simonotto E, Meyer M, Marshall A, Marshall I, Goddard N, Wardlaw J. The functional anatomy of inspection time: an event-related fMRI study. Neuroimage. 2004;22(4):1466–1479. doi: 10.1016/j.neuroimage.2004.03.047. [DOI] [PubMed] [Google Scholar]
- Devor A, Ulbert I, Dunn A, Narayanan S, Jones S, Andermann M, Boas D, Dale A. Coupling of the cortical hemodynamic response to cortical and thalamic neuronal activity. Proceedings of the National Academy of Sciences U S A. 2005;102(10):3822–3827. doi: 10.1073/pnas.0407789102. [DOI] [PMC free article] [PubMed] [Google Scholar]
- Fassbender C, Murphy K, Foxe J, Wylie G, Javitt D, Robertson I, Garavan H. A topography of executive functions and their interactions revealed by functional magnetic resonance imaging. Cognitive Brain Research. 2004;20(2):132–143. doi: 10.1016/j.cogbrainres.2004.02.007. [DOI] [PubMed] [Google Scholar]
- Friston KJ, Holmes AP, Worsley KJ, Poline JB, Frith CD, Franckowiak RSJ. Statistical parametric maps in functional imaging: a general approach. Human Brain Mapping. 1995;2:189–210. [Google Scholar]
- Garavan H, Ross T, Kaufman J, Stein E. A midline dissociation between error-processing and response-conflict monitoring. Neuroimage. 2003;20(2):1132–1139. doi: 10.1016/S1053-8119(03)00334-3. [DOI] [PubMed] [Google Scholar]
- Garavan H, Ross T, Murphy K, Roche R, Stein E. Dissociable Executive Functions in the Dynamic Control of Behavior: Inhibition, Error Detection, and Correction. Neuroimage. 2002;17(4):1820–1829. doi: 10.1006/nimg.2002.1326. [DOI] [PubMed] [Google Scholar]
- Gavrilescu M, Shaw ME, Stuart GW, Eckersley P, Svalbe ID, Egan GF. Simulation of the effects of global normalization procedures in Functional MRI. Neuroimage. 2002;17:532–542. [PubMed] [Google Scholar]
- Gur R, Schroeder L, Turner T, McGrath C, Chan R, Turetsky B, Alsop D, Maldjian J, Gur R. Brain activation during facial emotion processing. Neuroimage. 2002;16(3 Pt 1):651–662. doi: 10.1006/nimg.2002.1097. [DOI] [PubMed] [Google Scholar]
- Harel N, Lee S, Nagaoka T, Kim D, Kim S. Origin of negative blood oxygenation level-dependent fMRI signals. Journal of Cereb Blood Flow and Metabolism. 2002;22(8):908–917. doi: 10.1097/00004647-200208000-00002. [DOI] [PubMed] [Google Scholar]
- Haxby JV, Horwitz B, Ungerleider LG, Maisog JM, Pietrini P, Grady CL. The functional organization of human extrastriate cortxex: a PET-rCBF study of selective attention to faces and locations. Journal of Neuroscience. 1994;14:6336–6353. doi: 10.1523/JNEUROSCI.14-11-06336.1994. [DOI] [PMC free article] [PubMed] [Google Scholar]
- Hennig J, Scheffler K. Hyperechoes. Magnetic Resonance in Medicine. 2001;46:6–12. doi: 10.1002/mrm.1153. [DOI] [PubMed] [Google Scholar]
- Hester R, Murphy K, Foxe J, Foxe D, Javitt D, Garavan H. Predicting success: patterns of cortical activation and deactivation prior to response inhibition. Journal of Cognitive Neuroscience. 2004;16(5):776–785. doi: 10.1162/089892904970726. [DOI] [PubMed] [Google Scholar]
- Hoge R, Atkinson J, Gill B, Crelier G, Marrett S, Pike G. Linear coupling between cerebral blood flow and oxygen consumption in activated human cortex. Proceedings of the National Academy of Sciences of the United States of America. 1999a;96(16):9403–8. doi: 10.1073/pnas.96.16.9403. [DOI] [PMC free article] [PubMed] [Google Scholar]
- Hoge RD, Atkinson J, Gill B, Crelier GR, Marrett S, Pike GB. Investigation of BOLD signal flow and oxygen consumption: The deohyhemoglobin dilution model. Magnetic Resonance in Medicine. 1999b;42:849–863. doi: 10.1002/(sici)1522-2594(199911)42:5<849::aid-mrm4>3.0.co;2-z. [DOI] [PubMed] [Google Scholar]
- Jovicich J, Peters RJ, Koch C, Braun J, Chang L, Ernst T. Brain Areas Specific for Attentional Load in a Motion Tracking Task. Journal of Cognitive Neuroscience. 2001;13:1048–1058. doi: 10.1162/089892901753294347. [DOI] [PubMed] [Google Scholar]
- Kawashima R, O’Sullivan BT, Roland PE. Positron-emission tomography studies of cross-modality inhibition in selective attentional tasks: Closing the “mind’s eye”. Proceedings of the National Academy of Sciences. 1995;92:5969–5972. doi: 10.1073/pnas.92.13.5969. [DOI] [PMC free article] [PubMed] [Google Scholar]
- Kircher T, Senior C, Phillips M, Benson P, Bullmore E, Brammer M, Simmons A, Williams S, Bartels M, David A. Towards a functional neuroanatomy of self processing: effects of faces and words. Cognitive Brain Research. 2000;10(1–2):133–44. doi: 10.1016/s0926-6410(00)00036-7. [DOI] [PubMed] [Google Scholar]
- Laurienti PJ, Burdette JH, Wallace MT, Yen Y-F, Field AS, Stein BE. Deactivation of sensory-specific cortex by cross-modal stimuli. Journal of Cognitive Neuroscience. 2002;14(3):420–429. doi: 10.1162/089892902317361930. [DOI] [PubMed] [Google Scholar]
- Lawrence N, Ross T, Hoffmann R, Garavan H, Stein E. Multiple neuronal networks mediate sustained attention. Journal of Cognitive Neuroscience. 2003;15(7):1028–1038. doi: 10.1162/089892903770007416. [DOI] [PubMed] [Google Scholar]
- Lee JH, Garwood M, Menon R, Adriany G, Andersen P, Truwit CL, Ugurbil K. High contrast and fast three-dimensional magnetic resonance imaging at high fields. Magnetic Resonance in Medicine. 1995;34:308–312. doi: 10.1002/mrm.1910340305. [DOI] [PubMed] [Google Scholar]
- Lennox B, Jacob R, Calder A, Lupson V, Bullmore E. Behavioural and neurocognitive responses to sad facial affect are attenuated in patients with mania. Psychological Medicine. 2004;34(5):795–802. doi: 10.1017/s0033291704002557. [DOI] [PubMed] [Google Scholar]
- Lewis JW, Beauchamp MS, DeYoe EA. A comparison of visual and auditory motion processing in human cerebral cortex. Cerebral Cortex. 2000;10:873–888. doi: 10.1093/cercor/10.9.873. [DOI] [PubMed] [Google Scholar]
- McKiernan K, Kaufman J, Kucera-Thompson J, Binder J. A parametric manipulation of factors affecting task-induced deactivation in functional neuroimaging. Journal of Cognitive Neuroscience. 2003;15(3):394–408. doi: 10.1162/089892903321593117. [DOI] [PubMed] [Google Scholar]
- Pessoa L, McKenna M, Gutierrez E, Ungerleider L. Neural processing of emotional faces requires attention. Proceedings of the National Academy of Sciences of the United States of America. 2002;99(17):11458–11463. doi: 10.1073/pnas.172403899. [DOI] [PMC free article] [PubMed] [Google Scholar]
- Pierce K, Haist F, Sedaghat F, Courchesne E. The brain response to personally familiar faces in autism: findings of fusiform activity and beyond. Brain. 2004;127(Pt 12):2703–2716. doi: 10.1093/brain/awh289. [DOI] [PubMed] [Google Scholar]
- Ploghaus A, Narain C, Beckmann C, Clare S, Bantick S, Wise R, Matthews P, Rawlins J, Tracey I. Exacerbation of pain by anxiety is associated with activity in a hippocampal network. Journal of Neuroscience. 2001;21(24):9896–9903. doi: 10.1523/JNEUROSCI.21-24-09896.2001. [DOI] [PMC free article] [PubMed] [Google Scholar]
- Raichle ME. Behind the scenes of functional brain amaging: A historical and physiological perspective. Proceedings of the National Academy of Sciences of the United States of America. 1998;95:765–772. doi: 10.1073/pnas.95.3.765. [DOI] [PMC free article] [PubMed] [Google Scholar]
- Raichle ME, Gusnard DA. Appraising the brain’s energy budget. Proceedings of the National Academy of Sciences of the United States of America. 2002;99:10237–10239. doi: 10.1073/pnas.172399499. [DOI] [PMC free article] [PubMed] [Google Scholar]
- Shmuel A, Yacoub E, Pfeuffer J, Van de Moortele P-F, Adriany G, Hu X, Ugurbil K. Sustained negative BOLD, blood flow and oxygen consumption response and its coupling to the positive response in the human brain. Neuron. 2002;36:1195–1210. doi: 10.1016/s0896-6273(02)01061-9. [DOI] [PubMed] [Google Scholar]
- Shulman GL, Corbetta M, Buckner RL, Raichle ME, Fiez JA, Miezin FM, Petersen SE. Top-down modulation of early sensory cortex. Cerebral Cortex. 1997;7:193–206. doi: 10.1093/cercor/7.3.193. [DOI] [PubMed] [Google Scholar]
- Simpson JR, Drevets WC, Snyder AZ, Gusnard DA, Raichle ME. Emotion-induced changes in human medial prefrontal cortex: II. During anticipatory anxiety. Proceedings of the National Academy of Sciences of the United States of America. 2001;98(2):688–693. doi: 10.1073/pnas.98.2.688. [DOI] [PMC free article] [PubMed] [Google Scholar]
- Smith A. Symbol Digit Modalities Test: Western Psychological Services. 1982. [Google Scholar]
- Stefanovic B, Warnking J, Pike G. Hemodynamic and metabolic responses to neuronal inhibition. Neuroimage. 2004;22(2):771–778. doi: 10.1016/j.neuroimage.2004.01.036. [DOI] [PubMed] [Google Scholar]
- Stroop J. Studies of interference in serial verbal reaction. Journal of Experimental Psychology. 1935;18:643–662. [Google Scholar]
- Tomasi D, Caparelli E, Chang I, Ernst T, Telang F. Acoustic noise changes fMRI activation during visual attention tasks. Toronto, Canada: 2005a. [Google Scholar]
- Tomasi D, Caparelli EC, Chang L, Ernst T. fMRI-acoustic noise alters brain activation during working memory tasks. Neuroimage. 2005b doi: 10.1016/j.neuroimage.2005.04.010. (in press) [DOI] [PMC free article] [PubMed] [Google Scholar]
- Tomasi D, Chang I, Caparelli EC, Foerster B, Ernst T, Telang F. Acoustic Interference on working memory in HIV patients. Miami, USA: 2005c. May, [Google Scholar]
- Tomasi D, Ernst T, Caparelli EC, Chang L. Practice-induced changes of brain function during visual attention: A parametric fMRI study at 4 Tesla. Neuroimage. 2004;23:1414–1421. doi: 10.1016/j.neuroimage.2004.07.065. [DOI] [PubMed] [Google Scholar]