

Abstract
Aromatic amines, N-nitroso compounds and heterocyclic amines are suspected human pancreatic carcinogens. Cytochrome P450 (CYP) 1A2, N-acetyltransferase (NAT) 1, NAT2 and sulfotransferase (SULT) are enzymes involved in the metabolism of these carcinogens. To test the hypothesis that genetic variations in carcinogen metabolism modify the risk of pancreatic cancer (PC), we investigated the effect of single-nucleotide polymorphisms (SNPs) of the CYP1A2, NAT1, NAT2 and SULT1A1 gene on modification of the risk of PC in a hospital-based study of 755 patients with pancreatic adenocarcinoma and 636 healthy frequency-matched controls. Smoking and dietary mutagen exposure information was collected by personal interviews. Genotypes were determined using the polymerase chain reaction–restriction fragment length polymorphism and Taqman methods. Odds ratios (ORs) and 95% confidence intervals (CIs) were estimated using unconditional multivariate logistic regression analysis. We observed no significant main effects of any of these genes on the risk of PC. The CYP1A2 and NAT1 but not SULT1A1 and NAT2 genotypes showed significant interactions with heavy smoking in women not men. In contrast, a significant interaction between NAT1 genotype and dietary mutagen intake on modifying the risk of PC were observed among men but not women. The OR (95% CI) of PC was 2.23 (1.33–3.72) and 2.54 (1.51–4.25) for men having the NAT1*10 and a higher intake of 2-amino-1-methyl-6-phenylimidazo[4,5-b]pyridine and benzo[a]pyrene, respectively, compared with individuals having no NAT1*10 or a lower intake of these dietary mutagens. These data suggest the existence of gender-specific susceptibility to tobacco carcinogen and dietary mutagen exposure in PC.
Introduction
Pancreatic cancer (PC) causes 33 700 deaths/year in USA, making it the fourth most common cause of cancer deaths; furthermore, the mortality rate for PC has remained unchanged over the past few decades (1). Understanding the etiology and identifying the risk factors are essential for the primary prevention of this deadly disease.
Cigarette smoking, a major source of carcinogen exposure, is the only environmental risk factor for PC that has been consistently implicated in epidemiological studies (2). Cigarette smoke contains many toxic constituents, including 43 known carcinogens (3). Carcinogenic aromatic amines (AAs) and tobacco-specific nitrosamines detected in cigarette smoke are hypothesized to be major causal factors in the etiology of various cancers (4). Previous studies by our group (5,6) and a study by other investigators (7) showed that individual variations in carcinogen-metabolizing genes modify the risk of smoking-related PC.
Another suspected risk factor for PC is diet (8). Epidemiological studies have shown an association between increased risk for PC and high consumption of salt, smoked meat, dehydrated food, fried food and refined sugar (9–11). In particular, meat cooked at high temperatures, such as barbecued or deep-fried meat, is a source of carcinogenic heterocyclic amines (HCAs) and polycyclic aromatic hydrocarbons (PAHs) (12,13). Processed or smoked meat could also serve as a source of N-nitroso compounds (NOCs), represented by nitrosamines, a suspected class of pancreatic carcinogens (14). Notably, the high frequency of K-ras mutation in human PCs parallels that found in pancreatic tumors in hamsters induced by NOCs (15). However, investigations pursuing estimates of dietary NOC intakes were impeded by the lack of a good study instrument. The major subclass of HCAs found in the human diet comprises the aminoimidazoazaarenes 2-amino-3-methylimidazo[4,5-f]quinoline, 2-amino-3,4-dimethylimidazo[4,5-f]quinoline, 2-amino-3,8-dimethylimidazo[4,5-f]quinoxaline (MeIQx), 2-amino-3,4,8-trimethylimidazo[4,5-f]quinoxaline (DiMeIQx) and 2-amino-1-methyl-6-phenylimidazo[4,5-b]pyridine (PhIP) (16,17). The pancreas is highly susceptible to HCA-induced DNA damage, and studies have shown that HCA compounds induce pancreatic tumors and promote tumor growth in animals (18,19). Furthermore, benzo[a]pyrene (BaP) is one of the most potent PAH animal carcinogens (20), and dietary exposure to it causes increased tumor formation at several sites, particularly in the gastrointestinal tract, in animal models (21). Using a well-established meat preparation questionnaire and a relevant database, dietary intake of HCAs and PAHs has been associated with increased risk of PC (22,23). Therefore, the current study examined exposures only to dietary HCAs and PAHs.
Genetic factors that influence individual susceptibility to dietary mutagen exposure-associated PC are unclear. Cytochrome P450 (CYP) 1A2, N-acetyltransferase (NAT) and sulfotransferase (SULT) are enzymes involved in the detoxification as well as bioactivation of AAs, HCAs and NOCs (24–27). Usually, these carcinogens are activated by N-hydroxylation catalyzed by hepatic CYP (28). Alternatively, they are either N-acetylated or N-sulfated by NAT or SULT, respectively, for detoxification. However, following N-hydroxylation, they can be O-acetylated or O-sulfated by the same enzymes, yielding highly reactive intermediates capable of binding to DNA (29).
More than 40 single-nucleotide polymorphisms (SNPs) of the CYP1A2 gene have been identified. Because many of the SNPs are in linkage disequilibrium, CYP1A2*1D and CYP1A2*1F have been suggested to be the most informative alleles for CYP1A2 genotype assessment (30). We have demonstrated previously that presence of the CYP1A2*1F allele has additive effects on increased risk of PC among smoking women (5). Two NAT isoenzymes—NAT1 and NAT2—are found in humans. The former is expressed in all human tissues, including the pancreas (31), whereas the latter is expressed primarily in liver and gastrointestinal tract (32,33). Both NAT1 and NAT2 catalyze the O-acetylation of a number of carcinogenic N-hydroxy AAs and HCAs (34). The NAT1 and NAT2 genes are located on chromosomes 8p23.1-p21.3 and 8p22, respectively, and both are encoded by single open reading frames of 870 bp that exhibit genetic polymorphisms in human populations (35). Molecular epidemiological studies demonstrated that individuals with NAT1 rapid acetylator genotypes or NAT2 slow acetylator genotypes and exposed to known AA and HCA carcinogens, such as in cigarette smoke, diet or occupation, were at increased risk for various types of human cancers (36,37). In our previous studies, NAT1 rapid acetylator genotype and NAT2 slow acetylator genotype were associated with a significantly increased risk of PC among heavy smokers (5,6).
SULT1A1 belongs to a gene superfamily involved in the sulfonation of hormones, neurotransmitters, drugs and xenobiotic compounds. O-sulfation is a common step in phase II enzyme detoxification; however, sulfate anions may be cleaved off heterolytically and release electrophils that may bind to DNA (38). Also, studies showed that G638A leading to an amino acid change from arginine to histidine at codon 213 (Arg213His) was associated with reduced enzyme activity and thermostability (39,40). A number of studies of SULT1A1 polymorphisms and cancers of the lung, colon, prostate, bladder, esophagus and urinary tract have had conflicting results (41–46).
To identify genetic factors involved in carcinogen exposure-associated PC, we examined SNPs of the CYP1A2, NAT and SULT genes in association with AA and HCA exposures in a hospital-based PC case–control study.
Materials and methods
Study population
The study population and design were described in detail previously (23). Cases were patients with pathologically confirmed primary pancreatic ductal adenocarcinoma and were recruited consecutively from the Gastrointestinal Center at The University of Texas MD Anderson Cancer Center from 2000 to 2006. No restrictions on the recruitment of patients with respect to age, race or sex were used. Also, healthy controls were recruited from among the spouses, friends and non-blood relatives of patients with various types of cancers other than gastrointestinal cancers or other smoking-related cancers. Eligible controls were identified using a brief screening questionnaire to collect information on demographics, cancer history, state of residence, relationship to the respective patient and willingness to participate in a research project. The controls were frequency matched with the cases by age at enrollment (5-year interval), sex and race. All study participants were residents of USA and were able to communicate in English. Written informed consent for interviews and a blood sample were obtained from each participant. The study was approved by the MD Anderson Cancer Center Institutional Review Board.
Data collection
A trained study coordinator administered a structured risk factor questionnaire to collect demographic data and information on cigarette smoking, alcohol consumption, occupational history, medical history and family history of cancer. Both patients and controls were interviewed by the same study personnel. No proxy interviews were conducted. Cumulative smoking was calculated in pack-years, i.e. the number of packs smoked per day multiplied by the number of years of smoking. Those who had smoked for >20 pack-years were considered to be heavy smokers. The individuals who consumed >60 g/day alcohol were defined as heavy drinkers. Information on dietary mutagen exposure was collected in personal interviews using a meat preparation questionnaire (23). The questionnaire provided information on daily consumption of MeIQx, PhIP, DiMeIQx and BaP as well as a mutagenic index (revertant colonies per grams of daily meat intake), which was calculated using previously obtained laboratory information regarding the mutagenic activity of meat sample extracts in a standard Ames assay with Salmonella typhimurium strain TA98 (47).
DNA extraction and genotyping assays
Blood samples were collected in heparinized vacutainers (BD Biosciences, Franklin Lakes, NJ). Peripheral blood mononuclear cells were separated from freshly drawn blood using Ficoll-Hypaque density gradient centrifugation (Amersham Pharmacia Biotech, Piscataway, NJ). DNA was extracted from mononuclear cells using a FlexiGene DNA kit (Qiagen, Valencia, CA) and the Maxwell 16 automated system (Promega, Madison, WI).
CYP1A2*1F polymorphism (rs762551) was determined by polymerase chain reaction (PCR)–restriction fragment length polymorphism (5) and Taqman (48) methods as described previously. Probes and oligonucleotides were obtained from Applied Biosystems (Foster City, CA) using the Assay-by-Design product. The PCR amplification was done using the ABI Prism 7900 HT sequence detector.
Genotyping of SULT1A1 for polymorphisms at G638A was performed by PCR–restriction fragment length polymorphism method. The primers used for amplification of the target fragment were SULT F 5′-GGGTTTCTAGGA-GAAGTGGC-3′ and SULT R 5′-GAGATGCTGTGGTCCATGA-3′, which produce a 275 bp exon 7 region of the SULT1A1 gene containing the G638A site. PCR was performed in a 20 μl reaction mixture containing 100 ng DNA, 0.25 μM each primer, 50 μM each deoxy nucleotide triphosphate (dNTP) and 0.4 U Taq DNA polymerase with 1.5 mM MgCl2 containing 10× ammonium reaction buffer (Gene Choice, Frederick, MD). The reaction was carried out under the following conditions: an initial melting step for 6 min at 94°C followed by 32 cycles for 45 s at 94°C, 35 s at 62°C and 30 s at 72°C and a final elongation for 7 min at 72°C. The PCR products were then digested using the restriction enzyme HhaI (New England Biolabs, Beverly, MA) overnight and separated on a 2.5% agarose gel. The wild-type G allele had an HhaI restriction site that resulted in two bands (155 and 115 bp, respectively); the A allele lacked an HhaI restriction site and thus produced a single 270 bp fragment. The laboratory personnel were blinded to the case–control status of the samples.
Eight SNPs of the NAT1 gene (C97T, C190T, G445A, C559T, G560A, A752T, T1088A and C1095T) and seven SNPs of the NAT2 gene (G191A, C282T, T341C, C481T, G590A, A803G and G857A) were analyzed using Taqman as described previously (49,50). About 10% of the samples were analyzed in duplicate, and inconsistent results from five samples were excluded from the final risk analysis. The NAT1*10 allele or NAT2 slow acetylation alleles (NAT2*5, *6, *7 and *14 clusters) were considered to be the ‘at-risk’ alleles.
Statistical analysis
Chi-square tests were used to compare the distribution of categorical variables and genotype frequencies in the patients and controls. Unconditional multivariate logistic regression analysis was used to calculate odds ratios (ORs) and 95% confidence intervals (CIs). The basic statistical models were adjusted for sex, race (white, Hispanic, black and Asian), age (≤50, 51–60, 61–70 and >70 years), smoking status (non-smoker, ≤20 pack-years and >20 pack-years), alcohol consumption (never, ≤60 g/day and >60 g/day), history of diabetes (yes or no) and family history of cancer among first-degree relatives (yes or no) when appropriate. Dietary mutagen intake variables were dichotomized using the 60th percentile of the control value as the cutoff as reported previously (23). Genotype-related evaluations were restricted to non-Hispanic white participants because of a small number of minority participants. To explore the potential gene–environment interaction according to smoking status (never smoker versus ever smoker), number of pack-years (0, ≤20 and >20) and dietary intake of HCAs (≤60th or >60th percentile of the control value), the cross-product term for genotype and the variable of interest was generated in unconditional logistic regression models. A two-by-four table was constructed to evaluate the scale of interaction (i.e. the departure from an additive or multiplicative model). The significance of the interaction term was determined using a likelihood ratio test, with the full model containing the interaction term, the main effect of genotype, the exposure variable and the reduced model lacking the interaction term. OR trends were examined using the score test with adjustment for other risk factors, treating the interaction term as a continuous variable.
To explore the possible interactions of the many environmental and genetic factors involved in this study, we used logic regression (51) to find the best logical combination of factors that predicted case–control status. The method works by searching all possible combinations of factors joined by ‘and/or’ operators and finding the one that yielded the best separation between cases and controls. The method results in a new composite predictor ‘L’ that is a single dichotomous factor in a logistic regression. We then ran a permutation test (1000 permutations) to obtain a P value for this composite factor that takes the multiple testing aspect of logic regression into account. Factors that were considered in the analysis included smoking, dietary mutagen exposure, family history of cancer among first-degree relatives, diabetes, alcohol and genotype. Pack-years were selected as the reflection of smoking status. Non-smoker, light smoker and heavy smoker were coded as 0, 1 and 2, respectively. We considered two different cut-points for defining light smokers and heavy smokers: 20 or 40 pack-years. For dietary mutagen exposure, the influence of individual mutagen intake (MeIQx, DiMeIQx, PhIP and BaP) and overall mutagenicity (revertants per gram per day) was considered separately. We used the median or the third quartile in controls as potential group cut-point for each of those variables. Alcohol consumption was considered by groups of non-drinker, light drinker and heavy drinker, using >60 ml ethanol/day as the cutoff for heavy drinkers. For the genetic variables, both dominant and recessive models for each genetic marker were considered.
All statistical analyses were performed using the Stata 9.0 (StataCorp, College Station, TX), R and SAS software programs. All tests were two sided and P values <0.05 were indicative of statistical significance.
Results
Characteristics of the study subjects and genotype frequency
We performed this study in 755 patients with pancreatic adenocarcinoma and 636 healthy frequency-matched controls; their demographics and potential risk factors for PC and genotype frequency are listed in Table I. We observed no significant differences between the patients and controls according to age, sex or alcohol consumption, but we did according to race, family history of cancer, history of diabetes and smoking status. The mean ages of the patients and controls (±standard deviation) were 62.1 ± 10.2 years and 60.9 ± 10.1 years, respectively (P = 0.89). Although the number was small, there were fewer minority controls than minority patients (8 versus 14%) because of the known challenges in minority recruitment. All genotype distributions in controls followed the Hardy–Weinberg equilibrium among non-Hispanic white participants. We observed no significant differences between patients and controls in the distribution of these genotypes.
Table I.
Distribution of selected variables among cases and controls
| Variable | Cases
(N = 755) n (%) |
Controls
(N = 636) n (%) |
P value |
|---|---|---|---|
| Age at recruitment (years) | 0.26 | ||
| ≤50 | 103 (13.7) | 103 (16.2) | |
| 51–60 | 221 (29.3) | 194 (30.5) | |
| 61–70 | 260 (34.4) | 219 (34.4) | |
| >70 | 171 (22.6) | 120 (18.9) | |
| Gender | 0.33 | ||
| Female | 320 (42.4) | 253 (39.8) | |
| Male | 435 (57.6) | 383 (60.2) | |
| Race | 0.004 | ||
| Non-Hispanic white | 649 (86.0) | 585 (92.0) | |
| Hispanic | 47 (6.2) | 24 (3.8) | |
| Black | 50 (6.6) | 21 (3.2) | |
| Other | 9 (1.2) | 6 (1.0) | |
| Family history of cancera | <0.001 | ||
| No | 175 (23.3) | 197 (31.0) | |
| Yes | 577 (76.7) | 438 (69.0) | |
| History of diabetesb | <0.001 | ||
| No | 567 (75.1) | 571 (90.0) | |
| Yes | 188 (24.9) | 64 (10.0) | |
| Smoking status | <0.001 | ||
| Non-smokers | 304 (40.3) | 310 (48.7) | |
| ≤20 pack-years | 186 (24.6) | 166 (26.1) | |
| >20 pack-years | 265 (35.1) | 160 (25.2) | |
| Alcohol consumptionc | 0.345 | ||
| Never | 334 (44.2) | 271 (43.6) | |
| ≤60 g/day | 362 (47.9) | 313 (50.4) | |
| >60 g/day | 59 (7.9) | 37 (6.0) | |
| CYP1A2*1Fd | 0.957 | ||
| AA | 341 (52.5) | 307 (52.5) | |
| AC | 276 (42.5) | 247 (42.2) | |
| CC | 32 (4.9) | 31 (5.3) | |
| Sult1A1 | 0.651 | ||
| GG | 248 (38.2) | 228 (39.0) | |
| GA | 368 (56.7) | 321 (54.9) | |
| AA | 33 (5.1) | 36 (6.2) | |
| NAT1 | 0.353 | ||
| Non*10 | 431 (66.4) | 403 (68.9) | |
| *10 | 218 (33.6) | 182 (31.1) | |
| NAT2 | 0.797 | ||
| Rapid | 38 (5.9) | 34 (5.8) | |
| Intermediate | 248 (38.2) | 213 (36.4) | |
| Slow | 363 (55.9) | 338 (57.8) |
Information was missing for three cases and one control because of adopted family.
Information was missing for one control.
Information was missing for 15 controls.
Distribution for non-Hispanic white.
Interaction of genotypes with smoking
Next, we examined the association between these genotypes and the risk of PC in relation to cigarette smoking in the non-Hispanic white patients and controls. We confirmed our previously reported observations that a significant trend of increased risk of PC was associated with smoking and CYP1A2 and NAT genotypes in women but not in men (Table II and Figure 1). Heavy smokers among women (>20 pack-years) carrying the CYP1A2*1F AA genotype had an adjusted OR of 4.36 (95% CI = 2.15–8.84) compared with never smokers carrying the AC or CC genotypes. Also, heavily smoking women with the NAT1*10 allele had a 4-fold higher risk (OR, 4.01; 95% CI = 1.73–9.29) of PC when compared with never smokers who did not carry the NAT1*10 allele. In addition, all the gene–smoking interactions were statistically significant at the multiplicative scale among women.
Table II.
Interaction of genotypes with cigarette smoking in non-Hispanic white participants
| Genotype | Smoke (pack-years) | Male
|
Female
|
||||
|---|---|---|---|---|---|---|---|
| Cases/controls, n | OR (95% CI)a | Pinteraction | Cases/controls, n | OR (95% CI)a | Pinteraction | ||
| CYP1A2*1F | 0.805 | <0.001 | |||||
| AC/CC | Never | 60/62 | 1.0 | 55/79 | 1.0 | ||
| AA | Never | 78/86 | 0.99 (0.61–1.60) | 60/62 | 1.35 (0.80–2.25) | ||
| AC/CC | ≤20 | 50/43 | 1.11 (0.64–1.94) | 31/27 | 1.51 (0.78–2.91) | ||
| AA | ≤20 | 42/47 | 0.94 (0.53–1.64) | 35/24 | 2.31 (1.21–4.42) | ||
| AC/CC | >20 | 74/44 | 1.75 (1.03–2.97) | 38/22 | 2.24 (1.15–4.38) | ||
| AA | >20 | 81/72 | 1.06 (0.64–1.73) | 45/16 | 4.36 (2.15–8.84) | ||
| Ptrend | 0.430 | <0.001 | |||||
| SULT1A1 | 0.023 | <0.001 | |||||
| GG | Never | 59/52 | 1.0 | 43/53 | 1.0 | ||
| GA/AA | Never | 79/96 | 0.76 (0.47–1.25) | 72/89 | 0.97 (0.57–1.65) | ||
| GG | ≤20 | 27/33 | 0.73 (0.38–1.41) | 19/21 | 1.00 (0.46–2.19) | ||
| GA/AA | ≤20 | 60/53 | 0.94 (0.54–1.62) | 43/30 | 1.91 (1.00–3.62) | ||
| GG | >20 | 49/48 | 0.84 (0.48–1.47) | 38/19 | 2.45 (1.18–5.08) | ||
| GA/AA | >20 | 97/69 | 1.21 (0.72–2.01) | 44/18 | 2.96 (1.45–6.06) | ||
| Ptrend | 0.330 | <0.001 | |||||
| NAT1 | 0.408 | 0.012 | |||||
| Non*10 | Never | 88/101 | 1.0 | 70/96 | 1.0 | ||
| *10 | Never | 50/47 | 1.22 (0.74–2.02) | 45/46 | 1.34 (0.78–2.29) | ||
| Non*10 | ≤20 | 62/56 | 1.18 (0.73–1.89) | 45/38 | 1.64 (0.93–2.87) | ||
| *10 | ≤20 | 25/30 | 0.92 (0.49–1.73) | 17/13 | 1.98 (0.89–4.44) | ||
| Non*10 | >20 | 97/82 | 1.24 (0.81–1.90) | 55/27 | 2.71 (1.50–4.89) | ||
| *10 | >20 | 49/35 | 1.55 (0.91–2.66) | 27/10 | 4.01 (1.73–9.29) | ||
| Ptrend | 0.300 | <0.001 | |||||
| NAT2 | 0.021 | 0.002 | |||||
| R/I | Never | 62/53 | 1.0 | 56/65 | 1.0 | ||
| Slow | Never | 76/95 | 0.65 (0.40–1.06) | 59/77 | 0.81 (0.48–1.36) | ||
| R/I | ≤20 | 39/38 | 0.80 (0.44–1.45) | 23/21 | 1.47 (0.72–3.03) | ||
| Slow | ≤20 | 48/48 | 0.77 (0.44–1.37) | 39/30 | 1.34 (0.71–2.53) | ||
| R/I | >20 | 58/51 | 0.87 (0.51–1.51) | 39/16 | 2.71 (1.30–5.65) | ||
| Slow | >20 | 88/66 | 1.03 (0.62–1.71) | 43/21 | 2.27 (1.16–4.46) | ||
| Ptrend | 0.622 | 0.001 | |||||
R/I = rapid/intermediate.
OR was adjusted for age, family history of cancer, history of diabetes and alcohol consumption.
Fig. 1.
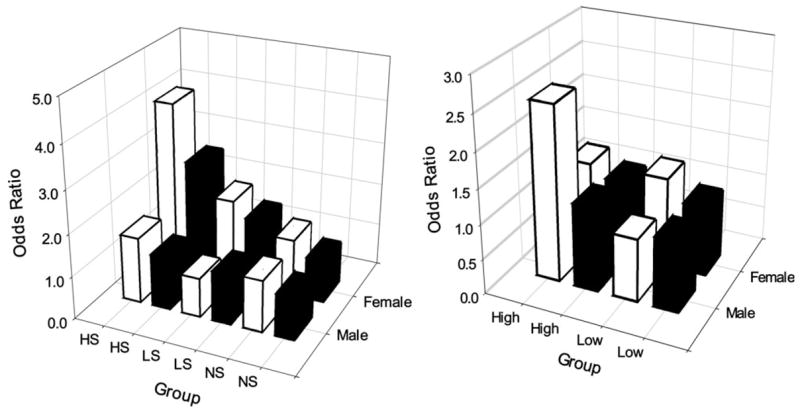
Interactive effects of NAT1 genotype with cigarette smoking (left panel) or dietary BaP intake (right panel) on risk of PC. NS, never smokers; LS, light smokers (≤20 pack-years); HS, heavy smokers (>20 pack-years); high, >52.10 ng/day (60th percentile of controls) of BaP intake; low, ≤52.10 ng/day. Solid bars, NAT1 non*10; open bars, NAT1*10.
Genotype and dietary mutagen exposure
The mean intake of dietary mutagens (MeIQx, DiMeIQx, PhIP and BaP) and mutagenicity index in consumed meat were higher in patients than in controls as we reported previously (23). When we dichotomized dietary mutagen intake according to the 60th percentile of control values, PhIP and BaP intake was associated with a 1.37-fold (95% CI = 0.99–1.91) and 1.64-fold (95% CI = 1.19–2.26) increased risk of PC, respectively, in men but not women (data not shown). Consequently, we examined the joint effect of dietary mutagen intake and genotype in male non-Hispanic white participants only (Table III and Figure 1). Of the four genes investigated, NAT1*10 showed significant interaction with each of the five parameters of mutagen exposure in modifying the risk of PC. Individuals carrying the NAT1*10 allele and having a higher intake of (in the top 40%) dietary mutagens had a 1.64- to 2.54-fold higher risk of PC than did those without the NAT1*10 allele and had lower levels of dietary mutagen intake. Finally, we did not observe any significant interactions between the CYP1A2*1F, SULT1A1 and NAT2 genotypes and dietary mutagen intake in modification of the risk of PC among men and we did not observe a significant interaction between any genotype and dietary mutagen intake in women (data not shown).
Table III.
Interaction between genotype and dietary mutagen intake in men
| Mutagen | CYP1A2*F | Cases/controls | OR (95% CI)a | Pinteraction | SULT1A1 | Cases/controls | OR (95% CI)a | Pinteraction |
|---|---|---|---|---|---|---|---|---|
| MeIQx | ||||||||
| ≤44.98 | AC/CC | 72/67 | 1.0 | 0.148 | GG | 51/67 | 1.0 | 0.566 |
| ≤44.98 | AA | 93/100 | 0.9 (0.6–1.4) | GA/AA | 114/100 | 1.4 (0.9–2.2) | ||
| >44.98 | AC/CC | 74/57 | 1.2 (0.7–1.9) | GG | 70/57 | 1.4 (0.8–2.4) | ||
| >44.98 | AA | 74/78 | 0.8 (0.5–1.3) | GA/AA | 78/78 | 1.2 (0.7–1.9) | ||
| Ptrend | 0.753 | 0.450 | ||||||
| DiMeIQx | ||||||||
| ≤2.37 | AC/CC | 80/72 | 1.0 | 0.569 | GG | 53/69 | 1.0 | 0.995 |
| ≤2.37 | AA | 86/107 | 0.8 (0.5–1.2) | GA/AA | 113/110 | 1.2 (0.8–1.9) | ||
| >2.37 | AC/CC | 66/52 | 1.1 (0.7–1.8) | GG | 68/55 | 1.4 (0.8–2.3) | ||
| >2.37 | AA | 81/71 | 0.9 (0.6–1.6) | GA/AA | 79/68 | 1.4 (0.8–2.3) | ||
| Ptrend | 0.938 | 0.319 | ||||||
| PhIP | ||||||||
| ≤162.3 | AC/CC | 70/75 | 1.0 | 0.133 | GG | 62/77 | 1.0 | 0.902 |
| ≤162.3 | AA | 88/105 | 0.9 (0.6–1.4) | GA/AA | 96/103 | 1.1 (0.7–1.7) | ||
| >162.3 | AC/CC | 76/49 | 1.6 (0.9–2.7) | GG | 59/47 | 1.5 (0.9–2.5) | ||
| >162.3 | AA | 79/73 | 1.1 (0.7–1.8) | GA/AA | 96/75 | 1.5 (0.9–2.4) | ||
| Ptrend | 0.436 | 0.071 | ||||||
| BaP | ||||||||
| ≤52.10 | AC/CC | 67/71 | 1.0 | 0.440 | GG | 55/70 | 1.0 | 0.494 |
| ≤52.10 | AA | 77/104 | 0.8 (0.5–1.2) | GA/AA | 89/105 | 1.0 (0.6–1.6) | ||
| >52.10 | AC/CC | 79/53 | 1.5 (0.9–2.4) | GG | 66/54 | 1.4 (0.9–2.4) | ||
| >52.10 | AA | 90/74 | 1.2 (0.8–2.0) | GA/AA | 103/73 | 1.7 (1.0–2.7) | ||
| Ptrend | 0.197 | 0.016 | ||||||
| Mutagenicity | ||||||||
| ≤7141 | AC/CC | 70/71 | 1.0 | 0.169 | GG | 53/69 | 1.0 | 0.917 |
| ≤7141 | AA | 86/99 | 0.9 (0.6–1.4) | GA/AA | 103/101 | 1.2 (0.8–1.9) | ||
| >7141 | AC/CC | 76/53 | 1.3 (0.8–2.2) | GG | 68/55 | 1.4 (0.8–2.4) | ||
| >7141 | AA | 81/79 | 0.9 (0.6–1.5) | GA/AA | 89/77 | 1.3 (0.8–2.2) | ||
| Ptrend | 0.685 | 0.132 | ||||||
| MeIQx | NAT1 | NAT2 | ||||||
| ≤44.98 | Non*10 | 115/115 | 1.0 | 0.005 | R/I | 64/68 | Reference | 0.355 |
| ≤44.98 | Any*10 | 50/52 | 1.0 (0.6–1.6) | S | 101/99 | 1.1 (0.7–1.7) | ||
| >44.98 | Non*10 | 83/96 | 0.8 (0.5–1.2) | R/I | 66/54 | 1.3 (0.7–2.1) | ||
| >44.98 | Any*10 | 65/39 | 1.6 (1.0–2.7) | S | 82/81 | 0.9 (0.6–1.6) | ||
| Ptrend | 0.210 | 0.922 | ||||||
| DiMeIQx | ||||||||
| ≤2.37 | Non*10 | 118/127 | 1.0 | 0.012 | R/I | 64/68 | 1.0 | 0.799 |
| ≤2.37 | Any*10 | 48/52 | 1.0 (0.6–1.7) | S | 102/111 | 0.9 (0.6–1.5) | ||
| >2.37 | Non*10 | 80/84 | 0.9 (0.6–1.4) | R/I | 66/54 | 1.2 (0.7–2.1) | ||
| >2.37 | Any*10 | 67/39 | 1.8 (1.1–3.0) | S | 81/69 | 1.1 (0.7–1.9) | ||
| Ptrend | 0.142 | 0.885 | ||||||
| PhIP | ||||||||
| ≤162.3 | Non*10 | 105/123 | 1.0 | 0.011 | R/I | 62/66 | 1.0 | 0.858 |
| ≤162.3 | Any*10 | 53/57 | 1.1 (0.7–1.7) | S | 96/114 | 0.9 (0.6–1.4) | ||
| >162.3 | Non*10 | 93/88 | 1.1 (0.7–1.7) | R/I | 68/56 | 1.3 (0.7–2.1) | ||
| >162.3 | Any*10 | 62/34 | 2.2 (1.3–3.7) | S | 87/66 | 1.3 (0.8–2.1) | ||
| Ptrend | 0.018 | 0.293 | ||||||
| BaP | ||||||||
| ≤52.10 | Non*10 | 98/117 | 1.0 | 0.004 | R/I | 57/69 | 1.0 | 0.592 |
| ≤52.10 | Any*10 | 46/58 | 0.9 (0.6–1.6) | S | 87/106 | 1.0 (0.6–1.6) | ||
| >52.10 | Non*10 | 100/94 | 1.2 (0.8–1.8) | R/I | 73/53 | 1.7 (1.0–2.8) | ||
| >52.10 | Any*10 | 69/33 | 2.5 (1.5–4.3) | S | 96/74 | 1.5 (0.9–2.4) | ||
| Ptrend | 0.003 | 0.114 | ||||||
| Mutagenicity | ||||||||
| ≤7141 | Non*10 | 105/115 | 1.0 | 0.005 | R/I | 59/64 | 1.0 | 0.592 |
| ≤7141 | Any*10 | 51/55 | 0.9 (0.6–1.6) | S | 97/106 | 1.0 (0.6–1.6) | ||
| >7141 | Non*10 | 93/96 | 0.9 (0.6–1.4) | R/I | 71/58 | 1.3 (0.8–2.2) | ||
| >7141 | Any*10 | 64/36 | 1.9 (1.2–3.2) | S | 86/74 | 1.1 (0.7–1.8) | ||
| Ptrend | 0.045 | 0.510 | ||||||
R/I = rapid/intermediate; S = slow.
OR was adjusted for age, family history of cancer, history of diabetes, smoking status and alcohol consumption.
Fitted logic regression model
Because our study involves multiple exposure and genetic factors, we explored the gene–gene and gene–environmental interactions using the logic regression approach (51). This method searches all possible combinations of factors joined by and/or operators and identifies the best composite predictor L that is a single dichotomous factor. The logistic regression model containing the newly created factor L is shown in Table IV. The fitted model indicated that subjects who have [(history of diabetes = yes and SULT1A1 = GA/GG) or (CYP1A2*1F = CA/AA and not a light smoker)] or [(heavy smoker or NAT2 = rapid) and (heavy drinker or NAT1 = any*10)] have a significantly increased risk of PC compared with the other group (OR = 2.59, P<0.001 based on 1000 permutation tests). This predictor indicates three distinct groups that demonstrated a greater probability of being in the PC than control groups: (i) those with diabetes and SULT1A1 GA/GG genotype; (ii) those who are not light smokers carrying the CYP1A2*1F CA/AA genotype and (iii) those who are heavy smokers or with the NAT2 rapid genotype and being either heavy drinkers or possess the NAT1*10 allele. The case–control status broken out by these three groups is shown in Table V.
Table IV.
Fitted logistic regression model for case–control in non-Hispanic white participants
| Variable | Case, n (%) | Control, n (%) | OR | P |
|---|---|---|---|---|
| L = 0 | 332 (46) | 390 (54) | Reference | |
| L = 1 | 194 (69) | 88 (31) | 2.59 | <0.001 |
L = 1: [(history of diabetes = yes and SULT1A1 = GA/GG) or (CYP1A2*1F = CA/AA and not a light smoker)] or [(heavy smoker or NAT2 = rapid) and (heavy drinker or NAT1 = *10)]. L = 0: except for above. P value was calculated based on 1000 permutation tests. The 95th percentile of OR in the permutation distribution was 1.27.
Table V.
Case–control status for three components of composite predictor from logic regression analysis
| Variable | Case,
n (%) |
Control,
n (%) |
|---|---|---|
| History of diabetes = yes or SULT1A1 = GA/GG | 419 (49) | 432 (51) |
| History of diabetes = yes and SULT1A1 = GA/GG | 107 (69) | 46 (31) |
| CYP1A2*1F = CA/AA or a light smoker | 504 (52) | 470 (48) |
| CYP1A2*1F = CA/AA and not a light smoker | 22 (73) | 8 (27) |
| Not [(heavy smoker or NAT2 = rapid) and (heavy drinker or NAT1 = *10)] | 440 (51) | 432 (49) |
| [(Heavy smoker or NAT2 = rapid) and (heavy drinker or NAT1 = *10)] | 86 (65) | 46 (35) |
Discussion
In this large-scale case–control study, we examined the effect of genetic variations in carcinogen metabolism on the risk of PC associated with cigarette smoking and dietary mutagen intake. We found a significantly increased risk of PC associated with smoking and dietary mutagen intake in women and men, respectively. Furthermore, we observed a significant interaction of the NAT1 genotype with dietary mutagens in modification of the risk of PC among men. These are the first reported data to demonstrate a sex difference in susceptibility to dietary mutagen intake-related PC and in gene–diet interactions in modification of the risk of PC.
Previous epidemiological studies revealed a higher smoking-related relative risk of PC in women than in men (52,53). Also, Duell et al. (7) reported a significant interaction between the GSTT1-null genotype and heavy smoking in increasing the risk of PC in women but not men. We showed previously, in a smaller sample of the current study population, a stronger association between CYP1A2, NAT1/2 gene polymorphisms and smoking with PC in women than in men (5) and these results were reconfirmed in this study. These observations suggest the existence of hormonal or other gender-specific factors that modulate the risk of smoking-related PC. In the present study, we examined the effect of the phase II enzyme SULT1A1, which is also involved in hormone metabolism, on the risk of smoking-related PC. We found that the SULT1A1 Arg213His polymorphism did not have a significant main effect or interactive effect with smoking on the risk of PC. Thus, determining the mechanism responsible for the sex difference in susceptibility to smoking-related PC requires further investigation.
We have reported previously the association between dietary mutagen intake and PC risk that we observed in the present study population (23). Our new findings reported herein are the sex differences in susceptibility to dietary mutagen intake-related PC and the effects of genotype on PC risk modification. For undetermined reasons, we observed a higher PC risk related to dietary PhIP and BaP intake in men than in women, which is directly opposite to the trend in smoking, wherein we observed higher susceptibility to PC from cigarette smoking in women than in men. This observation is consistent with findings from a recent cohort study that total, red or high-temperature cooked meat intake was positively associated with PC in men but not women (54). A higher level of exposure to dietary mutagens or higher levels of iron in men or sex differences in susceptibility to such exposures were discussed as explanations to their observations (54). When we compared the pack-years of smoking and dietary mutagen intake separately in patients and controls, men consistently had a higher level of exposure than women in all parameters examined (data not shown). Thus, the association between dietary mutagen exposure and risk of PC in men could be related to a higher level of exposure in this group. In contrast, genetic differences in carcinogen metabolism rather than differences in the exposure level between men and women are more likely to be responsible for the sex differences in susceptibilities to smoking because women actually had lower level of exposure than men. However, we did not observe a sex difference in the distribution of the CYP1A2*1F, NAT1, NAT2 and SULT1A1 genotypes in patients of the current study (data not shown). Based on previously reported evidence regarding hormonal regulation of NAT expression in mammalian tissues (55), sex differences in dietary mutagen sensitivity may relate to different patterns of expression of the NAT1 gene in men and women. Other epidemiological studies of meat consumption that have examined sex-specific PC risk have not demonstrated clear sex differences (9,56–58). Thus, our observations must be confirmed in other study populations and for other genes involved in dietary mutagen metabolism.
Of the four genes examined in the present study, NAT1 had the most pronounced effect on the risk of PC in interaction with dietary mutagen intake. This result is understandable because NAT1 is the predominant NAT protein expressed in the human pancreas (31). Pancreas is different from any other digestive organs because it does not have direct contact with food carcinogens and all exposures are blood borne. In this case, the carcinogen metabolic capacity in the target tissue may play a more important role than the hepatic metabolism. Since NAT1*10 has been shown to confer a rapid acetylator phenotype (59), the increased risk of PC associated with this allele may be explained by a larger amount of reactive carcinogens activated by NAT1 in the target tissue. Our results do not support a significant role for the CYP1A2*1F, SULT1A1 and NAT2 genotype with dietary mutagen in modifying the risk of PC.
When multiple genetic and environmental factors were considered in a logic regression approach, we observed possible interactions of diabetes with SULT1A1 genotype and CYP1A2*1F genotype with smoking in modifying the risk of PC. In addition, heavy smoking, heavy drinking and NAT genotypes were also identified as significant contributors to the final risk model. In contrast, none of the mutagen exposure parameters were chosen by logic regression as the strongest predictors of PC. The relationship of diabetes and SULT1A1 genotype has not been reported previously. SULT enzymes catalyze the sulfate conjugation of many hormones, neurotransmitters, drugs and xenobiotic compounds. The SULT1A1 gene encodes one of the two phenol SULTs with thermostable enzyme activity. We speculate that the reduced enzyme activity conferred by the SULT1A1 variant alleles may render the pancreatic cells more susceptible to some unknown xenobiotics or hormones since neither smoking nor dietary mutagen exposure showed interaction with this genotype in modifying the risk of PC.
Our study had several limitations. First, it was a hospital-based study conducted in a single tertiary referral cancer center, so the data may not be applicable to the general population. Second, we restricted the genetic analysis to non-Hispanic white participants because of the small number of minorities enrolled in the study. Third, we did not consider information on body mass index or other dietary factors (e.g. intake of calories, fat, fruits and vegetables, etc.). Fourth, the assessment of exposure to dietary mutagen was limited to HCAs and PAHs. Although NOC exposure could modify the risk of PC via modulation of carcinogen metabolic enzymes or synergistic action with other carcinogens, the role of NOC exposure on the risk association was not considered in this study. Last but not least, dietary exposure to HCAs and PAHs was assessed using self-reported data on eating habits 1 year before the cancer diagnosis or control recruitment. This type of assessment did not consider the lifetime exposure durations or fluctuations. As the sample size increases in our ongoing study and a better study instrument is developed, some of these limitations may be overcome.
In this large hospital-based PC case–control study, we found significant interactions of the CYP1A2*1F and NAT1*10 genotypes with smoking among women and NAT1 genotype with dietary mutagen intake among men. We also showed a number of genetic and environmental factors that appear to be strong predictors of PC using a logic regression model. These results suggest mechanisms of pancreatic carcinogenesis but need to be confirmed in other study populations.
Acknowledgments
We thank Lisa Mathews, Amanda Franco, Nga Nguyen, Ping Chang and Yingqiu Du for their contributions in patient recruitment, data management and sample handling. We thank Mr. Donald R. Norwood for editing of the manuscript.
Funding
National Institutes of Health (CA98380 to D.L., CA034627 to D.W.H.); National Institute of Environmental Health Sciences Center (P30 ES07784); National Institutes of Health Cancer Center Core (CA16672); Texas Federation of Business and Professional Women to D.L.
Abbreviations
- AA
aromatic amine
- BaP
benzo[a]pyrene
- CI
confidence interval
- CYP
cytochrome P450
- DiMeIQx
2-amino-3,4,8-trimethylimida-zo[4,5-f]quinoxaline
- HCA
heterocyclic amine
- MeIQx
2-amino-3,8-dimethylimidazo[4,5-f]quinoxaline
- NAT
N-acetyltransferase
- NOC
N-nitroso compound
- OR
odds ratio
- PAH
polycyclic aromatic hydrocarbon
- PC
pancreatic cancer
- PCR
polymerase chain reaction
- PhIP
2-amino-1-methyl-6-phenylimidazo[4,5-b]pyridine
- SNP
single-nucleotide polymorphism
- SULT
sulfotransferase
Footnotes
The online version of this article has been published under an open access model. Users are entitled to use, reproduce, disseminate, or display the open access version of this article for non-commercial purposes provided that: the original authorship is properly and fully attributed; the Journal and Oxford University Press are attributed as the original place of publication with the correct citation details given; if an article is subsequently reproduced or disseminated not in its entirety but only in part or as a derivative work this must be clearly indicated. For commercial re-use, please contact journals.permissions@oxfordjournals.org
Conflict of Interest Statement: None declared.
References
- 1.American Cancer Society. Cancer Figures and Facts 2007. Atlanta: 2007. [Google Scholar]
- 2.Ahlgren JD. Epidemiology and risk factors in pancreatic cancer. Semin Oncol. 1996;23:241–250. [PubMed] [Google Scholar]
- 3.Brownson RC, et al. Epidemiology of environmental tobacco smoke exposure. Oncogene. 2002;21:7341–7348. doi: 10.1038/sj.onc.1205809. [DOI] [PubMed] [Google Scholar]
- 4.Lang NP, et al. Aromatic and heterocyclic amine metabolism and phenotyping in humans. Prog Clin Biol Res. 1991;372:33–47. [PubMed] [Google Scholar]
- 5.Li D, et al. Polymorphisms of cytochrome P4501A2 and N-acetyltransferase genes, smoking, and risk of pancreatic cancer. Carcinogenesis. 2006;27:103–111. doi: 10.1093/carcin/bgi171. [DOI] [PMC free article] [PubMed] [Google Scholar]
- 6.Jiao L, et al. Haplotype of N-acetyltransferase 1 and 2 and risk of pancreatic cancer. Cancer Epidemiol Biomarkers Prev. 2007;16:2379–2386. doi: 10.1158/1055-9965.EPI-06-0992. [DOI] [PMC free article] [PubMed] [Google Scholar]
- 7.Duell EJ, et al. A population-based, case–control study of polymorphisms in carcinogen-metabolizing genes, smoking, and pancreatic adenocarcinoma risk. J Natl Cancer Inst. 2002;94:297–306. doi: 10.1093/jnci/94.4.297. [DOI] [PubMed] [Google Scholar]
- 8.Anderson K, et al. Pancreatic cancer. In: Schottenfeld D, Fraumeni JF Jr, editors. Cancer Epidemiology and Prevention. Oxford University Press; New York, NY: 1996. pp. 725–771. [Google Scholar]
- 9.Ji BT, et al. Dietary factors and the risk of pancreatic cancer: a case-control study in Shanghai, China. Cancer Epidemiol Biomarkers Prev. 1995;4:885–893. [PubMed] [Google Scholar]
- 10.Ghadirian P, et al. Food habits and pancreatic cancer: a case-control study of the Francophone community in Montreal, Canada. Cancer Epidemiol Biomarkers Prev. 1995;4:895–899. [PubMed] [Google Scholar]
- 11.Knekt P, et al. Intake of fried meat and risk of cancer: a follow-up study in Finland. Int J Cancer. 1994;59:756–760. doi: 10.1002/ijc.2910590608. [DOI] [PubMed] [Google Scholar]
- 12.Skog K. Cooking procedures and food mutagens: a literature review. Food Chem Toxicol. 1993;31:655–675. doi: 10.1016/0278-6915(93)90049-5. [DOI] [PubMed] [Google Scholar]
- 13.Sugimura T, et al. Heterocyclic amines in cooked foods: candidates for causation of common cancers. J Natl Cancer Inst. 1994;86:2–4. doi: 10.1093/jnci/86.1.2. [DOI] [PubMed] [Google Scholar]
- 14.Risch HA. Etiology of pancreatic cancer, with a hypothesis concerning the role of N-nitroso compounds and excess gastric acidity. J Natl Cancer Inst. 2003;95:948–960. doi: 10.1093/jnci/95.13.948. [DOI] [PubMed] [Google Scholar]
- 15.Sugio K, et al. High yields of K-ras mutations in intraductal papillary mucinous tumors and invasive adenocarcinomas induced by N-nitroso(2-hydroxypropyl)(2-oxopropyl)amine in the pancreas of female Syrian hamsters. Carcinogenesis. 1996;17:303–309. doi: 10.1093/carcin/17.2.303. [DOI] [PubMed] [Google Scholar]
- 16.IARC. IARC Monographs on the Evaluation of Carcinogenic Risk of Chemicals to Humans. Lyon: IARC; 1993. Some naturally occurring substances: food items and constituents, heterocyclic aromatic amines, and mycotoxins; p. 571. [Google Scholar]
- 17.Sugimura T, et al. Heterocyclic amines: new mutagens and carcinogens in cooked foods. Adv Exp Med Biol. 1991;283:569–78. doi: 10.1007/978-1-4684-5877-0_72. [DOI] [PubMed] [Google Scholar]
- 18.Yoshimoto M, et al. Carcinogenicity of heterocyclic amines for the pancreatic duct epithelium in hamsters. Cancer Lett. 1999;143:235–239. doi: 10.1016/s0304-3835(99)00131-7. [DOI] [PubMed] [Google Scholar]
- 19.Tamano S, et al. Carcinogenicity of a mutagenic compound from food, 2-amino-3-methyl-9H-pyrido[2,3-b]indole (MeAaC), in male F344 rats. Carcinogenesis. 1994;15:2009–2015. doi: 10.1093/carcin/15.9.2009. [DOI] [PubMed] [Google Scholar]
- 20.Howard JW, et al. Analytical methodology and reported findings of polycyclic aromatic hydrocarbons in foods. J Assoc Off Anal Chem. 1980;63:1077–1104. [PubMed] [Google Scholar]
- 21.Triolo AJ, et al. Induction of aryl hydrocarbon hydroxylase and forestomach tumors by benzo(a)pyrene. Cancer Res. 1977;37:3018–3021. [PubMed] [Google Scholar]
- 22.Anderson KE, et al. Dietary intake of heterocyclicamines and benzo(a)pyrene: associations with pancreatic cancer. Cancer Epidemiol Biomarkers Prev. 2005;14:2261–2265. doi: 10.1158/1055-9965.EPI-04-0514. [DOI] [PubMed] [Google Scholar]
- 23.Li D, et al. Dietary mutagen exposure and risk of pancreatic cancer. Cancer Epidemiol Biomarkers Prev. 2007;16:655–661. doi: 10.1158/1055-9965.EPI-06-0993. [DOI] [PMC free article] [PubMed] [Google Scholar]
- 24.Eaton DL, et al. Role of cytochrome P4501A2 in chemical carcinogenesis: implications for human variability in expression and enzyme activity. Pharmacogenetics. 1995;5:259–274. doi: 10.1097/00008571-199510000-00001. [DOI] [PubMed] [Google Scholar]
- 25.Glatt HR. Sulfation and sulfotransferases. IV Bioactivation of mutagens via sulfation. FASEB J. 1997;11:314–321. doi: 10.1096/fasebj.11.5.9141497. [DOI] [PubMed] [Google Scholar]
- 26.Lewis AJ, et al. Bioactivation of the cooked food mutagen N-hydroxy-2-amino-1-methyl-6-phenylimidazo[4,5-b]pyridine by estrogen sulfotransferase in cultured human mammary epithelial cells. Carcinogenesis. 1998;19:2049–2053. doi: 10.1093/carcin/19.11.2049. [DOI] [PubMed] [Google Scholar]
- 27.Miller JA. Sulfonation in chemical carcinogenesis: history and present status. Chem Biol Interact. 1994;92:329–341. doi: 10.1016/0009-2797(94)90074-4. [DOI] [PubMed] [Google Scholar]
- 28.Butler MA, et al. Human cytochrome P-450PA (P-450IA2), the phenacetin O-deethylase, is primarily responsible for the hepatic 3-demethylation of caffeine and N-oxidation of carcinogenic arylamines. Proc Natl Acad Sci USA. 1989;86:7696–7700. doi: 10.1073/pnas.86.20.7696. [DOI] [PMC free article] [PubMed] [Google Scholar]
- 29.Kato R, et al. Metabolic activation and covalent binding to nucleic acids of carcinogenic heterocyclic amines from cooked foods and amino acid pyrolysates. Jpn J Cancer Res. 1987;78:297–311. [PubMed] [Google Scholar]
- 30.Sachse C, et al. Colorectal Cancer Study Group. Polymorphisms in the cytochrome P450 CYP1A2 gene (CYP1A2) in colorectal cancer patients and controls: allele frequencies, linkage disequilibrium and influence on caffeine metabolism. Br J Clin Pharmacol. 2003;55:68–76. doi: 10.1046/j.1365-2125.2003.01733.x. [DOI] [PMC free article] [PubMed] [Google Scholar]
- 31.Anderson KE, et al. Metabolic activation of aromatic amines by human pancreas. Carcinogenesis. 1997;18:1085–1092. doi: 10.1093/carcin/18.5.1085. [DOI] [PubMed] [Google Scholar]
- 32.Hickman D, et al. Expression of arylamine N-acetyltransferase in human intestine. Gut. 1998;42:402–409. doi: 10.1136/gut.42.3.402. [DOI] [PMC free article] [PubMed] [Google Scholar]
- 33.Husain A, et al. Identification of N-acetyltransferase 2 (NAT2) transcription start sites and quantitation of NAT2-specific mRNA in human tissues. Drug Metab Dispos. 2007;35:721–727. doi: 10.1124/dmd.106.014621. [DOI] [PMC free article] [PubMed] [Google Scholar]
- 34.Hein DW. Molecular genetics and function of NAT1 and NAT2: role in aromatic amine metabolism and carcinogenesis. Mutat Res. 2002;30:506–507. 65–77. doi: 10.1016/s0027-5107(02)00153-7. [DOI] [PubMed] [Google Scholar]
- 35.Hein DW, et al. Update on consensus N-acetyltransferase gene nomenclature. Pharmacogenetics. 2000;10:291–292. doi: 10.1097/00008571-200006000-00002. [DOI] [PubMed] [Google Scholar]
- 36.Hirvonen A. Polymorphic NATs and cancer predisposition. IARC Sci Publ. 1999:251–270. [PubMed] [Google Scholar]
- 37.Hein DW, et al. Molecular genetics and epidemiology of the NAT1 and NAT2 acetylation polymorphisms. Cancer Epidemiol Biomarkers Prev. 2000;9:29–42. [PubMed] [Google Scholar]
- 38.Hengstler JG, et al. Polymorphisms of N-acetyltransferases, glutathione S-transferases, microsomal epoxide hydrolase and sulfotransferases: influence on cancer susceptibility. Recent Results Cancer Res. 1998;154:47–85. doi: 10.1007/978-3-642-46870-4_4. [DOI] [PubMed] [Google Scholar]
- 39.Engelke CE, et al. Association between functional genetic polymorphisms of human sulfotransferases 1A1 and 1A2. Pharmacogenetics. 2000;10:163–169. doi: 10.1097/00008571-200003000-00008. [DOI] [PubMed] [Google Scholar]
- 40.Raftogianis RB, et al. Phenol sulfotransferase pharmacogenetics in humans: association of common SULT1A1 alleles with TS PST phenotype. Biochem Biophys Res Commun. 1997;239:298–304. doi: 10.1006/bbrc.1997.7466. [DOI] [PubMed] [Google Scholar]
- 41.Steiner M, et al. Phenol sulphotransferase SULT1A1 polymorphism in prostate cancer: lack of association. Arch Toxicol. 2000;74:222–225. doi: 10.1007/s002040000118. [DOI] [PubMed] [Google Scholar]
- 42.Sachse C, et al. Colorectal Cancer Study Group. A pharmacogenetic study to investigate the role of dietary carcinogens in the etiology of colorectal cancer. Carcinogenesis. 2002;23:1839–1849. doi: 10.1093/carcin/23.11.1839. [DOI] [PubMed] [Google Scholar]
- 43.Wang Y, et al. Sulfotransferase (SULT) 1A1 polymorphism as a predisposition factor for lung cancer: a case-control analysis. Lung Cancer. 2002;35:137–142. doi: 10.1016/s0169-5002(01)00406-8. [DOI] [PubMed] [Google Scholar]
- 44.Saintot M, et al. Interactions between genetic polymorphism of cytochrome P450-1B1, sulfotransferase 1A1, catechol-o-methyltransferase and tobacco exposure in breast cancer risk. Int J Cancer. 2003;107:652–657. doi: 10.1002/ijc.11432. [DOI] [PubMed] [Google Scholar]
- 45.Zheng L, et al. Sulfotransferase 1A1 (SULT1A1) polymorphism and bladder cancer risk: a case-control study. Cancer Lett. 2003;202:61–69. doi: 10.1016/j.canlet.2003.08.007. [DOI] [PubMed] [Google Scholar]
- 46.Wu MT, et al. SULT1A1 polymorphism and esophageal cancer in males. Int J Cancer. 2003;103:101–104. doi: 10.1002/ijc.10805. [DOI] [PubMed] [Google Scholar]
- 47.Knize MG, et al. Food heating and the formation of heterocyclic aromatic amine and polycyclic aromatic hydrocarbon mutagens/carcinogens. Adv Exp Med Biol. 1999;459:179–193. doi: 10.1007/978-1-4615-4853-9_12. [DOI] [PubMed] [Google Scholar]
- 48.Livak KJ. Allelic discrimination using fluorogenic probes and the 5′ nuclease assay. Genet Anal. 1999;14:143–149. doi: 10.1016/s1050-3862(98)00019-9. [DOI] [PubMed] [Google Scholar]
- 49.Doll MA, et al. Comprehensive human NAT2 genotype method using single nucleotide polymorphism-specific polymerase chain reaction primers and fluorogenic probes. Anal Biochem. 2001;288:106–108. doi: 10.1006/abio.2000.4892. [DOI] [PubMed] [Google Scholar]
- 50.Doll MA, et al. Rapid genotype method to distinguish frequent and/ or functional polymorphisms in human N-acetyltransferase-1. Anal Biochem. 2002;301:328–332. doi: 10.1006/abio.2001.5520. [DOI] [PubMed] [Google Scholar]
- 51.Ruczinski I, et al. Logic regression. J Comput Graph Stat. 2003;12:475–511. [Google Scholar]
- 52.Muscat JE, et al. Smoking and pancreatic cancer in men and women. Cancer Epidemiol Biomarkers Prev. 1997;6:15–19. [PubMed] [Google Scholar]
- 53.Nilsen TI, et al. A prospective study of lifestyle factors and the risk of pancreatic cancer in Nord-Trondelag, Norway. Cancer Causes Control. 2000;11:645–652. doi: 10.1023/a:1008916123357. [DOI] [PubMed] [Google Scholar]
- 54.Stolzenberg-Solomon RZ, et al. Meat and meat-mutagen intake and pancreatic cancer risk in the NIH-AARP cohort. Cancer Epidemiol Biomarkers Prev. 2007;16:2664–2675. doi: 10.1158/1055-9965.EPI-07-0378. [DOI] [PubMed] [Google Scholar]
- 55.Estrada-Rodgers L, et al. Characterization of a hormone response element in the mouse N-acetyltransferase 2 (Nat2) promoter. Gene Expr. 1998;7:13–24. [PMC free article] [PubMed] [Google Scholar]
- 56.Coughlin SS, et al. Predictors of pancreatic cancer mortality among a large cohort of United States adults. Cancer Causes Control. 2000;11:915–923. doi: 10.1023/a:1026580131793. [DOI] [PubMed] [Google Scholar]
- 57.Silverman DT, et al. Dietary and nutritional factors and pancreatic cancer: a case-control study based on direct interviews. J Natl Cancer Inst. 1998;90:1710–1719. doi: 10.1093/jnci/90.22.1710. [DOI] [PubMed] [Google Scholar]
- 58.Larsson SC, et al. Meat, fish, poultry and egg consumption in relation to risk of pancreatic cancer: a prospective study. Int J Cancer. 2006;118:2866–2870. doi: 10.1002/ijc.21732. [DOI] [PubMed] [Google Scholar]
- 59.Hein DW, et al. Pharmacogenetics of the arylamine N-acetyltransferases: a symposium in honor of Wendell W. Weber. Drug Metab Dispos. 2000;28:1425–1432. [PubMed] [Google Scholar]