Abstract
Laboratory scale to industrial scale purification of biomolecules from cell culture supernatants and lysed cell solutions can be accomplished using affinity chromatography. While affinity chromatography using porous protein A agarose beads packed in columns is arguably the most common method of laboratory scale isolation of antibodies and recombinant proteins expressing Fc fragments of IgG, it can be a time consuming and expensive process. Time and financial constraints are especially daunting in small basic science labs that must recover hundreds of micrograms to milligram quantities of protein from dilute solutions, yet lack access to high pressure liquid delivery systems and/or personnel with expertise in bioseparations. Moreover, product quantification and characterization may also excessively lengthen processing time over several workdays and inflate expenses (consumables, wages, etc.). Therefore, a fast, inexpensive, yet effective protocol is needed for laboratory scale isolation and characterization of antibodies and other proteins possessing an Fc fragment. To this end, we have devised a protocol that can be completed by limited-experience technical staff in less than 9 hours (roughly one workday) and as quickly as 4 hours, as opposed to traditional methods that demand 20+ work hours. Most required equipment is readily available in standard biomedical science, biochemistry, and (bio)chemical engineering labs, and all reagents are commercially available. To demonstrate this protocol, representative results are presented in which chimeric murine galectin-1 fused to human Fc (Gal-1hFc) from cell culture supernatant was isolated using a protein A membrane adsorber. Purified Gal-1hFc was quantified using an expedited Western blotting analysis procedure and characterized using flow cytometry. The streamlined workflow can be modified for other Fc-expressing proteins, such as antibodies, and/or altered to incorporate alternative quantification and characterization methods.
Keywords: affinity chromatography, membrane adsorber, bioseparations, protein A, galectin-1, Gal-1hFc
INTRODUCTION
Isolation of antibodies and recombinant proteins expressing immunoglobulin G (IgG) Fc fragments from cell culture supernatants and dilute lysed cell solutions can be accomplished using protein A affinity chromatography. In basic science and engineering laboratories and industry, columns packed with porous protein A-coated agarose, glass, or polymeric beads are most commonly used for affinity chromatography, despite high financial costs and long processing times1–3. It is well-appreciated that affinity chromatography represents the largest expense and processing bottleneck in both lab and industrial settings2,4. As a result, numerous improvements have been developed to decrease cost and processing time without sacrificing overall product recovery from the process train1,2,5–7. Particularly promising for the isolation of antibodies and other Fc-expressing proteins is affinity chromatography using a protein A membrane adsorber2,5,7–10. Whereas Fc capture in column chromatography is diffusion-limited (i.e., the Fc-expressing protein must diffuse into and through internal pores to reach the majority of the protein A) with high pressure drop across the column, mass transport in membrane adsorbers is driven by bulk convection, resulting in avoidance of diffusion limitations8,9,11,12. In addition, pressure drop across the membrane adsorber is low, thereby permitting faster perfusion flow rates compared to bead-packed columns8,9,11,12. Thus, for laboratory scale isolation, membrane chromatography is predicted to reduce isolation time by several hours and increase product capture compared to column chromatography. Furthermore, mathematical models for IgG adsorption in membrane adsorbers have been proposed8,9,11,12, thus allowing end-users to predict performance in the lab.
Another bottleneck in basic science and engineering laboratories is the characterization of the Fc-expressing protein. However, selection of appropriate methods to complete characterization assays, such Western blots, can greatly reduce time spent on product testing. For instance, semi-dry transfer in a discontinuous buffer system can accomplish electrophoretic transfer of proteins from an SDS-PAGE gel to a polyvinyl difluoridine (PVDF) membrane in a matter of minutes, as opposed to 1–2 hours in tank (wet) transfer in a continuous buffer system13.
A rapid, inexpensive, and effective protocol to isolate and characterize a chimeric fusion protein expressing an Fc fragment of human IgG is described herein. Most equipment is readily available in standard basic biomedical science, biology, chemistry, and (bio)chemical engineering labs, and all reagents are commercially available. Although representative results were generated from the isolation and characterization of a murine galectin-1/human Fc chimeric fusion protein (Gal-1hFc), the streamlined protocol can be applied to the isolation of other molecules that possess an Fc fragment, such as antibodies, Fc fragments themselves, or other Fc fusion proteins. Our improvements dramatically decreased processing time (as few as 4 hours but more typically ~9 hours, compared to 20+ work hours) while achieving similar or improved product recovery compared to standard methods.
PROTOCOL
Verify that the Fc-expressing protein (recombinant fusion protein or IgG antibody, heretofore referred to as “protein”) has acceptable affinity for protein A14–17 prior to using the protein A membrane adsorber, and test for the presence of the protein in the stock solution (e.g., cell culture supernatant clarified by centrifugation at 1000 × g for 5 min to pellet suspended cells). Use flow cytometry, Western blotting, ELISA, etc., to detect protein function and/or presence of Fc, based on lab preference. Ideally, quantify the protein in the cell culture supernatant (step 6) to avoid exceeding protein A membrane adsorber capacity. Proceed if protein is detected.
-
Prepare protein A membrane adsorber and cell culture supernatant.
-
2.1)
Follow the manufacturer's instructions for preparing the membrane adsorber. Never let air enter the membrane adsorber. All solutions perfused through the membrane adsorber should be at room temperature and pre-filtered using a 0.22 μm filter. Fill a 10 ml syringe with 0.22 μm-filtered Dulbecco's phosphate buffered saline (DPBS) or buffer of choice, and discharge air bubbles. Perfuse DPBS to remove the storage solution and to equilibrate the membrane adsorber immediately before use.
-
2.2)
Filter the cell culture supernatant immediately before perfusion through the membrane adsorber, using a vacuum-driven 0.22 μm sterile filtration unit.
-
2.1)
-
Load the protein A membrane adsorber.
-
3.1)
Aspirate cell culture supernatant into a Luer Lock syringe (30 ml or larger), and discharge any air bubbles.
-
3.2)
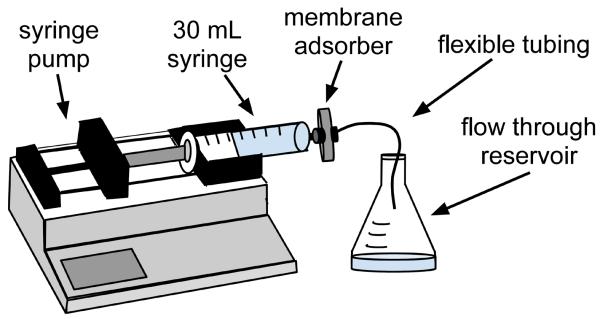
Assemble materials and equipment as shown in Figure 1. Connect the syringe to the inlet of the membrane adsorber. Attach flexible tubing to the membrane adsorber outlet. If desired, place a 0.22 μm syringe filter between the syringe and the membrane adsorber. Use a flask or bottle to catch flow through (also known as filtrate), from the adsorber.
-
3.3)
Set the syringe pump to the desired volumetric flow rate, but do not exceed the manufacturer's recommended flow rate (e.g., 10 ml/min). Perfuse the cell culture supernatant through the membrane adsorber, collecting flow through in a beaker or other container. Reload the syringe with supernatant as needed.
-
3.4)
If desired, test the flow through for the presence of protein using flow cytometry, Western blotting, ELISA, etc., based on lab preference. It is typically unnecessary to re-perfuse the flow through.
-
3.1)
-
Elute protein from the membrane adsorber.
-
4.1)
Wash the membrane adsorber with 10 ml DPBS to remove any non-bound protein.
-
4.2)
Elute protein from the membrane adsorber at the desired flow rate (e.g., 1 ml/min) using 10–15 ml of elution buffer (e.g., amine-based elution buffer (pH 2.8)). Catch eluate in a tube containing neutralizing buffer (e.g., 1 M Tris (pH 9.4)) at 10% of elution volume (1.0–1.5 ml).
-
4.3)
Alternatively, elute protein in one ml increments into tubes containing 100 μl of neutralization buffer, using a total volume of 10–15 ml elution buffer. Use the preferred characterization method to test each fraction for the presence of protein.
-
4.4)
Regenerate the membrane adsorber according to the manufacturer's instructions. Perfuse 10 ml of 0.22 μm-filtered DPBS or buffer of choice, then 10 ml of 0.22 μm-filtered 50 mM NaOH in 1 N NaCl, and finally 10 ml of 0.22 μm-filtered DPBS. Fill the membrane adsorber with 20% ethanol in DPBS for long-term storage at 4°C.
-
4.1)
-
Concentrate and dialyze the protein.
-
5.1)
Deposit all eluate (or elution fractions containing protein as determined in step 4.3) in a 10 kDa molecular weight cut-off centrifugal filter unit. Follow the manufacturer's instructions for centrifugation.
-
5.2)
Dialyze the retentate in a small volume dialysis unit (10 kDa molecular weight cut-off) against the buffer of choice, following the manufacturer's instructions. Buffer may need to be added to dialyzed material if protein precipitation is a concern. If desired, the dialyzed material can be refrigerated until step 6 can be performed, but long term storage without preservatives is not recommended.
-
5.1)
-
Quantify and characterize purified product in an expedited Western blotting procedure.
-
6.1)
Resolve purified protein and Fc standards on the gel of choice by SDS-PAGE, under reducing or non-reducing conditions as desired18–20. Use a mini gel rather than midi gel to minimize run time.
-
6.1.1)
If not already known, determine the Fc standards range over which band signal varies linearly with respect to quantity of loaded (e.g., 0.1 μg to 1 μg). Use the same gel, running conditions, transfer conditions, and reagents that will be used to quantify and characterize purified protein.
-
6.1.2)
Load multiple sample amounts of purified protein, including samples diluted with DPBS, to ensure that the purified protein band signals are within the linear signal range of Fc standards in image analysis.
-
6.1.1)
-
6.2)
Transfer proteins from the gel to a polyvinylidene fluoride (PVDF) membrane in a discontinuous buffer system using a semi-dry blotter13, following the blotter manufacturer's instructions. Transfer time is typically 5–10 min. If desired, Coomassie stain the gel after transfer to verify transfer efficiency21.
-
6.3)
Perform immunoblotting with anti-Fc or anti-IgG conjugated to alkaline phosphatase (AP) or horse radish peroxidase (HRP), based on lab preference, using a vacuum-assisted protein detection system. Immunoblotting time is typically less than 1 hr.
-
6.4)
Develop immunoblot using the substrate and method of choice (e.g., AP substrate and enhanced chemiluminecence).
-
6.5)
Quantify purified protein by image analysis. Perform a linear regression on the band signals from Fc standards. If R2>0.90, use the equation for the line to calculate protein quantity from its band signal(s). Account for sample dilution if necessary. Since quantification of the protein is performed on the basis of Fc, adjust the value for molecular weight differences between the protein and Fc. If R2<0.90, repeat step 6 in its entirety.
-
6.1)
Validate protein using functional assays or methods to detect Fc via flow cytometry, Western blotting, ELISA, etc., based on lab preference.
Dilute protein to desired concentration and/or add any desired preservatives or stabilizers to the purified protein solution before aliquoting for long-term storage, frozen or otherwise.
Figure 1. Schematic of the experimental apparatus.
Antibodies and recombinant fusion proteins expressing Fc fragments of IgG can be isolated from dilute solutions using a protein A membrane adsorber. The membrane adsorber is connected through a Luer Lock fitting to a 30 ml syringe on a syringe pump, which perfuses the protein-containing solution through the membrane adsorber at a desired volumetric flow rate.
REPRESENTATIVE RESULTS
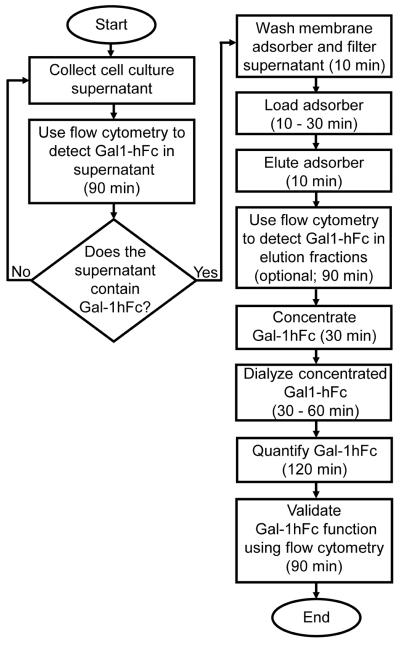
The streamlined protocol for isolation and characterization of Fc-expressing proteins is routinely used to process chimeric murine galectin-1 fused to human Fc (Gal-1hFc) from dilute cell culture supernatants. The flowchart in Figure 2 illustrates the workflow and time for each step in the protocol. For a typical batch of 300 ml of supernatant, the total processing time is approximately 9 hours when the optional flow cytometry testing of elution fractions is performed. If all flow cytometry analysis is omitted, due to lack of a flow cytometer or individual lab preference, total processing time can be as brief as 4 hours. In general, processing time depends on operator experience, amount of supernatant processed, and which quantification and characterization methods are performed.
Figure 2. Process workflow for the isolation of Gal-1hFc from cell culture supernatant.
This flowchart illustrates the protocol for the isolation and characterization of a chimeric murine galectin-1/human Fc-expressing fusion protein (Gal-1hFc) from cell culture supernatant. In general, processing time will vary depending on operator experience, amount of supernatant processed, and which quantification and characterization methods are used.
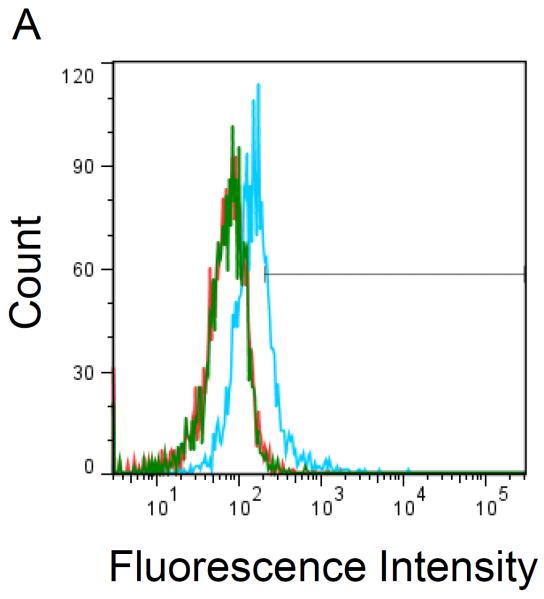
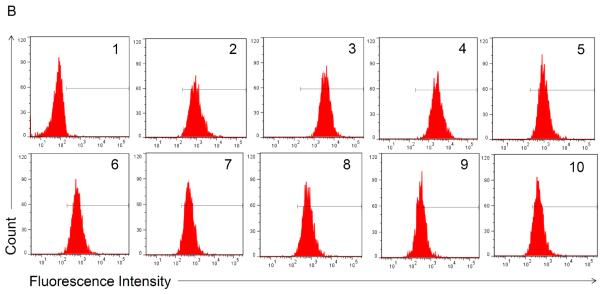
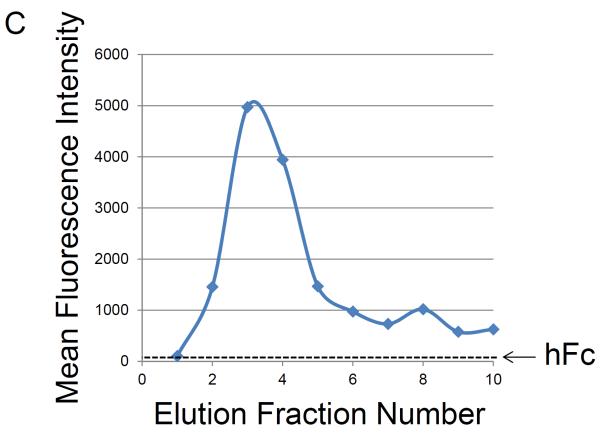
Flow cytometry was used to test for the presence of functional Gal-1hFc (i.e., Gal-1 able to detect its ligands on breast cancer cells) in the starting cell culture supernatant; fresh cell culture medium served as the negative control18,22. Once Gal-1hFc in the cell culture supernatant was verified (Figure 3A), loading of the protein A membrane adsorber was accomplished by supernatant perfusion at 10 ml/min (resulting in superficial velocity or volumetric flux of 0.5 cm/min in a 2 ml membrane adsorber) using a syringe pump (Figure 1). The membrane adsorber efficiently captured and retained Gal-1hFc, leaving the flow through essentially depleted of Gal-1hFc (lack of breakthrough, Figure 3A). Gal-1hFc was eluted from the membrane adsorber in one milliliter increments at 1 ml/min (volumetric flux = 0.05 cm/min) using an amine-based acidic buffer (pH 2.8), and neutralized elution fractions were subsequently tested for the presence of functional Gal-1hFc using flow cytometry (Figure 3B). Gal-1hFc signal sequentially increased from elution 1 (approximately equal to negative control) to a maximum at elution 4, then decreased to a nearly constant level at elutions 9 and 10 (Figure 3B and 3C). The final elution 10 did not reach equivalence to the negative control signal due to some adsorber retention of Gal-1hFc (Figure 3B and 3C). However, this loss was deemed acceptable. As an alternative method to test for presence, but not function, of Gal-1hFc in various solutions, flow cytometry analysis of Gal-1hFc's ability to bind to protein A polystyrene beads (through recognition of the hFc region) can be used (Figure 3D).
Figure 3. Flow cytometry analysis of Gal-1hFc-containing solutions.
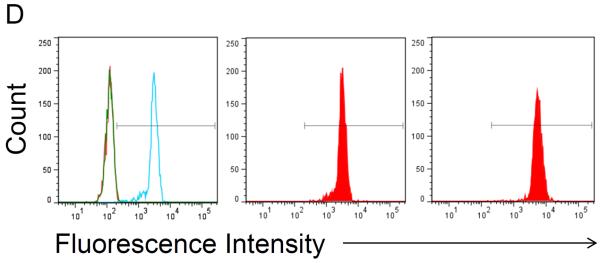
Flow cytometry is used to assess whether functional Gal-1hFc is present in fresh cell culture medium, cell culture supernatant, membrane adsorber flow through, and elution fractions. APC-conjugated F(ab')2 anti-human Fc was used as the secondary antibody. All data were acquired using a FACSAria Special Order Research Product flow cytometer/sorter and analyzed using FlowJo software. Markers in each histogram represent 2% of negative control population (i.e., fresh cell culture medium for (A) and hFc isotype for (B)). (A) Flow cytometry histogram overlay of BT-20 breast cancer cells labeled with fresh cell culture medium (red), cell culture supernatant (blue), or membrane adsorber flow through (green). Cell culture supernatant contained a low level of functional Gal-1hFc that successfully bound to galectin-1 ligands on BT-20 cells, while the fresh cell culture medium and membrane adsorber flow through lacked Gal-1hFc, as expected. (B) Flow cytometry histograms of BT-20 cells labeled with elution fractions from the membrane adsorber. Gal-1hFc signal on the BT-20 cells sequentially increases to a maximum at elution 4 then decreases, although not to background level (i.e., signal equivalent to fresh cell culture medium). (C) The mean fluorescence intensities of the samples in (B) can also be plotted as a function of elution fraction number to generate an elution curve. The mean fluorescence intensity of cells labeled with hFc isotype control is shown as a reference line. (D) Alternatively, flow cytometry analysis of Gal-1hFc bound to protein A polystyrene beads can be used to test for protein presence, but not function, in various solutions. APC-conjugated F(ab')2 anti-human Fc was used as the secondary antibody. Left: Flow cytometry histogram overlay of fresh cell culture medium (red), cell culture supernatant (blue), and blank buffer sample (green). Middle: Histogram of hFc isotype control. Incubation with 10 μg/ml hFc is a positive control for protein A capture. Right panel: Histogram of protein A beads incubated with purified Gal-1hFc, on the basis of 10 μg hFc/ml.
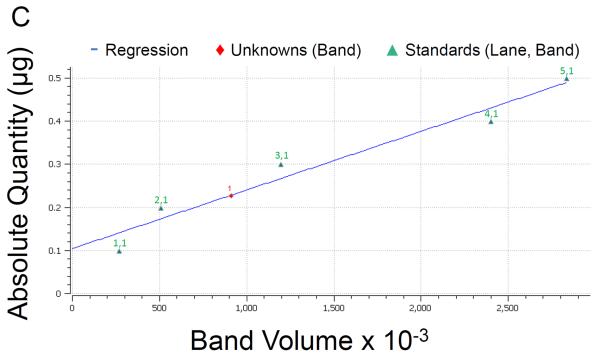
Following elution fraction testing, Gal-1hFc-positive elutions 2 through 10 were concentrated and then dialyzed against DPBS to obtain purified Gal-1hFc in the desired buffer. Quantification and characterization of the purified Gal-1hFc was performed in a Western blotting procedure expedited by semi-dry transfer and vacuum-assisted immunoblotting. By comparing Gal-1hFc signal to hFc quantification standards, both the quantity and quality of purified material were determined (Figure 4A–C). Signal intensities of hFc standard bands (one band at ~25 kDa each in Figure 4A, lanes 1–5) were linearly related to the quantity of hFc present (Figure 4C). Gal-1hFc (one band at ~40 kDa in Figure 4A, lane 6) and degraded Gal-1hFc (one band at ~40 kDa and one band at ~25 kDa in Figure 4A, lane 7) signals were within the standards range (Figure 4A, lanes 1–5). The concentration of purified Gal-1hFc (Figure 4A, lane 6) on the basis of hFc was determined to be 450 μg/ml by image processing (Figure 4C). Adjusting for the molecular weight of Gal-1hFc, the concentration of the purified material was 720 μg/ml. In contrast, too much purified Gal-1hFc was loaded in lanes 6 and 7 of the Western in Figure 4B, which generated signals that saturated or exceeded the hFc standards range, thereby preventing quantification. Alternative to Western blotting, Coomassie gel staining21 can serve as a rapid quality control check and/or quantification method (Figure 4D). Note that a band ~10 kDa, in addition to bands and ~25 kDa and ~40 kDa, was present in the degraded Gal-1hFc sample (Figure 4D, lane 2). This band is degraded Gal-1hFc that was non-reactive with the detection antibody used in Western blots (Figure 4AB).
Figure 4. Quantification and characterization of Gal-1hFc using Western blotting and image analysis.


(A) Lanes 1–5 are hFc standards of 0.1–0.5 μg in 0.1 μg increments, and lanes 6 and 7 are purified Gal-1hFc from two different production lots. Samples were resolved on a 4–15% TGX gel by SDS-PAGE under reducing conditions, then transferred to PVDF membrane using discontinuous transfer conditions. The membrane was blocked and incubated with anti-hIgG-AP using a vacuum-assisted immunoblotting technique. Signals were developed with ECL reagent and visualized on a Bio-Rad ChemiDoc XRS imager. Signals for hFc standards in lanes 1–5 varied linearly (plotted in (C)), and the signals for the two purified Gal-1hFc samples in lanes 6 and 7 were within the linear measurement range. Lane 7 shows two bands, Gal-1hFc and presumably hFc fragment, indicating degradation of the protein. (B) If too much purified Gal-1hFc is loaded, the signal may saturate or exceed the linear signal range, preventing quantification (lanes 6 and 7). Lanes, gel, and running conditions are the same as in (A). (C) Image Lab analysis software allows the input of known absolute quantities of hFc standards from an immunoblot, then determines the quantity of the unknown band(s) through its signal relative to the linear regression of standards (y = 1.36×10⁻⁷*x + 0.105; R2 = 0.95). Data shown are from the analysis of the immunoblot in (A). (D) Quality of purified Gal-1hFc can be assessed using Coomasie staining. Lane M is a molecular weight marker, lane 1 is purified Gal-1hFc (same sample as lane 6 in (A) and (B)), lane 2 is degraded Gal-1hFc (same sample as lane 7 in (A) and (B)), and lane 3 is 0.2 μg hFc standard. Gel and running conditions were the same as in (A) and (B).
After quantification and final characterization of the purified Gal-1hFc, sterile BSA was added to achieve a final BSA concentration of 0.5%. The purified material was then aliquoted and stored at −20°C. In addition to Gal-1hFc, we have used this streamlined protocol to isolate double mutant Gal-1hFc and Gal-7hFc. It can also be extended to practically any molecule that possesses an Fc fragment (antibodies, Fc fragments themselves, other Fc fusion proteins, etc. of species and isotypes that have affinity for protein A14–17).
DISCUSSION
The protocol described herein was developed to rapidly isolate and characterize a chimeric fusion protein expressing human Fc (Gal-1hFc), without significantly compromising product recovery or inflating cost. The key components of the streamlined workflow are a protein A membrane adsorber for isolation, and semi-dry transfer and vacuum-assisted immunoblotting for characterization by Western blotting.
The dramatic decrease in processing time for isolation and characterization of Gal-1hFc from 300 ml of cell culture supernatant (approximately 9 hours in the streamlined protocol compared to 20+ hours in a traditional protocol) is largely attributable to incorporation of the aforementioned key components, particularly the membrane adsorber. At the maximum recommended flow rate of 10 ml supernatant/min, membrane adsorber loading can be completed in 30 minutes. Gal-1hFc recovery from protein A membrane adsorbers typically range from 10% to 30% in our labs, with ~30% recovery routinely achieved by experienced lab personnel when Gal-1hFc concentrations in cell culture supernatant are 5–10 μg/ml. At most, ~50% recovery has been achieved. Complete product recovery is virtually impossible due to inherent losses due to (a) specific retention of Fc-expressing protein by protein A on the membrane adsorber (Figure 3B and 3C) and (b) non-specific surface adsorption of the protein throughout isolation. It is important for individual labs to determine if product recovery with a membrane adsorber is acceptable based on their needs; if altering loading flow rate or feedstock content (e.g., desired protein cell concentration culture supernatant, which may be particularly difficult) can improve product recovery8, or if modification of the elution protocol (step 4) to obtain higher recovery is worth the increased time, expense, and effort, or the possible harm to the protein or membrane adsorber itself (primarily by elution buffer pH, salt concentration, etc.). In contrast to using the membrane adsorber, it takes approximately 10 hours to perform two perfusion cycles through a 1 ml protein A bead-packed column18 at the maximum tolerable flow rate of 1 ml/min, and only 10–20% Gal-1hFc is typically recovered. As a final concern, a cost analysis for protein A beads from different manufacturers may affect the decision to use a standard bead-packed column versus a single membrane adsorber. Taking all of these factors into consideration, the use of a membrane adsorber for laboratory scale isolation of Fc-expressing proteins may offer small laboratories significant advantages over column chromatography2,5,8,10.
Use of a mini gel for SDS-PAGE, semi-dry discontinuous electrophoretic transfer of proteins from the gel to PVDF membrane, and vacuum-assisted immunoblotting offer significant time savings compared to midi gels, tank (wet) transfer, and diffusion-based immunostaining for quantification and characterization of Gal-1hFc (2 hours versus 8 hours). Individual labs must determine whether the expedited Western protocol is appropriate for quantification and characterization of their protein. Benefits include (a) short time to completion even by inexperienced lab personnel, (b) ability to determine whether the protein is intact or has degraded due to processing or contamination (Figure 4B), and (c) relative ease of quantification by image processing programs (Figure 4C). However, (a) increased reagents and consumables costs may be unacceptable despite the time offset for wages, (b) traditional protein quantification by A280, ELISA, Bradford assay, or BCA assay may be preferred23–27, or (c) labs may not have access to a semi-dry blotter or a vacuum-assisted protein detection system for immunoblotting. In such cases, Coomassie staining of SDS-PAGE resolved proteins21 (Figure 4D) or dot or slot blotting28 are good alternatives.
Flow cytometry was used in three separate 90-min tests for detection of functional Gal-1hFc in this streamlined protocol (Figure 2), which is the same as in traditional processing18,22. Any other characterization method such as Western blotting or ELISA would also be acceptable. Functional assays are optimal (e.g., detection of galectin-1 ligands on breast cancer cells, Figure 3A–C). Alternatively, detection of the Fc unit would be acceptable (similar to Figure 3D), but retention of the protein's specific function cannot be determined in this manner, which is a potentially significant drawback.
The methods described herein have been used for the rapid laboratory scale isolation and characterization of a chimeric fusion protein expressing human Fc (Gal-1hFc). This streamlined workflow can be applied to the isolation of practically any molecule that possesses an Fc fragment (IgG antibodies, other Fc fusion proteins, Fc fragments themselves, etc.) and can be readily modified based on individual lab preferences. In addition, this protocol is relatively fast and easy, even for limited-experience or completely inexperienced lab personnel, making it suitable for use in high school or college biology, chemistry, and (bio)chemical engineering courses that cover principles of protein isolation and characterization.
| Name of Material/ Equipment | Company | Catalog Number | Comments/Description |
|---|---|---|---|
| Protein A membrane adsorber (Sartobind Protein A 2 ml) | Sartorius- Stedim | 93PRAP06HB-12--A | |
| Amicon Ultra centrifugal filter, 10 kDa, 4 ml | Millipore | UFC801008 | Use 15 ml volume if needed |
| Sterile vacuum filter unit, 0.22 μm, 500 ml | Millipore | SCGPU05RE | |
| 10 ml Syringes with Luer Lock tips | BD | 301604 | |
| 30 ml Syringes with Luer Lock tips | BD | 309650 | |
| Tygon lab tubing (1/16"×1/8"×50') | Cole Parmer | WU-95903-16 | |
| Slide-A-Lyzer MINI Dialysis Devices (10K MWCO) | Thermo Scientific | 69576 | |
| Snap i.d. antibody collection tray | EMD Millipore | WBAVDABTR | |
| Snap i.d. single well blot holder | EMD Millipore | WBAVDBH01 | |
| Elution buffer | Thermo Scientific | 21004 | |
| Tris, ultra pure | Fisher Scientific | 819623 | |
| Sodium chloride | Fisher Scientific | 7647-14-5 | |
| Tween 20 | Fisher Scientific | BP337-100 | |
| DPBS | Thermo Scientific | SH30028.02 | |
| DPBS with Ca2+/Mg2+ | Life Technologies | 14080-055 | |
| BSA | Sigma | A9647 | |
| Human Fc | Bethyl Research Laboratories | P80-104 | |
| Anti-human Fc-APC | Jackson Immunoresearch | 109136170 | |
| Anti-human Fc-AP | Bio-Rad | 170-5018 | |
| Alkaline phosphatase substrate | Promega | S3841 | |
| Flow cytometry tubes (5 ml polystyrene or polypropylene) | BD | 352054 |
| Name of Material/ Equipment | Company | Catalog Number | Comments/Description |
|---|---|---|---|
| Syringe pump | Harvard Apparatus | 55-2226 | A peristaltic pump is also acceptable |
| Protein gel electrophoresis system | Bio-Rad Laboratories | 552BR094876 | Any gel electrophoresis system is acceptable, but mini gel systems run fastest |
| Semi-dry blotter | Bio-Rad Laboratories | 690BR006163 | Any transfer system is acceptable, but discontinuos transfer systems perform electrophoretic transfer fastest |
| SNAP i.d. vacuum-assisted protein detection system | EMD Millipore | WBAVDBASE | An upgraded model has replaced this specific instrument, but either should work just as well |
ACKNOWLEDGMENTS
The authors wish to thank Mr. Luis F. Delgadillo (Department of Chemical and Biomolecular Engineering, Ohio University), Mr. Matthew H. Williams (Department of Chemical and Biomolecular Engineering, Ohio University), and Dr. Filiberto Cedeno-Laurent (Brigham and Women's Hospital and Harvard Medical School) for expert technical assistance. The authors also wish to thank the Winter 2011 CHE 404/BME 504 and Fall 2012 CHE 4830/BME 5830 students (Department of Chemical and Biomolecular Engineering and Biomedical Engineering Program, Ohio University) for technical advice and discussion. This work was supported by National Science Foundation (NSF) Major Research Instrumentation grant CBET-1039869 (MMB), NSF CBET-1106118 (MMB), Dermatology Foundation Research Grant A050422 (SRB), National Institutes of Health (NIH) NCI grant 1R15CA161830-01 (MMB), NIH Kirschstein-NRSA Postdoctoral Fellowship F32CA144219-01A1 (SRB), NIH NCCAM grant R01AT004628 (CJD) and NIH NCI grant R01CA173610 (CJD).
Footnotes
DISCLOSURES: The authors declare that they have no competing financial interests.
REFERENCES
- 1.Gagnon P. Technology trends in antibody purification. Journal of Chromatography A. 2012;1221:57–70. doi: 10.1016/j.chroma.2011.10.034. doi:10.1016/j.chroma.2011.10.034. [DOI] [PubMed] [Google Scholar]
- 2.Gottschalk U. Bioseparation in antibody manufacturing: The good, the bad and the ugly. Biotechnol Prog. 2008;24:496–503. doi: 10.1021/bp070452g. doi:10.1021/bp070452g. [DOI] [PubMed] [Google Scholar]
- 3.Liu HF, Ma J, Winter C, Bayer R. Recovery and purification process development for monoclonal antibody production. MAbs. 2010;2:480–499. doi: 10.4161/mabs.2.5.12645. [DOI] [PMC free article] [PubMed] [Google Scholar]
- 4.Low D, O'Leary R, Pujar NS. Future of antibody purification. J Chromatogr B Analyt Technol Biomed Life Sci. 2007;848:48–63. doi: 10.1016/j.jchromb.2006.10.033. doi:10.1016/j.jchromb.2006.10.033. [DOI] [PubMed] [Google Scholar]
- 5.Boi C. Membrane adsorbers as purification tools for monoclonal antibody purification. J Chromatogr B Analyt Technol Biomed Life Sci. 2007;848:19–27. doi: 10.1016/j.jchromb.2006.08.044. doi:10.1016/j.jchromb.2006.08.044. [DOI] [PubMed] [Google Scholar]
- 6.Cuatrecasas P. Protein purification by affinity chromatography. Derivatizations of agarose and polyacrylamide beads. J Biol Chem. 1970;245:3059–3065. [PubMed] [Google Scholar]
- 7.Shukla AA, Gottschalk U. Single-use disposable technologies for biopharmaceutical manufacturing. Trends Biotechnol. 2013;31:147–154. doi: 10.1016/j.tibtech.2012.10.004. doi:10.1016/j.tibtech.2012.10.004. [DOI] [PubMed] [Google Scholar]
- 8.Boi C, Dimartino S, Sarti GC. Performance of a new protein a affinity membrane for the primary recovery of antibodies. Biotechnol Prog. 2008;24:640–647. doi: 10.1021/bp0704743. doi:10.1021/bp0704743. [DOI] [PubMed] [Google Scholar]
- 9.Dancette OP, Taboureau J, Tournier E, Charcosset C, Blond P. Purification of immunoglobulins g by protein a/g afinity membrane chromatography. Journal of Chromatography B. 1999;723:61–68. doi: 10.1016/s0378-4347(98)00470-8. [DOI] [PubMed] [Google Scholar]
- 10.Thommes J, Etzel M. Alternatives to chromatographic separations. Biotechnol Prog. 2007;23:42–45. doi: 10.1021/bp0603661. doi:10.1021/bp0603661. [DOI] [PubMed] [Google Scholar]
- 11.Boi C, Dimartino S, Sarti GC. Modelling and simulation of affinity membrane adsorption. J Chromatogr A. 2007;1162:24–33. doi: 10.1016/j.chroma.2007.02.008. doi:10.1016/j.chroma.2007.02.008. [DOI] [PubMed] [Google Scholar]
- 12.van Beijeren P, et al. Computer-aided process design of affinity membrane adsorbers: A case study on antibodies capturing. Chemical Papers. 2008;62:458–463. [Google Scholar]
- 13.Lauriere M. A semidry electroblotting system efficiently transfers both high- and low-molecular-weight proteins separated by sds-page. Anal Biochem. 1993;212:206–211. doi: 10.1006/abio.1993.1313. doi:10.1006/abio.1993.1313. [DOI] [PubMed] [Google Scholar]
- 14.Darcy E, Leonard P, Fitzgerald J, Danaher M, O'Kennedy R. Purification of antibodies using affinity chromatography. Methods Mol Biol. 2011;681:369–382. doi: 10.1007/978-1-60761-913-0_20. doi:10.1007/978-1-60761-913-0_20. [DOI] [PubMed] [Google Scholar]
- 15.Hjelm H, Hjelm K, Sjoquist J. Protein a from staphylococcus aureus. Its isolation by affinity chromatography and its use as an immunosorbent for isolation of immunoglobulins. FEBS Lett. 1972;28:73–76. doi: 10.1016/0014-5793(72)80680-x. [DOI] [PubMed] [Google Scholar]
- 16.Hober S, Nord K, Linhult M. Protein a chromatography for antibody purification. J Chromatogr B Analyt Technol Biomed Life Sci. 2007;848:40–47. doi: 10.1016/j.jchromb.2006.09.030. doi:10.1016/j.jchromb.2006.09.030. [DOI] [PubMed] [Google Scholar]
- 17.Kronvall G. A surface component in group a, c, and g streptococci with non-immune reactivity for immunoglobulin g. J Immunol. 1973;111:1401–1406. [PubMed] [Google Scholar]
- 18.Cedeno-Laurent F, et al. Development of a nascent galectin-1 chimeric molecule for studying the role of leukocyte galectin-1 ligands and immune disease modulation. J Immunol. 2010;185:4659–4672. doi: 10.4049/jimmunol.1000715. doi:10.4049/jimmunol.1000715. [DOI] [PMC free article] [PubMed] [Google Scholar]
- 19.Laemmli UK. Cleavage of structural proteins during the assembly of the head of bacteriophage t4. Nature. 1970;227:680–685. doi: 10.1038/227680a0. [DOI] [PubMed] [Google Scholar]
- 20.Towbin H, Staehelin T, Gordon J. Electrophoretic transfer of proteins from polyacrylamide gels to nitrocellulose sheets: Procedure and some applications. Proc Natl Acad Sci USA. 1979;76:4350–4354. doi: 10.1073/pnas.76.9.4350. [DOI] [PMC free article] [PubMed] [Google Scholar]
- 21.Reisner AH, Nemes P, Bucholtz C. The use of coomassie brilliant blue g250 perchloric acid solution for staining in electrophoresis and isoelectric focusing on polyacrylamide gels. Anal Biochem. 1975;64:509–516. doi: 10.1016/0003-2697(75)90461-3. [DOI] [PubMed] [Google Scholar]
- 22.Cedeno-Laurent F, et al. Metabolic inhibition of galectin-1-binding carbohydrates accentuates antitumor immunity. J Invest Dermatol. 2012;132:410–420. doi: 10.1038/jid.2011.335. doi:10.1038/jid.2011.335. [DOI] [PMC free article] [PubMed] [Google Scholar]
- 23.Bradford MM. A rapid and sensitive method for the quantitation of microgram quantities of protein utilizing the principle of protein-dye binding. Anal Biochem. 1976;72:248–254. doi: 10.1006/abio.1976.9999. [DOI] [PubMed] [Google Scholar]
- 24.Desjardins P, Hansen JB, Allen M. Microvolume protein concentration determination using the nanodrop 2000c spectrophotometer. J Vis Exp. 2009 doi: 10.3791/1610. doi:10.3791/1610. [DOI] [PMC free article] [PubMed] [Google Scholar]
- 25.Ernst O, Zor T. Linearization of the bradford protein assay. J Vis Exp. 2010 doi: 10.3791/1918. doi:10.3791/1918. [DOI] [PMC free article] [PubMed] [Google Scholar]
- 26.Simonian MH, Smith JA. Spectrophotometric and colorimetric determination of protein concentration. Curr Protoc Mol Biol. 2006;Chapter 10(Unit 10 11A) doi: 10.1002/0471142727.mb1001as76. doi:10.1002/0471142727.mb1001as76. [DOI] [PubMed] [Google Scholar]
- 27.Smith PK, et al. Measurement of protein using bicinchoninic acid. Anal Biochem. 1985;150:76–85. doi: 10.1016/0003-2697(85)90442-7. [DOI] [PubMed] [Google Scholar]
- 28.Gravel C, et al. Quantitative analyses of all influenza type a viral hemagglutinins and neuraminidases using universal antibodies in simple slot blot assays. J Vis Exp. 2011 doi: 10.3791/2784. doi:10.3791/2784. [DOI] [PMC free article] [PubMed] [Google Scholar]


