Abstract
Cancer therapies which are less toxic and invasive than their existing counterparts are highly desirable. The use of RF electric-fields that penetrate deep into the body, causing minimal toxicity, are currently being studied as a viable means of non-invasive cancer therapy. It is envisioned that the interactions of RF energy with internalized nanoparticles (NPs) can liberate heat which can then cause overheating (hyperthermia) of the cell, ultimately ending in cell necrosis.
In the case of non-biological systems, we present detailed protocols relating to quantifying the heat liberated by highly-concentrated NP colloids. For biological systems, in the case of in vitro experiments, we describe the techniques and conditions which must be adhered to in order to effectively expose cancer cells to RF energy without bulk media heating artifacts significantly obscuring the data. Finally, we give a detailed methodology for in vivo mouse models with ectopic hepatic cancer tumors.
Keywords: Radiofrequency, Cancer, Nanoparticles, Hyperthermia, Gold
Introduction
The absorption of RF energy by biological tissue (due to their inherent electrical permittivity) results in elevated tissue temperatures as a function of time, which eventually leads to cell death by hyperthermia. It is hypothesized that cancer hyperthermia can be optimized through the use of targeted nanomaterials which internalize within the cancer cell and act as RF-thermal transducers, leaving the neighboring healthy, normal cells, intact. Several reports have already shown that a variety of NPs can act as effective RF heat sources which aid in cancer necrosis(1–4).
In these regards, gold NPs (AuNPs)(3–5), carbon nanotubes(1), and quantum dots(6, 7) have exhibited exciting characteristics when used in both in vitro and in vivo RF experiments. Although the exact nature of the heating mechanism of these NPs when exposed to an RF-field is still under debate, a series of fundamental experiments using AuNPs has placed great significance on both NP size and aggregation states. It was shown that only AuNPs with diameters < 10 nm will heat when exposed to an RF-field(8). Also, this heating mechanism is significantly attenuated when the AuNPs are aggregated. This aggregation condition was also validated within in vitro models which placed importance upon optimizing AuNP colloidal stability within endolysomal intracellular compartments for efficacious RF therapy(4). However, the techniques and experimental principles used to collect and assess this data can be problematic, especially in the case of validating RF heat profiles from NP colloids.
Several reports have shown that Joule heating of the background ionic suspension which the NPs are suspended in can be the main source of RF heat production and not the NPs themselves(9–12). Although our recent paper has validated the use of RF interactions in generating heat from AuNPs of diameters less than 10 nm, we aim to describe these protocols in more detail throughout this article.
We also demonstrate the protocols and techniques needed to evaluate the effectiveness of the AuNPs as hyperthermic thermal agents in both in vitro and in vivo experiments for liver cancer models. By adhering to these principles the experimentalist should hopefully be able to rapidly evaluate the potential for any nanomaterial to be an effective RF-induced thermal agent.
Protocol
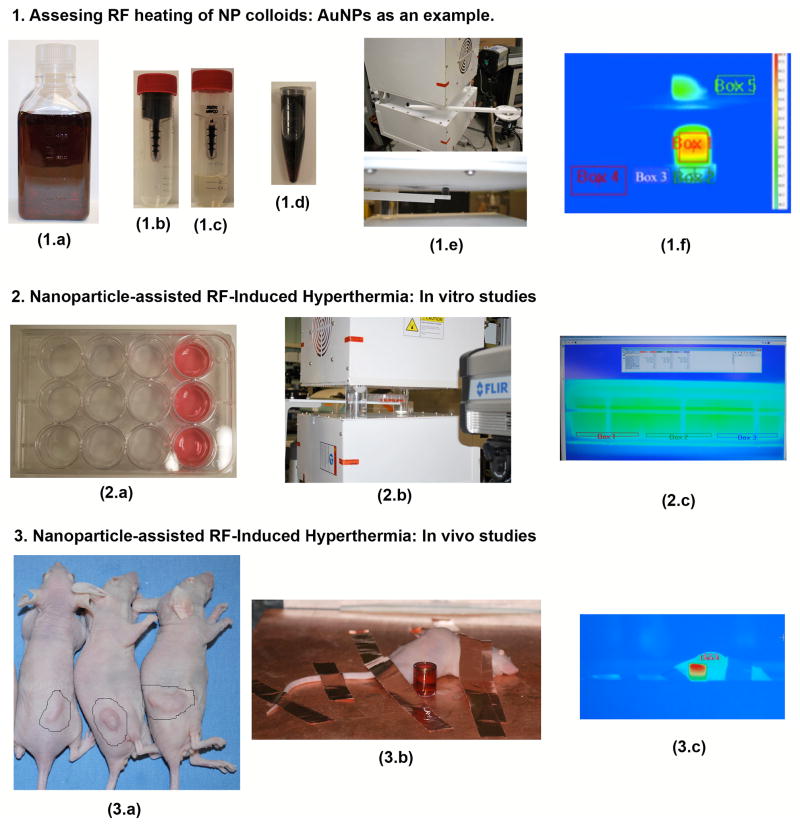
A complete experimental overview is depicted in Figure 1.
Figure 1.
Experimental overview. AuNP heating assessment: As-purchased AuNPs (1.a) are placed in a 50 kDa filter (1.b) and centrifuged down to separate the AuNPs from the filtrate (1.c). This allows for highly concentrated and purified AuNPs to be formed (1.d). The sample is then placed into the RF system using a Teflon sample holder mounted to an adjustable rotary stage (1.e). The AuNPs heating rates, as well as four other control areas, are recorded using an IR camera. In vitro protocols: Hep3B hepatic cancer cells are grown in the front 3-wells of several 12-well cell packs as shown in 2.a (the amount of cell-packs used depends on what the experimentalist wishes to investigate in terms of applied RF power, AuNP concentration, controls, etc.). Each 12-well plate is then subjected to the RF field (2.b). Although not necessary as the optimum RF exposure time has already been determined the media temperature can also be recorded using the IR camera (2.c). In vivo protocols: BALB-C mice beating ectopic hepatic tumors (3.a) were subjected to intra-tumoral injections of AuNPs and exposed to the RF system (3.b) for several minutes. Copper tape was used to ground the mice in order to prevent skin burning. A quartz cuvette filled with AuNPs is also shown next to the mouse to validate RF exposure. The tumor area should have a temperature higher than the rest of the mouse and usually appears red in the IR picture (3.c).
Further details are depicted in steps 1–3 below.
1. Assessing RF heating of NP colloids: AuNPs as an example
1.1 In general, for each NP sample being investigated, you must first wash the sample several times with DI water to remove background ions and contaminants. You will know that all the background ions and contaminants have been removed when the RF heating rates (HRs) of the removed liquids are equivalent to deionised (DI) water. This purification process also allows for higher concentrations of NPs to be obtained. It is worth noting that although you are using AuNPs in this example, the fundamental principles can be applied to other NP materials.
1.2 As an example you will purify and concentrate a 500 ml bottle of commercially available AuNPs of diameter 5 nm and then subject them to a 13.56 MHz RF field of electric-field strength 90 kV/m.
1.2.1 Take ~125 ml from the stock AuNP solution and split between six 50 kDa centrifuge filter tubes. Centrifuge at 3000 r.p.m. for 2 minutes 5 seconds. Remove buffers and refill filters with more stock solution. Repeat until all 500 ml has been used in filters.
1.2.2 Replace the filtered buffer with a similar volume of DI water and repeat approximately 8 times (or until the filtered buffer RF HRs are equivalent to DI water). Note, you can also use UV-vis analysis to monitor contaminant absorption peaks. Once the buffer contaminants have been fully removed, pipette approximately 0.5 ml DI water into each filter and resuspend the AuNPs by repeated back-and-forth pipetting. This should completely remove the AuNPs from the filter and allow for full resuspension. Combine all six suspensions into one 15 ml eppindorf tube.
1.2.3. Once the AuNPs have been purified and concentrated, you can analyze the sample using ICP-OES and/or ICP-MS, UV-vis and Zeta potential for data on concentration and NP stability, respectively. You can also use SEM and/or TEM analysis to obtain morphological data.
1.3 Using the Kanzius RF system described in our previous studies(8), or derivations of this system, place a 1.3 ml cylindrical quartz cuvette so that the RF electric-field in air (with no sample present) would be ~90 kV/m inside the cuvette. For a standard saline sample (0.9 % NaCl) the electric-field would be reduced to ~1.1 kV/m. These are the approximate conditions you must use to allow comparisons to be made between different systems.
1.3.1 Pipette 1.3 ml of a 1000 mg/L sample of your purified AuNP colloid into the quartz cuvette and introduce this into the RF-field. You can do this by using a custom-built Teflon sample holder similar to ours. Expose your sample to the RF-field for a period of 120 s or until the sample reaches 70 °C to prevent electrical arcing or rapid boiling. Capture the thermal imaging data (as well as control areas) using an IR camera. Repeat this procedure three times.
1.3.2 Filter the sample through another 50 kDa centrifuge filter to extract the AuNPs from the DI water buffer. Re-expose the buffer to the RF-field, again three times. The difference in HRs between the AuNP colloid and the background DI water buffer determines the HR due to the AuNPs themselves. You should expect to obtain HRs of ~0.5 °C/s and 0.05 °C/s to give an AuNP dependent HR of ~ 0.45 °C/s. Resuspend the remaining AuNPs from the filter in PBS for in vitro/vivo experiments.
2. Nanoparticle-assisted RF-Induced Hyperthermia: In vitro studies
2.1 These in vitro studies can be applied to any type of cancer cell species that form 2D monolayers. In this experiment you will use hepatic Hep3B cancer cells.
2.1.1. Plate ~50,000 cells per well in a 12-well plate with 1 ml of growth media. Repeat this 6 times (you will use three plates for NP studies and three plates as controls). Incubate at 37.5 °C for 24 hours before introducing the NPs.
2.1.2. Introduce 0.1 ml of the AuNP solution into each well and leave for another 24 hrs. Add 0.1 ml of PBS or water into each well of the three control cell plates and also leave for 24 hrs.
2.1.3 After 24 hrs has passed, aspirate and replace the cell media. Your cells are now ready for RF exposure.
2.2. Place each 12-well cell pack within the RF-field. Wait until the cells have cooled to 31 °C. Turn on the RF generator and expose for 3.5 minutes. The final temperature of your cell media will be ~39 °C. Turn off the RF field. Remove the cells and place them in an incubator for 24 hrs before analysis.
2.2.1 Remove your cells from the incubator and aspirate cell media. Add 1.4 ml of cell media to each well as well at 0.4 ml of MTT reagent. Incubate your cells for 4 hours. Aspirate media and replace with 2 ml of Dimethyl sulfoxide (DMSO). Place the cell plates on a bench rocker and leave for 10 minutes to allow the DMSO to solubilize the MTT reagents. Finally, pipette 100 μL of each well into a 96-well plate and optically read the well at 570 nm using a plate reader such as the SPECTROstar Nano plate reader.
3. Nanoparticle-assisted RF-Induced Hyperthermia: In vivo studies
3.1 These in vivo studies can be applied to any type of cancer that forms solid tumors in an orthotopic or ectopic murine model. This experiment uses Hep3B liver cancer cells in an ectopic tumor BALB-C Nude mouse model.
3.1.2 Note: all in vivo experiments are executed in compliance with all relevant guidelines, regulations and regulatory agencies. Also, the protocol being demonstrated was performed under the guidance and approval of University of Texas M.D. Anderson Cancer Centers Institutional Animal Care and Use Committee (IACUC).
3.2.1 Grow an appropriate number of cells (~100 k) in a tissue culture flask with the appropriate growth medium. Incubate in a 37 °C incubator with 5% CO2 for the duration of cell culture.
3.2.2 Treat your cells with trypsin (to disattach from the flask) and produce a solution of 2 million cells for every 25 microliters. Add an equal quantity of Matrigel (on ice) and mix thoroughly to prepare the final injection solution. Inject this solution into the desired position on the mouse’s back and wait an appropriate amount of time for the tumors to grow to the desired size (2 to 4 weeks for most cells). Before RF exposure your BALB-C Nude mice should bear solid ectopic tumors 1–2 cm diameter.
3.3.1 Prepare the mice to be used (in this case BALB-C Nude mice) by anaesthetizing them with a solution of ketamine and xylazine by IP injection. While the mice are falling asleep, keep them in a temperature controlled chamber at 37 °C.
3.3.2 Once properly anaesthetized, mount the mouse to be treated on the receiving head of your RF generator. You must position the mouse so that the tumor is closest to the transmission head. Shield the areas that are not to be treated, as well as sensitive areas such as eyes, ears, and toes, with copper tape. Be sure that the copper tape is appropriately contacting the grounding plane so that no charge buildup occurs. Also, the exposure area must have a gap of at least 1 cm greater than the size of your desired treatment site.
3.3.3. Position your IR thermal camera so that the tumor and treatment area are visible. Turn on RF for 5 minutes. Record the resulting temperature curve. If therapy achieves temperatures greater than your threshold temperature stop treatment immediately.
3.4.1 After RF exposure recover the mice from anesthesia in a warm chamber until they are conscious.
3.4.2 After your treatment period is over, euthanize the mice and take tumor sections. Record the weight of the tumor. Tumor sections are typically stained with haemotoxylin and eosin and for targets relevant to gauging therapeutic efficacy, e.g. Ki-67, cleaved caspase-3, etc.
Representative Results
1. Assessing RF heating of NP colloids: AuNPs as an example
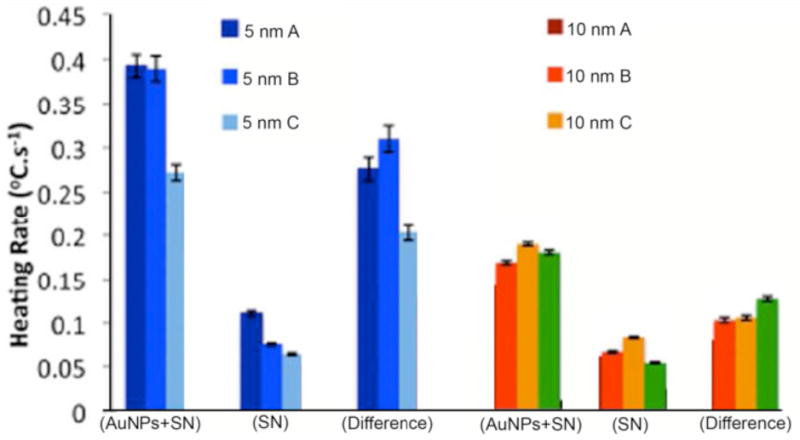
After following section 1.1 – 1.2.3. you should expect to have a highly concentrated, stable, and purified solution of 5 nm and 10 nm diameter AuNPs. From the 500 ml as-purchased stock solution, you should expect to obtain at least 4 ml of solution at a concentration of 1000 mg/L. The difference in HRs between the AuNPs and the background DI water buffer solution at this concentration should be ~0.25 °C/s and 0.1 °C/s for 5 nm and 10 nm AuNPs, respectively, as is shown in Figure 2.
Figure 2.

Heating rates (°C/s) of 5 nm and 10 nm diameter AuNPs solutions. As per protocol instructions, heating rates are determined for AuNPs with supernatant (AuNPs+SN), AuNPs filtered out so that only the supernatant is present (SN), and the difference in heating rates between these two (difference). Average heating rates are from three different experiments (A, B, and C).
2. Nanoparticle-assisted RF-Induced Hyperthermia: In vitro studies
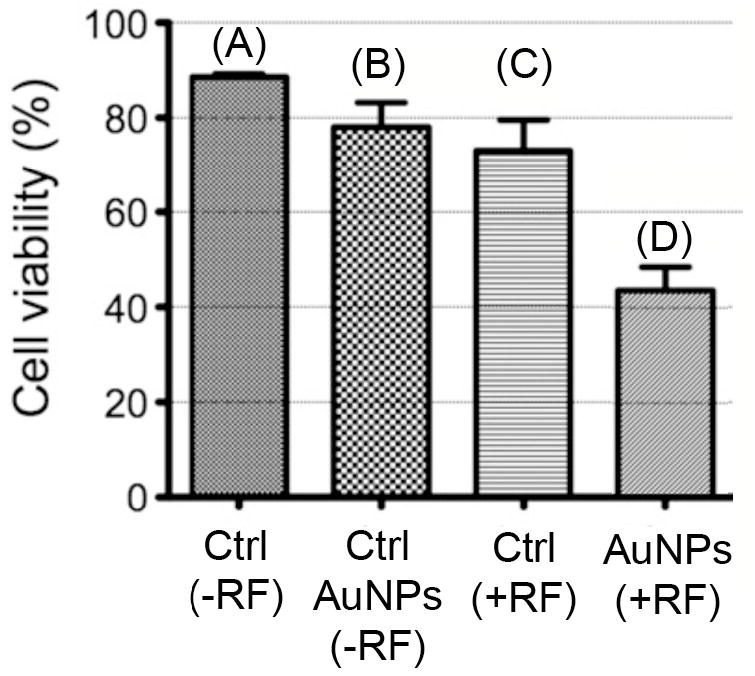
The results should ideally show that cells exposed to an RF field which have internalized AuNPs are less viable than the non-AuNP RF exposed cells. An example of such expected results are highlighted in Figure 3.
Figure 3.

Hyperthermia cytotoxicity viability (MTT assay). Shown are four cell experiments: control (no RF), AuNP only (no RF), RF only, and RF with addition of cellular internalized AuNPs (A, B, C, and D, respectively).
3. Nanoparticle-assisted RF-Induced Hyperthermia: In vivo studies
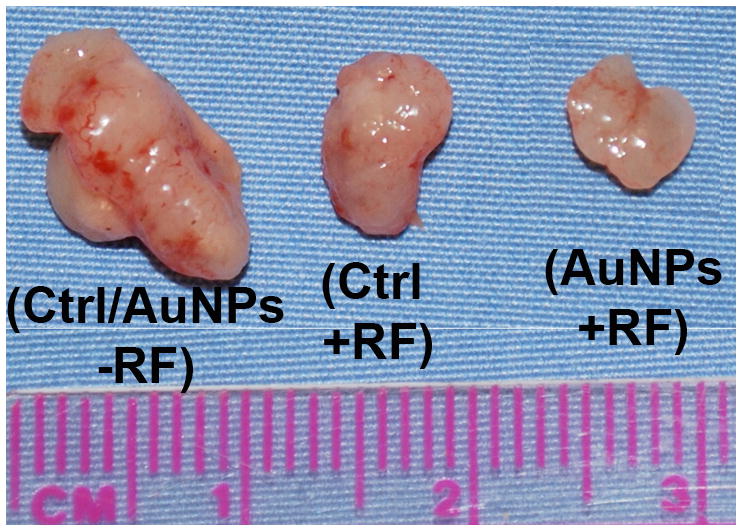
Upon injection of PBS-suspended AuNPs and after the RF exposure treatment of ~2–3 weeks, posthumous analysis should reveal controlled tumor growth and/or a decrease in tumor size/mass (as shown in Figure 4) There may also be evidence of direct cellular thermal ablation.
Figure 4.

Posthumous analysis of ectopic mice tumors. The left-hand tumor is what would be expected from both control specimens (i.e. no RF and no AuNP injection). The middle tumor shows a slight decrease in size when subjected to the RF field alone. However, the right-hand tumor shows that the RF+AuNP combined therapy can decrease/control the tumor growth even further.
Discussion
These protocols allow the experimentalist to fully analyze the extent to which nanomaterials (in this case AuNPs) can increase RF-induced hyperthermia for cancer treatment. The first protocol specifically deals with analyzing heat production from highly-concentrated and purified AuNP samples. Although other groups have reported heat production primarily from the buffers which the AuNPs are suspended in and not the AuNPs themselves(9–11), their RF systems used lower concentrations of AuNPs with diameters > 10 nm, as well as lower RF operating powers. Only by following the protocols listed in this report can the experimentalist observe the nanoscale heat phenomenon.
The in vitro section allows development of cellular-RF-NP interfaces to be studied for optimized RF/NP-induced hyperthermia. Before addition of AuNPs and RF exposure, you should expect to have a viable 2D layer growth of the relevant cancer cell lines (in this case Hep3B). However, the correct RF exposure time for each cell line needs to be predetermined before these experiments by exposing cells to the RF field at different time points (e.g. 2 mins to 8 mins) and looking at their viability profile after 24 hours. The correct RF exposure time to use should be where the cells are ~80 % viable. In the case of Hep3B cells this was found to be ~3.5 minutes.
The most preferential assay of choice for viability is the standard 3-(4,5-Dimethylthiazol2-yl)-2.5-diphenyltetrazolium bromide (MTT) assay, although another assay may be needed if it is anticipated that the NPs will interact with the assay reagents (as was the case with MTT assay reacting with CNTs(13)). Other more advanced and detailed assays can be used to assess cell death mechanism such as FACS analysis with Annexin-V and Propidium Iodide (PI) staining.
Future in vitro system developments within our group will look at placing the cells in a temperature-controlled RF-inert incubator to completely rule out any possible sources of hyperthermia due to bulk heating of the cell media.
Finally, in vivo protocols were described to allow for full bio-analysis of AuNPs in ectopic hepatic cancer mice models for their ability to control or decrease tumor growth and/or size in combination with RF therapy. An important point for discussion is the ability for the RF-field to induce skin burns on the mouse due to incorrect grounding procedures. The use of properly grounded and placed copper tape, as mentioned in the protocol section, is a requirement in order to stop these burns.
Future in vivo work in our lab will work on assessing the actual mechanism of tumor death/size control from RF-AuNP exposure. Although it is hypothesized that hyperthermia plays a critical role, this has to be validated though the use of such controls as direct insertion of optical-fiber thermal probes into the tumor and surrounding healthy cells to look at the RF-induced temperature response of such tissues. Also, the development of an intracellular fluorescent thermal dye whose emission wavelength is a direct function of temperature would be an excellent tool for this validation and could also be used for in vitro models.
Supplementary Material
Acknowledgments
This work was funded by the NIH (U54CA143837), the NIH M.D. Anderson Cancer Center Support Grants (CA016672), the V Foundation (SAC), and an unrestricted research grant from the Kanzius Research Foundation (SAC, Erie, PA). We thank Kristine Ash from the Department of Surgical Oncology, M.D. Anderson Cancer Center, for administrative assistance.
Footnotes
A complete version of this article that includes the video component is available at http://dx.doi.org/10.3791/50480.
Disclosures:
“I have nothing to disclose”.
Contributor Information
Stuart J. Corr, Email: SJCorr@mdanderson.org.
Brandon T. Cisneros, Email: BTCisneros@mdanderson.org.
Steven A. Curley, Email: scurley@mdanderson.org.
References
- 1.Gannon CJ, et al. Carbon nanotube-enhanced thermal destruction of cancer cells in a noninvasive radiofrequency field. Cancer. 2007 Dec 15;110:2654. doi: 10.1002/cncr.23155. [DOI] [PubMed] [Google Scholar]
- 2.Curley SA, et al. Noninvasive radiofrequency field-induced hyperthermic cytotoxicity in human cancer cells using cetuximab-targeted gold nanoparticles. Journal of Experimental Therapeutics and Oncology. 2008;7:313. [PubMed] [Google Scholar]
- 3.Gannon CJ, et al. Intracellular gold nanoparticles enhance non-invasive radiofrequency thermal destruction of human gastrointestinal cancer cells. Journal of nanobiotechnology. 2008;6:2. doi: 10.1186/1477-3155-6-2. [DOI] [PMC free article] [PubMed] [Google Scholar]
- 4.Raoof M, et al. Stability of antibody-conjugated gold nanoparticles in the endolysosomal nanoenvironment: implications for noninvasive radiofrequency-based cancer therapy. Nanomedicine. 2012 Oct;8(7):1096. doi: 10.1016/j.nano.2012.02.001. [DOI] [PMC free article] [PubMed] [Google Scholar]
- 5.Glazer ES, et al. Pancreatic carcinoma cells are susceptible to noninvasive radio frequency fields after treatment with targeted gold nanoparticles. Surgery. 2010 Aug;148:319. doi: 10.1016/j.surg.2010.04.025. [DOI] [PMC free article] [PubMed] [Google Scholar]
- 6.Glazer ES, et al. Radiofrequency field-induced thermal cytotoxicity in cancer cells treated with fluorescent nanoparticles. Cancer. 2010 Jul 1;116:3285. doi: 10.1002/cncr.25135. [DOI] [PMC free article] [PubMed] [Google Scholar]
- 7.Glazer ES, et al. Non-invasive radiofrequency ablation of malignancies mediated by quantum dots, gold nanoparticles and carbon nanotubes. Therapeutic Delivery. 2011;2:1325. doi: 10.4155/tde.11.102. [DOI] [PMC free article] [PubMed] [Google Scholar]
- 8.Corr SJ, et al. Citrate-Capped Gold Nanoparticle Electrophoretic Heat Production in Response to a Time-Varying Radiofrequency Electric-Field. J Phys Chem C. 2012 doi: 10.1021/jp309053z. [DOI] [PMC free article] [PubMed] [Google Scholar]
- 9.Kruse DE, et al. A Radio-Frequency Coupling Network for Heating of Citrate-Coated Gold Nanoparticles for Cancer Therapy: Design and Analysis. IEEE Transactions on Biomedical Engineering. 2011;58 doi: 10.1109/TBME.2011.2124460. [DOI] [PMC free article] [PubMed] [Google Scholar]
- 10.Li D, et al. Negligible absorption of radiofrequency radiation by colloidal gold nanoparticles. Journal of colloid and interface science. 2011 Jun 1;358:47. doi: 10.1016/j.jcis.2011.01.059. [DOI] [PubMed] [Google Scholar]
- 11.Liu X, et al. Low frequency heating of gold nanoparticle dispersions for non-invasive thermal therapies. Nanoscale. 2012 May 23; doi: 10.1039/c2nr30166k. [DOI] [PubMed] [Google Scholar]
- 12.Sassaroli E, et al. Radio frequency absorption in gold nanoparticle suspensions: a phenomenological study. Journal of Physics D: Applied Physics. 2012;45:075303. [Google Scholar]
- 13.Worle-Knirsch JM, et al. Oops they did it again! Carbon nanotubes hoax scientists in viability assays. Nano Lett. 2006 Jun;6:1261. doi: 10.1021/nl060177c. [DOI] [PubMed] [Google Scholar]
Associated Data
This section collects any data citations, data availability statements, or supplementary materials included in this article.


