Abstract
A recurring theme in theoretical work is that integration over populations of similarly tuned neurons can reduce neural noise. However, there are relatively few demonstrations of an explicit noise reduction mechanism in a neural network. Here we demonstrate that the brainstem of the barn owl includes a stage of processing apparently devoted to increasing the signal-to-noise ratio in the encoding of the interaural time difference (ITD), one of two primary binaural cues used to compute the position of a sound source in space. In the barn owl, the ITD is processed in a dedicated neural pathway that terminates at the core of the inferior colliculus (ICcc). The actual locus of the computation of the ITD is before ICcc in the nucleus laminaris (NL), and ICcc receives no inputs carrying information that did not originate in NL. Unlike in NL, the rate-ITD functions of ICcc neurons require as little as a single stimulus presentation per ITD to show coherent ITD tuning. ICcc neurons also displayed a greater dynamic range with a maximal difference in ITD response rates approximately double that seen in NL. These results indicate that ICcc neurons perform a computation functionally analogous to averaging across a population of similarly tuned NL neurons.
Keywords: interaural time difference, sound localization, inferior colliculus, nucleus laminaris, barn owl, pooling
Introduction
Variability in responses to repeated stimuli under identical conditions has led to the spiking of neurons being often characterized as noisy (Vogels et al., 1989; Softky and Koch, 1993; Rieke et al., 1997). A recurring theme in theoretical work is that integration over populations of similarly tuned neurons can reduce this noise (Parker and Newsome, 1998; Shadlen and Newsome, 1998; Mazurek and Shadlen, 2002; Masuda and Aihara, 2003; Kenyon et al., 2004), although the mechanism does not necessarily need to be related to averaging or indeed even linear (Mar et al., 1999). Experimental work has been done to confirm the general viability of the theory (DeAngelis et al., 1999; Ronacher et al., 2004; Bonifazi et al., 2005). However, there are relatively few demonstrations of an explicit noise reduction mechanism in a neural network.
The hindbrain and midbrain nuclei of the owl responsible for the computation of sound location have been well characterized anatomically (Takahashi and Konishi, 1988a,b). Two segregated pathways process the two primary binaural cues, the interaural time difference (ITD) and the interaural level difference (ILD) (Sullivan and Konishi, 1984; Takahashi et al., 1984). The neurons of the nucleus laminaris (NL) act as coincidence detectors that perform the basic computation for the neural coding of ITD (Carr and Konishi, 1990). Because cochlear hair cells respond to only a limited range of frequencies, and because the narrowness of this frequency-tuning bandwidth is maintained through to NL, NL neurons respond almost equally well to ITDs that are phase-equivalent within their frequency tuning range (Carr and Konishi, 1990; Peña and Konishi, 2000). Thus, a given firing rate can correspond to multiple ITDs, and the true ITD cannot be determined from the response of a single NL neuron.
Although NL is the initial locus of the computation of ITD, it is not the last nucleus in the exclusively ITD-responsive pathway. It projects both to the core of the central nucleus of the inferior colliculus (ICcc), the terminus of the ITD pathway (Takahashi and Konishi, 1988a), and to the dorsal lateral lemniscal nucleus, pars anterior [LLDa, previously referred to as VLVa (Takahashi and Konishi, 1988b)]. LLDa in turn projects to ICcc (Moiseff and Konishi, 1983) as well as the nucleus basalis (Wild et al., 2001). There are no reports that LLDa receives input from areas other than NL. Previous work has described the response to ITD seen in ICcc as similar to that observed in NL (Wagner et al., 1987, 2002). However, work in mammals showed a sharpening of ITD tuning in the ascending auditory pathway (Fitzpatrick et al., 1997).
The lack of any identified distinction in response properties between ICcc and NL is puzzling, so we compared the ITD response of NL and ICcc neurons in an attempt to explain this apparent redundancy. Single units were recorded in both nuclei, and rate-ITD functions using broadband noise were collected for each unit over a broad range of ITDs. We observed that, with NL neurons, it was necessary to average the responses of upwards of six broadband noise samples per ITD for visible structure in the rate-ITD function to emerge. Conversely, ICcc neurons required only one or two noise samples per ITD, indicating an increase in response reliability. At the same time, ICcc neurons had a greater maximal peak-to-trough response difference than seen in NL, resulting in an improved ability of a single unit to discriminate between nearby ITDs.
Materials and Methods
Data were obtained from 16 adult barn owls (Tyto alba) of both sexes. Owls were anesthetized by intramuscular injection of ketamine hydrochloride (20 mg/kg Ketaject; Phoenix Pharmaceuticals, Mountain View, CA) and xylazine (2 mg/kg Xyla-Ject; Phoenix Pharmaceuticals). An adequate level of anesthesia was maintained by additional injections of both when needed. The protocol for this study followed the National Institutes of Health Guide for the Care and Use of Laboratory Animals and was approved by the Animal Care and Use Committee of the Institute.
Electrophysiology
We isolated and maintained NL single neurons by a loose patch method (Peña et al., 1996, 2001) in which the electrode served as a suction electrode, allowing us to hold neurons for a long time. Neural signals were serially amplified by an Axoclamp-2A (Molecular Devices, Palo Alto, CA) and a custom-made AC amplifier (200 µM; Caltech Biology Electronic Shop, Pasadena, CA). ICcc neurons were recorded using tungsten electrodes (A-M Systems, Carlsborg, WA). A spike discriminator (SD1; Tucker-Davis Technologies, Gainesville, FL) converted neural impulses into transistor-to-transistor logic pulses for an event timer (ET1; Tucker-Davis Technologies), which recorded the timing of the pulses. A computer was used for stimulus synthesis and on-line data analysis.
It is possible that the differences in the recording techniques used for ICcc and NL contributed to the changes observed in response properties. Specifically, the loose patch technique used in NL could be causing a significant injury to NL neurons, affecting their response. This method was developed to overcome the difficulty in obtaining stable and well isolated recordings in NL. We consider that the recorded NL neurons are in reasonably good health because we obtain stable recordings that last for more than 1 h and we have shown previously that NL neurons recorded by loose patch have tuning to ITD that is tolerant to a broad range of sound intensity (Peña et al., 1996) and precisely matches the values expected by conduction delays of afferent fibers published in previous studies (Carr and Konishi, 1990; Peña et al., 2001).
Acoustic stimulation
An earphone assembly consisting of a Knowles (Itasca, IL) 1914 receiver, a Knowles 1743 damping device, and a Knowles 1939 microphone delivered sound stimuli. These components are encased in an aluminum cylinder that fits into the owl’s ear canal. The gaps between the cylinder and the ear canal were filled with silicon impression material (Gold Velvet II; Earmold and Research Laboratory, Wichita, KS). At the beginning of each experimental session, the earphone assemblies were automatically calibrated (Arthur, 2004). The computer was programmed to equalize sound pressure level (SPL) and phase for all frequencies within the frequency range relevant to the experiment for both tonal and broadband stimulation. Noise was designed by specifying the desired amplitude and phase spectrum, applying the calibration, and computing the inverse Fourier transform. Initial phase was randomized while preserving the desired interaural phase difference for each trial.
Tonal and broadband stimuli 100 ms in duration with 5 ms rise/fall times were presented once per second. We used PA4 digital attenuators (Tucker-Davis Technologies) to vary stimulus sound levels. Rate-ITD functions were collected at an intensity of 50 dB/SPL, which was found to be consistently above the saturation threshold of rate-intensity functions in both NL and ICcc.
Data collection
Long-range rate-ITD functions were obtained by scanning in 30 µs steps from ±2000 to ±3000 µs. A unique broadband signal (1–12 kHz) was synthesized for each ITD presentation.
For each neuron, we collected an iso-intensity frequency–tuning curve (mean firing rate as a function of frequency at a constant sound level) using the same sound intensity as the corresponding rate-ITD function.
In this paper, a presentation of a single acoustic signal is referred to as a “trial.” We used 5–10 trials per ITD to construct the rate-ITD function for each neuron. Trials were presented in pseudorandom order, with “blocks” consisting of one trial per ITD condition.
Data analysis
To examine the convergence to the mean, only those neurons for which we were able to collect 10 blocks were included. We first computed r10, the rate-ITD function generated by averaging across 10 trials per ITD condition and then normalizing by a factor of Fr10 to have a root-mean-square of 1. The similarity between r10 and rn (where rn is the rate-ITD function generated by averaging across a randomly selected subset of n trials per ITD condition and then normalizing by Fr10) is given by the correlation coefficient:
where Cov is the covariance and Var is the variance.
The Fisher information (FI) index of a single unit is given by the following:
where P(r|i) is the probability of response r given a stimulus with ITD i. P(r|i) was estimated by constructing an R × I histogram matrix P̂, where I is the total number of ITD conditions presented, and R is the maximum number of spikes elicited by a single trial for that neuron plus one. The (i,j)th element of P̂ is the number of trials that had the jth ITD and elicited i spikes. P̂ was then smoothed using a Gaussian kernel with SDs of 0.5 spikes and 15 µs, respectively, and then normalized so that each column summed to 1 (Dean et al., 2005).
The rectification index (RI) of an ITD tuning curve is computed by first normalizing the rate-ITD function to have values between 0 and 1. Then the responses to the 30 largest ITDs (15 each from positive and negative ITDs) were averaged to give the RI. Treating the rate-ITD function as a damped oscillation, this gives an estimate of the mean value of the function in the damped regions as a fraction of the peak-to-peak amplitude. An RI of 0.5 indicates no rectification (that is, the mean of the function in the damped regions is also the mean of the whole function); an RI of 0 is consistent with negative half-wave rectification, whereas an RI of 1 would be positive half-wave rectification.
Results
We collected long-range rate-ITD functions for 31 NL and 28 ICcc neurons (Fig. 1a,b). As discussed in Introduction, the sound frequencies used in ITD detection by the barn owl are sufficiently high that it is possible for multiple peaks of the rate-ITD functions to occur within the range of ITD that can be experienced by the owl under physiological conditions (±180 µs) (Moiseff and Konishi, 1983). The narrow frequency tuning of NL neurons results in an ambiguity that can be resolved by convergence across frequency channels (Takahashi and Konishi, 1986; Mazer, 1998). In both the NL and ICcc rate-ITD functions we collected, the heights of the peaks that occur within the owl’s physiological range are similar, indicative of the narrow frequency tuning and the absence of frequency convergence that has been mentioned in previous work (Carr and Konishi, 1990; Mazer, 1995; Wagner et al., 2002). However, previous studies have not had access to comparable data from both nuclei and hence did not quantify this observation. The widths at half-height of the iso-intensity frequency tuning curve versus the center frequency at half-height, for the 28 ICcc neurons and 80 NL neurons (including 49 previously recorded neurons for which long-range rate-ITD functions were not available) (Fig. 1c), showed a similar distribution, consistent with a lack of frequency convergence (regression slopes not different by F test, p > 0.5). In both nuclei, a significant dependence of bandwidth on the center frequency ( p < 0.0001) was observed.
Figure 1.
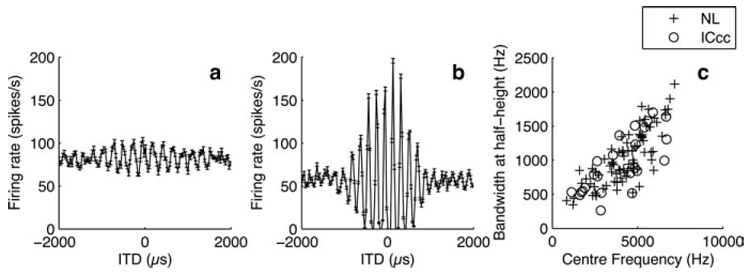
a,b, Examples of NL (a) and ICcc (b) rate-ITD functions. Note the difference in the dynamic range of the response, as well as the similarity in the amplitude of the error bars (SEM). Consistent with a lack of frequency convergence, when only those portions of the functions within ±300 µs are considered, the peaks of both the NL and ICcc functions show no sign of relative suppression. c, Width at half-height of the iso-intensity frequency tuning curve plotted against center frequency for NL (+) and ICcc (○). The distributions are not different.
Improvement of ITD tuning with repeated stimulation
We compared the reliability of the ITD coding in both nuclei by examining the dependence of the mean response on the number of stimulus presentations. The fluctuations of the NL neurons in firing rate for a single stimulus presentation mask the fluctuations in firing rate attributable to the ITD of the signal. Only with averaging across multiple trials does the dependence of firing rate on ITD become apparent. Conversely, in ICcc, the dependence is clear with only a single stimulus presentation (Fig. 2).
Figure 2.
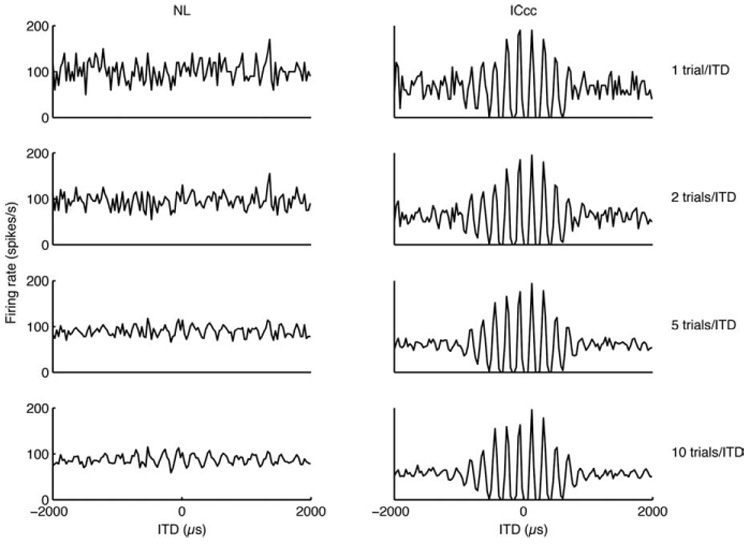
The same two rate-ITD functions as in Figure 1, but here they are broken down by the number of trials (separate broadband noise samples) presented to generate the mean response per ITD. The y-axis has units of spikes per second; error bars have been left out for visual clarity. Note that the tuning in the ICcc neurons is present immediately but only begins to be apparent with five trials per ITD for the NL neuron.
To quantify the observations illustrated in Figure 2, we compared the correlation coefficients between rn, the rate-ITD function generated using n trials per ITD (n varying from 1 to 9), and r10, the rate-ITD function generated with the full set of 10 trials (see Materials and Methods) (Fig. 3a,b). In ICcc, good correlation was seen even between r1 and r10 (median, 0.88). This correlation was significantly better than the corresponding correlation in NL (median, 0.58; difference significant by Kruskal–Wallis test at p < 10−6). The median value of n necessary to see a correlation between rn and r10 of >0.9 was 2 in ICcc and 6 in NL (Kruskal-Wallis test, p < 10−6) (Fig. 3c), indicating that fewer trials per ITD are necessary in ICcc to acquire coherent tuning.
Figure 3.
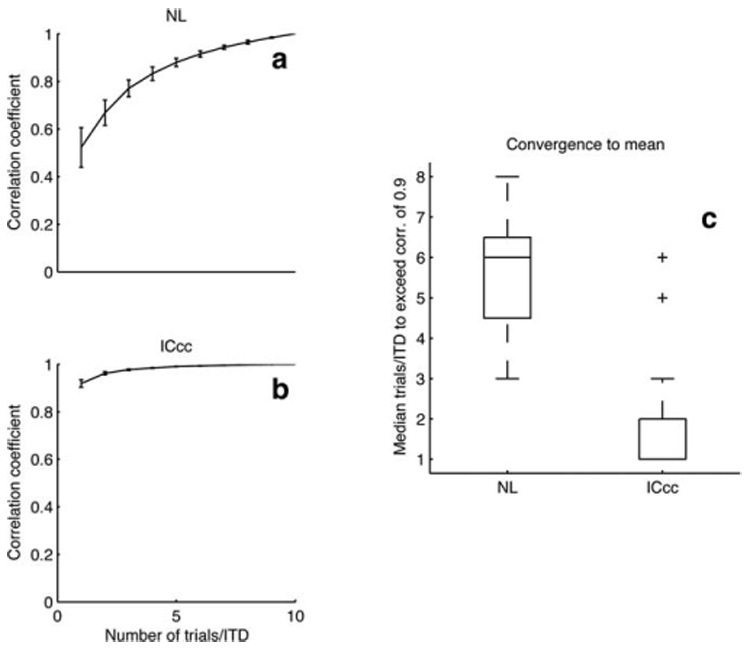
a,b, Examples of convergence curves for NL (a) and ICcc (b) using the same neurons as in Figure 1. In ICcc, the correlation between a single-trial estimate of the rate-ITD function and the full rate-ITD function is very high. Conversely, the correlation observed in NL is much lower to begin with and only slowly rises toward the asymptote at 1. Error bars are SDs produced by Monte Carlo resampling. c, Population data (see Results). Boxes extend from lower quartile to upper quartile of the sample, with the center line marking the median. Outliers (+) are data points >1.5 times the interquartile range of the sample.
In this analysis, we used an extreme range of ITDs that greatly exceeds the physiological range. This raises concerns that the difference in tuning might reflect only changes in the response functions at large ITDs and hence not be of behavioral relevance. To address this point, we redid the analysis and considered only ITDs in the range of ±200 µs. Both measures remained significantly different between the two nuclei at p < 10−6, indicating that this result is not an artifact of the long-range rate-ITD functions.
Dynamic range
Figure 1 suggests that there is also a difference in dynamic ranges between NL and ICcc neurons. This observation is borne out by Figure 4a. The median dynamic range (defined as the difference between maximum and minimum values of the rate-ITD function) of the 28 ICcc neurons examined was 161 spikes/s compared with 65.7 spikes/s, the median of 31 NL neurons (significant at p < 10−3, Kruskal-Wallis test).
Figure 4.
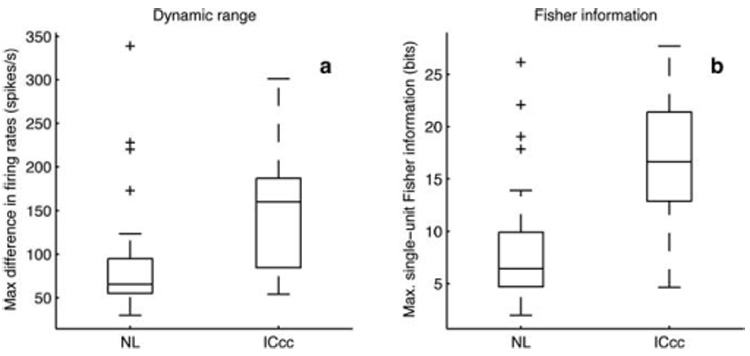
a, Dynamic ranges. Dynamic range was defined as the maximum difference in firing rates through a rate-ITD function. b, Maximum single-unit Fisher information. Box plots as in Figure 3.
Although the dynamic ranges were different, the dependence of variance on mean firing rate appears to be the same in both NL and ICcc (regression slopes not different, p > 0.1; data not shown). An increase in dynamic range and hence in the slope of the response function, when combined with a similar degree of variability, intuitively suggests that the rate-ITD functions of ICcc neurons will provide a finer discrimination of nearby ITDs. Mathematically, this idea can be expressed by the Fisher information (see Materials and Methods) (Dayan and Abbott, 2001). Estimating the single-unit Fisher information index, we obtain the population data of Figure 4b. The ICcc neurons have higher single-unit Fisher information indexes, and hence a better ability to resolve nearby ITDs, than the NL neurons ( p < 5 × 10⁻⁶, Kruskal-Wallis test).
Rectification of the response
In a majority of the neurons of ICcc, we observed some degree of rectification (Fig. 5). In other words, for most of the ICcc neurons, the response for the largest ITDs was less than the midpoint between maximal and minimal responses. Conversely, relatively few of the NL neurons showed any rectification (Fig. 6). To quantify this, we introduced the RI (see Materials and Methods). If a rate-ITD function is normalized to have values between 0 and 1, then the mean firing rate of the largest ITDs in an unrectified curve should be 0.5.
Figure 5.
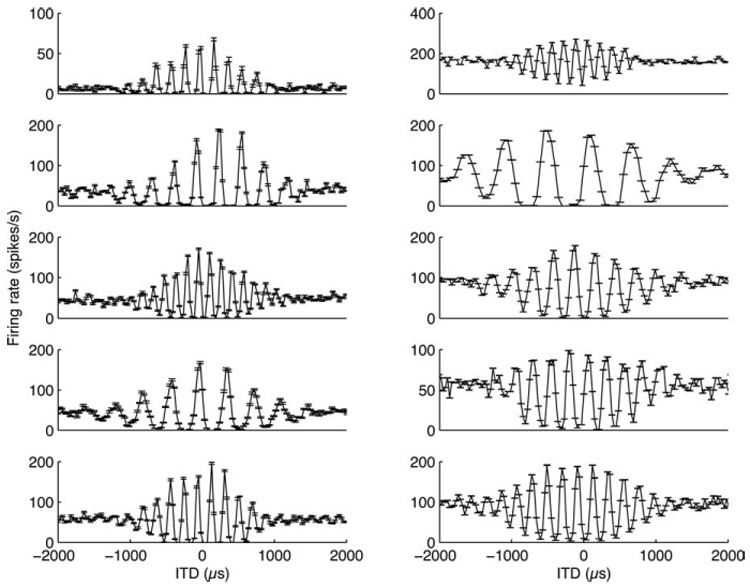
Eight neurons from ICcc illustrating the range of observed rectification. Not all neurons (right column) displayed rectification but, in a majority of them, there was a pronounced effect.
Figure 6.
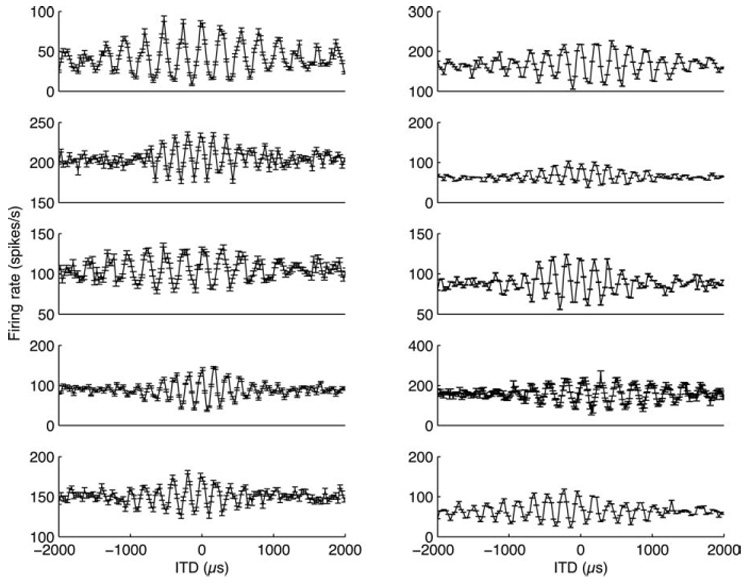
Eight neurons from NL illustrating the range of observed rectification. Rectification was less prominent in NL.
The results of the RI analysis are shown in Figure 7. The distribution for NL neurons is tightly clustered around an RI of 0.5. In contrast, the ICcc population is skewed to lower RIs, indicative of a tendency toward rectification in the population distribution (population medians different by Kruskal-Wallis test, p < 10−4).
Figure 7.
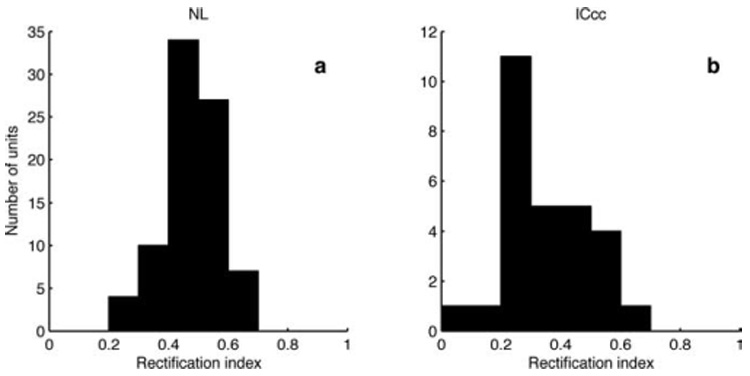
Histograms of the RI for 82 NL neurons (a) and 28 ICcc neurons (b); previously collected NL neurons using stimuli of 50 ms for the rate-ITD function were included in this analysis. Median RI of the NL neurons, 0.481; median of the ICcc neurons, 0.323.
Discussion
A basic concept in theoretical neuroscience is the idea of pooling across a population of noisy inputs to achieve a more reliable measure of the encoded variable. This appears to be the computation that ICcc neurons are performing. There are few other demonstrations of a neural processing stage devoted to noise reduction. Phase locking in the auditory system improves from the auditory nerve to the anteroventral cochlear nucleus of the cat (Joris et al., 1994a,b), which has been modeled using both a summative mechanism (Kuhlmann et al., 2002) and a coincidence detection mechanism (Carney, 1992); a similar decrease in temporal jitter is seen from the electroreceptors to the midbrain torus of Eigenmannia (Carr et al., 1986). Retinal ganglion cells also improve on photoreceptor noise levels, using mechanisms such as temporal or spatial summation (Aho et al., 1993; Warrant, 1999), lateral inhibition (Srinivasan et al., 1982; Balboa and Grzywacz, 2000), and channel properties (Dhingra et al., 2005; Ichinose et al., 2005). All of these examples occur within two synapses of their respective sensory receptor. ICcc appears to be unusual for both its distance from the sensory receptors and its operation on a derived signal rather than unprocessed sensory information.
The information processing inequality (Cover and Thomas, 1991) states that no operation can increase the amount of information present in the inputs; therefore, our results indicate that there is a convergence of NL afferents onto ICcc neurons. Even under the simplest mechanistic hypothesis of some linear combination of NL inputs, a prediction based on the difference in dynamic range as shown in Figure 4a would likely underestimate the degree of convergence. As Figure 5–Figure 7 illustrate, there is a degree of rectification in the rate-ITD functions of ICcc that is not present in the NL functions. If we consider the theoretical dynamic range of the unrectified function, then it will exceed the actual dynamic range by a factor of nearly 2. A consequence of this rectification is the possibility of obfuscation of ITDs in the troughs. As can be seen in a few of the examples of Figure 5, some ranges of unfavorable ITDs are all encoded with a firing rate of 0. The conclusion is that ICcc neurons combine a large number of inputs from NL to ensure that changes in ITD within the owl’s physiological range induce firing rate fluctuations that extend over the majority of the dynamic range of the neurons, even at the expense of rectification attributable to thresholding.
Current theoretical work has tended to emphasize that it is population coding, and not the information carried by single units, that is of primary salience in neural codes (Panzeri et al., 1999; Dayan and Abbott, 2001; Sahani and Dayan, 2003; Johnson and Ray, 2004; Latham and Nirenberg, 2005). By this reasoning, it is not clear what benefit the system gains by doing this pooling for noise reduction explicitly within ICcc as opposed to performing it at the same time as the frequency convergence or the emergence of combination selectivity to ITD and ILD that takes place later in the pathway (Takahashi and Konishi, 1986). One possible implication is that it is important to have an accurate estimate of the ITD alone within a narrow frequency band before integrating across frequency channels. It is known that ICcc projects not only to the lateral shell of the inferior colliculus but also directly to the thalamus (Proctor and Konishi, 1997; Cohen et al., 1998). Because the thalamus also receives projections from the lateral shell, there is no a priori reason based solely on considerations of sound localization to require a thalamic projection from ICcc. That such a projection does exist suggests a particular role for band-limited ITD information in the thalamic processing stream. Because interaural correlation, which is the basis of ITD detection, will be influenced not only by the location of the sound in space but by features of the acoustic environment, such as the presence of echoes, the existence of multiple sound sources, and distorting effects of the environment, it is plausible that it plays some role in nonlocalization perceptual tasks. Additionally, work in the lateral shell has suggested that frequency convergence is a gradual process, occurring in a cascade of neurons that terminates in the true space-specific neurons of the external nucleus of the inferior colliculus (ICx) rather than in a single step (Mazer, 1995). There may be a biophysical constraint on the number of inputs that can be managed by a single lateral shell neuron that requires that noise reduction in the ITD domain occurs before any process of frequency convergence begins.
A similar relay is also seen in mammalian systems, from the homolog to NL, the medial superior olive (MSO), to the central nucleus of the inferior colliculus (ICc). Because mammals do not use ITDs as spatial cues for high frequencies, they do not need to integrate across frequency channels to address phase ambiguity, but it has been argued that pooling of ICc units does occur based on psychophysical evidence (Hancock and Delgutte, 2004); this model would place ICc in a stage of processing analogous to the position of ICcc. Additionally, Fitzpatrick et al. (1997) showed a sharpening of rate-ITD functions from neurons in the superior olivary complex to the inferior colliculus and auditory thalamus. The results of Fitzpatrick et al. are consistent with our reports of rectification, although they did not rule out the possibility that they could be explained by frequency convergence; they also make no prediction regarding the decrease in noise or the increase in dynamic range. Together, the work of Hancock and Delgutte (2004) and that of Fitzpatrick et al. (1997) suggest that the mammalian ICc may serve the same function as ICcc. At the same time, the frequencies relevant to ITD detection used by mammals are significantly lower than those examined in this study, and there is clear entrainment of MSO responses to a single cycle of a binaural beat stimulus (Yin and Chan, 1990). Thus, it may be that additional noise reduction is not necessary.
The question also arises why this noise reduction must be done after NL or equivalently why the NL neurons are noisy. It seems likely that the neurons of NL are already performing near the neural limits for coincidence detection. The temporal jitter of the inputs is significant compared with the stimulus period at the frequencies involved (Köppl, 1997), and the timescales of the coincidences require specialized neurons with fast time constants (Han and Colburn, 1993; Gerstner et al., 1996). Under these conditions, greater reliability may not be possible within the co-incidence detectors themselves, requiring that an additional stage of processing perform the necessary pooling. Models of both NL (Gerstner et al., 1996; Agmon-Snir et al., 1998) and MSO (Brand et al., 2002; Zhou et al., 2005) seem to demonstrate greater dynamic ranges and less overall noise than what we observe in NL; this is likely because the dearth of available NL and MSO data had led to some aspects of the models being based on data from ICcc and ICc. If this is the case, then the models are in effect trying to accomplish with a single neuron what the auditory system accomplishes with several.
One possible mechanism that could accomplish this noise reduction would be averaging. However, strictly speaking, averaging suggests that the dynamic range of the averaging unit should be on the same order as the dynamic range of its inputs, and the dynamic range is in fact larger in ICcc than in NL. This increase may serve to accelerate the process of frequency convergence that occurs in the next stage of the sound localization pathway (Mazer, 1998). The premise of frequency convergence, confirmed in the nucleus ICx (Takahashi and Konishi, 1986), includes summation in the ITD domain (Takahashi and Konishi, 1986; Mori, 1997; Mazer, 1998) with thresholding to eliminate peaks that do not correspond to the true ITD (Peña and Konishi, 2000, 2002). This process is influenced by the absolute magnitude of the component rate-ITD functions: the larger their initial amplitude, the larger the absolute difference between true and secondary peaks in the summed function will be, simplifying the task to be accomplished by threshold (Fig. 8).
Figure 8.
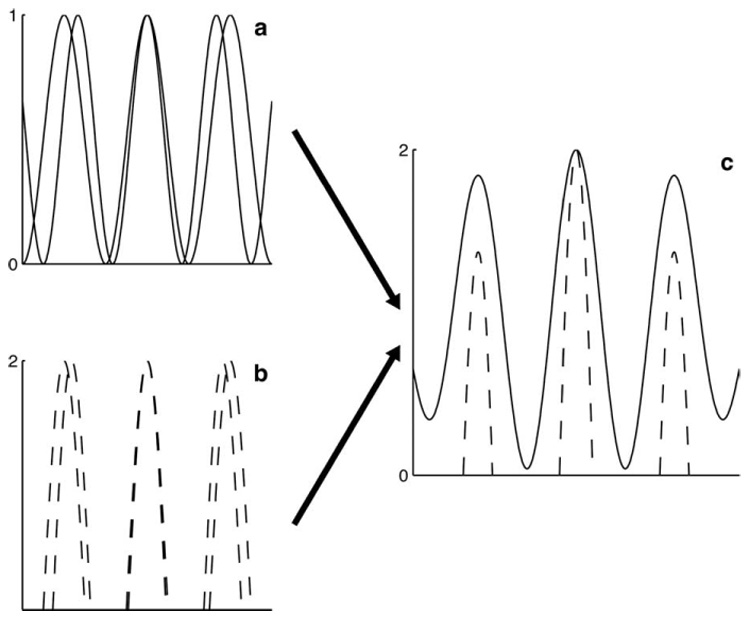
A schematic to illustrate the effects of dynamic range on frequency convergence. In a, two cosines of different frequencies are plotted. In b, the same cosines are plotted, but the dynamic range has been increased by a factor of 2. In addition, the cosines have been half-wave rectified, which means that the dynamic range of the underlying cosines is effectively greater by a factor of 4. c, The curves of a and b have been summed and plotted on the same axes, with the result of the sum of b (dashed line) shifted to have the same peak as the sum of a (solid line) and then clipped to match the same dynamic range. Although the same frequency components were used for both sums, the side peaks of the sum of b are considerably more suppressed than the side peaks of a.
It has been shown that the owl can localize sounds as short as 10 ms in duration (Konishi, 1973). Our results indicate that there is a move toward reliable short timescale ITD encoding on a single neuron level within the sound localization pathway. The spiking response of neurons of the ICx, which feature low firing rates with little or no sustained response (Wagner, 1990; Peña and Konishi, 2000, 2002), represents the culmination of this trend, and it has been reported that single ICx neurons can in fact match the behavioral performance (Bala et al., 2003). Experiments in ICx have indicated that summation and thresholding of inputs is a crucial component of the neuronal computation of space specificity (Peña and Konishi, 2000, 2002). The computations in ICcc provide a necessary basis for this, with the amplification of dynamic range and the reduction of noise working together to ensure that only the desired portions of the ITD response will exceed threshold.
Acknowledgments
This work was supported by National Institutes of Health Grants DC00134 and DC007690-01. We thank M. Konishi for his invaluable support and B. Fisher, F. Gabbiani, H. S. Colburn, and two anonymous reviewers for their feedback.
Footnotes
Publisher's Disclaimer: This PDF receipt will only be used as the basis for generating PubMed Central (PMC) documents. PMC documents will be made available for review after conversion (approx. 2–3 weeks time). Any corrections that need to be made will be done at that time. No materials will be released to PMC without the approval of an author. Only the PMC documents will appear on PubMed Central -- this PDF Receipt will not appear on PubMed Central.
References
- Agmon-Snir H, Carr CE, Rinzel J. The role of dendrites in auditory coincidence detection. Nature. 1998;393:268–272. doi: 10.1038/30505. [DOI] [PubMed] [Google Scholar]
- Aho AC, Donner K, Helenius S, Larsen LO, Reuter T. Visual performance of the toad (Bufo bufo) at low-light levels: retinal ganglion-cell responses and prey-catching accuracy. J Comp Physiol A Neuroethol Sens Neural Behav Physiol. 1993;172:671–682. doi: 10.1007/BF00195393. [DOI] [PubMed] [Google Scholar]
- Arthur BJ. Sensitivity to spectral interaural intensity difference cues in space-specific neurons of the barn owl. J Comp Physiol A Neuroethol Sens Neural Behav Physiol. 2004;190:91–104. doi: 10.1007/s00359-003-0476-1. [DOI] [PubMed] [Google Scholar]
- Bala ADS, Spitzer MW, Takahashi TT. Prediction of auditory spatial acuity from neural images on the owl’s auditory space map. Nature. 2003;424:771–774. doi: 10.1038/nature01835. [DOI] [PubMed] [Google Scholar]
- Balboa RM, Grzywacz NM. The role of early retinal lateral inhibition: more than maximizing luminance information. Vis Neurosci. 2000;17:77–89. doi: 10.1017/s0952523800171081. [DOI] [PubMed] [Google Scholar]
- Bonifazi P, Ruaro ME, Torre V. Statistical properties of information processing in neuronal networks. Eur J Neurosci. 2005;22:2953–2964. doi: 10.1111/j.1460-9568.2005.04464.x. [DOI] [PubMed] [Google Scholar]
- Brand A, Behrend O, Marquardt T, McAlpine D, Grothe B. Precise inhibition is essential for microsecond interaural time difference coding. Nature. 2002;417:543–547. doi: 10.1038/417543a. [DOI] [PubMed] [Google Scholar]
- Carney LH. Modelling the sensitivity of cells in the anteroventral cochlear nucleus to spatiotemporal discharge patterns. Philos Trans R Soc Lond B Biol Sci. 1992;336:403–406. doi: 10.1098/rstb.1992.0075. [DOI] [PubMed] [Google Scholar]
- Carr CE, Konishi M. A circuit for detection of interaural time differences in the brain stem of the barn owl. J Neurosci. 1990;10:3227–3246. doi: 10.1523/JNEUROSCI.10-10-03227.1990. [DOI] [PMC free article] [PubMed] [Google Scholar]
- Carr CE, Heiligenberg W, Rose GJ. A time-comparison circuit in the electric fish midbrain. I. Behavior and physiology. J Neurosci. 1986;6:107–119. doi: 10.1523/JNEUROSCI.06-01-00107.1986. [DOI] [PMC free article] [PubMed] [Google Scholar]
- Cohen YE, Miller GL, Knudsen EI. Forebrain pathway for auditory space processing in the barn owl. J Neurophysiol. 1998;79:891–902. doi: 10.1152/jn.1998.79.2.891. [DOI] [PubMed] [Google Scholar]
- Cover TM, Thomas JA. Elements of information theory. New York: Wiley; 1991. [Google Scholar]
- Dayan P, Abbott LF. Theoretical neuroscience: computational and mathematical modeling of neural systems. Cambridge, MA: MIT; 2001. [Google Scholar]
- Dean I, Harper NS, McAlpine D. Neural population coding of sound level adapts to stimulus statistics. Nat Neurosci. 2005;8:1684–1689. doi: 10.1038/nn1541. [DOI] [PubMed] [Google Scholar]
- DeAngelis GC, Ghose GM, Ohzawa I, Freeman RD. Functional micro-organization of primary visual cortex: receptive field analysis of nearby neurons. J Neurosci. 1999;19:4046–4064. doi: 10.1523/JNEUROSCI.19-10-04046.1999. [DOI] [PMC free article] [PubMed] [Google Scholar]
- Dhingra NK, Freed MA, Smith RG. Voltage-gated sodium channels improve contrast sensitivity of a retinal ganglion cell. J Neurosci. 2005;25:8097–8103. doi: 10.1523/JNEUROSCI.1962-05.2005. [DOI] [PMC free article] [PubMed] [Google Scholar]
- Fitzpatrick DC, Batra R, Stanford TR, Kuwada S. A neuronal population code for sound localization. Nature. 1997;388:871–874. doi: 10.1038/42246. [DOI] [PubMed] [Google Scholar]
- Gerstner W, Kempter R, van Hemmen JL, Wagner H. A neuronal learning rule for sub-millisecond temporal coding. Nature. 1996;383:76–78. doi: 10.1038/383076a0. [DOI] [PubMed] [Google Scholar]
- Han Y, Colburn HS. Point-neuron model for binaural interaction in MSO. Hear Res. 1993;68:115–130. doi: 10.1016/0378-5955(93)90070-h. [DOI] [PubMed] [Google Scholar]
- Hancock KE, Delgutte B. A physiologically based model of interaural time difference discrimination. J Neurosci. 2004;24:7110–7117. doi: 10.1523/JNEUROSCI.0762-04.2004. [DOI] [PMC free article] [PubMed] [Google Scholar]
- Ichinose T, Shields CR, Lukasiewicz PD. Sodium channels in transient retinal bipolar cells enhance visual responses in ganglion cells. J Neurosci. 2005;25:1856–1865. doi: 10.1523/JNEUROSCI.5208-04.2005. [DOI] [PMC free article] [PubMed] [Google Scholar]
- Johnson DH, Ray W. Optimal stimulus coding by neural populations using rate codes. J Comput Neurosci. 2004;16:129–138. doi: 10.1023/B:JCNS.0000014106.09948.83. [DOI] [PubMed] [Google Scholar]
- Joris PX, Carney LH, Smith PH, Yin TCT. Enhancement of neural synchronization in the anteroventral cochlear nucleus. I. Responses to tones at the characteristic frequency. J Neurophysiol. 1994a;71:1022–1036. doi: 10.1152/jn.1994.71.3.1022. [DOI] [PubMed] [Google Scholar]
- Joris PX, Smith PH, Yin TCT. Enhancement of neural synchronization in the anteroventral cochlear nucleus. II. Responses in the tuning curve tail. J Neurophysiol. 1994b;71:1037–1051. doi: 10.1152/jn.1994.71.3.1037. [DOI] [PubMed] [Google Scholar]
- Kenyon GT, Theiler J, George JS, Travis BJ, Marshak DW. Correlated firing improves stimulus discrimination in a retinal model. Neural Comput. 2004;16:2261–2291. doi: 10.1162/0899766041941916. [DOI] [PubMed] [Google Scholar]
- Konishi M. How the owl tracks its prey. Am Sci. 1973;61:414–424. [Google Scholar]
- Köppl C. Phase locking to high frequencies in the auditory nerve and cochlear nucleus magnocellularis of the barn owl, Tyto alba. J Neurosci. 1997;17:3312–3321. doi: 10.1523/JNEUROSCI.17-09-03312.1997. [DOI] [PMC free article] [PubMed] [Google Scholar]
- Kuhlmann L, Burkitt AN, Paolini A, Clark GM. Summation of spatiotemporal input patterns in leaky integrate-and-fire neurons: application to neurons in the cochlear nucleus receiving converging auditory nerve fiber input. J Comput Neurosci. 2002;12:55–73. doi: 10.1023/a:1014994113776. [DOI] [PubMed] [Google Scholar]
- Latham PE, Nirenberg S. Synergy, redundancy, and independence in population codes, revisted. J Neurosci. 2005;25:5195–5206. doi: 10.1523/JNEUROSCI.5319-04.2005. [DOI] [PMC free article] [PubMed] [Google Scholar]
- Mar DJ, Chow CC, Gerstner W, Adams RW, Collins JJ. Noise shaping in populations of coupled model neurons. Proc Natl Acad Sci USA. 1999;96:10450–10455. doi: 10.1073/pnas.96.18.10450. [DOI] [PMC free article] [PubMed] [Google Scholar]
- Masuda N, Aihara K. Ergodicity of spike trains: when does trial averaging make sense? Neural Comput. 2003;15:1341–1372. doi: 10.1162/089976603321780308. [DOI] [PubMed] [Google Scholar]
- Mazer JA. PhD thesis. California Institute of Technology; 1995. Integration of parallel processing streams in the inferior colliculus of the barn owl. [Google Scholar]
- Mazer JA. How the owl resolves auditory coding ambiguity. Proc Natl Acad Sci USA. 1998;95:10932–10937. doi: 10.1073/pnas.95.18.10932. [DOI] [PMC free article] [PubMed] [Google Scholar]
- Mazurek ME, Shadlen MN. Limits to the temporal fidelity of cortical spike rate signals. Nat Neurosci. 2002;5:463–471. doi: 10.1038/nn836. [DOI] [PubMed] [Google Scholar]
- Moiseff A, Konishi M. Binaural characteristics of units in the owl’s brainstem auditory pathway: precursors of restricted spatial receptive fields. J Neurosci. 1983;3:2553–2562. doi: 10.1523/JNEUROSCI.03-12-02553.1983. [DOI] [PMC free article] [PubMed] [Google Scholar]
- Mori K. Across-frequency nonlinear inhibition by GABA in processing of interaural time difference. Hear Res. 1997;111:22–30. doi: 10.1016/s0378-5955(97)00090-7. [DOI] [PubMed] [Google Scholar]
- Panzeri S, Treves A, Schultz S, Rolls ET. On decoding the responses of a population of neurons from short time windows. Neural Comput. 1999;11:1553–1577. doi: 10.1162/089976699300016142. [DOI] [PubMed] [Google Scholar]
- Parker AJ, Newsome WT. Sense and the single neuron: probing the physiology of perception. Annu Rev Neurosci. 1998;21:227–277. doi: 10.1146/annurev.neuro.21.1.227. [DOI] [PubMed] [Google Scholar]
- Peña JL, Konishi M. Cellular mechanisms for resolving phase ambiguity in the owl’s inferior colliculus. Proc Natl Acad Sci USA. 2000;97:11787–11792. doi: 10.1073/pnas.97.22.11787. [DOI] [PMC free article] [PubMed] [Google Scholar]
- Peña JL, Konishi M. From postsynaptic potentials to spikes in the genesis of auditory spatial receptive fields. J Neurosci. 2002;22:5652–5658. doi: 10.1523/JNEUROSCI.22-13-05652.2002. [DOI] [PMC free article] [PubMed] [Google Scholar]
- Peña JL, Viete S, Albeck Y, Konishi M. Tolerance to sound intensity of binaural coincidence detection in the nucleus laminaris of the owl. J Neurosci. 1996;16:7046–7054. doi: 10.1523/JNEUROSCI.16-21-07046.1996. [DOI] [PMC free article] [PubMed] [Google Scholar]
- Peña JL, Viete S, Funabiki K, Saberi K, Konishi M. Cochlear and neural delays for coincidence detection in owls. J Neurosci. 2001;21:9455–9459. doi: 10.1523/JNEUROSCI.21-23-09455.2001. [DOI] [PMC free article] [PubMed] [Google Scholar]
- Proctor L, Konishi M. Representation of sound localization cues in the auditory thalamus of the barn owl. Proc Natl Acad Sci USA. 1997;94:10421–10425. doi: 10.1073/pnas.94.19.10421. [DOI] [PMC free article] [PubMed] [Google Scholar]
- Rieke F, Warland D, de Ruyter van Steveninck RR, Bialek W. Spikes: exploring the neural code. Cambridge, MA: MIT; 1997. [Google Scholar]
- Ronacher B, Franz A, Wohlgemuth S, Hennig RM. Variability of spike trains and the processing of temporal patterns of acoustic signals-problems, constraints, and solutions. J Comp Physiol A Neuroethol Sens Neural Behav Physiol. 2004;190:257–277. doi: 10.1007/s00359-004-0494-7. [DOI] [PubMed] [Google Scholar]
- Sahani M, Dayan P. Doubly distributional population codes: simultaneous representation of uncertainty and multiplicity. Neural Comput. 2003;15:2255–2279. doi: 10.1162/089976603322362356. [DOI] [PubMed] [Google Scholar]
- Shadlen MN, Newsome WT. The variable discharge of cortical neurons: Implications for connectivity, computation, and information coding. J Neurosci. 1998;18:3870–3896. doi: 10.1523/JNEUROSCI.18-10-03870.1998. [DOI] [PMC free article] [PubMed] [Google Scholar]
- Softky WR, Koch C. The highly irregular firing of cortical cells is inconsistent with temporal integration of random EPSPs. J Neurosci. 1993;13:334–350. doi: 10.1523/JNEUROSCI.13-01-00334.1993. [DOI] [PMC free article] [PubMed] [Google Scholar]
- Srinivasan MV, Laughlin SB, Dubs A. Predictive coding: a fresh view of inhibition in the retina. Proc R Soc Lond B Biol Sci. 1982;216:427–459. doi: 10.1098/rspb.1982.0085. [DOI] [PubMed] [Google Scholar]
- Sullivan WE, Konishi M. Segregation of stimulus phase and intensity coding in the cochlear nucleus of the barn owl. J Neurosci. 1984;4:1787–1799. doi: 10.1523/JNEUROSCI.04-07-01787.1984. [DOI] [PMC free article] [PubMed] [Google Scholar]
- Takahashi TT, Konishi M. Selectivity for interaural time difference in the owl’s midbrain. J Neurosci. 1986;6:3413–3422. doi: 10.1523/JNEUROSCI.06-12-03413.1986. [DOI] [PMC free article] [PubMed] [Google Scholar]
- Takahashi TT, Konishi M. Projections of the cochlear nuclei and nucleus laminaris to the inferior colliculus of the barn owl. J Comp Neurol. 1988a;274:190–211. doi: 10.1002/cne.902740206. [DOI] [PubMed] [Google Scholar]
- Takahashi TT, Konishi M. Projections of nucleus angularis and nucleus laminaris to the lateral lemniscal nuclear complex of the barn owl. J Comp Neurol. 1988b;274:212–238. doi: 10.1002/cne.902740207. [DOI] [PubMed] [Google Scholar]
- Takahashi TT, Moiseff A, Konishi M. Time and intensity cues are processed independently in the auditory system of the owl. J Neurosci. 1984;4:1781–1786. doi: 10.1523/JNEUROSCI.04-07-01781.1984. [DOI] [PMC free article] [PubMed] [Google Scholar]
- Vogels R, Spileers W, Orban GA. The response variability of striate cortical neurons in the behaving monkey. Exp Brain Res. 1989;77:432–436. doi: 10.1007/BF00275002. [DOI] [PubMed] [Google Scholar]
- Wagner H. Receptive fields of neurons in the owl’s auditory brainstem change dynamically. Eur J Neurosci. 1990;2:949–959. doi: 10.1111/j.1460-9568.1990.tb00007.x. [DOI] [PubMed] [Google Scholar]
- Wagner H, Takahashi T, Konishi M. Representations of interaural time difference in the central nucleus of the barn owl’s inferior colliculus. J Neurosci. 1987;7:3105–3116. doi: 10.1523/JNEUROSCI.07-10-03105.1987. [DOI] [PMC free article] [PubMed] [Google Scholar]
- Wagner H, Mazer JA, von Campenhausen M. Response properties of neurons in the core of the central nucleus of the inferior colliculus of the barn owl. Eur J Neurol. 2002;15:1343–1352. doi: 10.1046/j.1460-9568.2002.01970.x. [DOI] [PubMed] [Google Scholar]
- Warrant EJ. Seeing better at night: life style, eye design and the optimum strategy of spatial and temporal summation. Vision Res. 1999;39:1611–1630. doi: 10.1016/s0042-6989(98)00262-4. [DOI] [PubMed] [Google Scholar]
- Wild JM, Kubke MF, Carr CE. Tonotopic and somatotopic representation in the nucleus basalis of the barn owl, Tyto alba. Brain Behav Evol. 2001;57:39–62. doi: 10.1159/000047225. [DOI] [PubMed] [Google Scholar]
- Yin TCT, Chan JCK. Interaural time sensitivity in medial superior olive of cat. J Neurophysiol. 1990;64:465–488. doi: 10.1152/jn.1990.64.2.465. [DOI] [PubMed] [Google Scholar]
- Zhou Y, Carney LH, Colburn HS. A model for interaural time difference sensitivity in the medial superior olive: interaction of excitatory and inhibitory synaptic inputs, channel dynamics, and cellular morphology. J Neurosci. 2005;25:3046–3058. doi: 10.1523/JNEUROSCI.3064-04.2005. [DOI] [PMC free article] [PubMed] [Google Scholar]


