

Abstract
Purpose:
Operable thoracic esophageal/gastroesophageal junction carcinoma (EC) is often treated with chemoradiation and surgery but tumor responses are unpredictable and heterogeneous. We hypothesized that aldehyde dehydrogenase-1 (ALDH-1) could be associated with response.
Methods:
The labeling indices (LIs) of ALDH-1 by immunohistochemistry in untreated tumor specimens were established in EC patients who had chemoradiation and surgery. Univariate logistic regression and 3-fold cross validation were carried out for the training (67% of patients) and validation (33%) sets. Non-clinical experiments in EC cells were performed to generate complimentary data.
Results:
Of 167 EC patients analyzed, 40 (24%) had a pathologic complete response (pathCR) and 27 (16%) had an extremely resistant (exCRTR) cancer. The median ALDH-1 LI was 0.2 (range, 0.01 to 0.85). There was a significant association between pathCR and low ALDH-1 LI (p=<0.001; odds-ratio [OR]=0.432). The 3-fold cross validation led to a concordance index (C-index) of 0.798 for the fitted model. There was a significant association between exCRTR and high ALDH-1 LI (p=<0.001; OR=3.782). The 3-fold cross validation led to the C-index of 0.960 for the fitted model. In several cell lines, higher ALDH-1 LIs correlated with resistant/aggressive phenotype. Cells with induced chemotherapy resistance upregulated ALDH-1 and resistance conferring genes (SOX9 and YAP1). Sorted ALDH-1+ cells were more resistant and had an aggressive phenotype in tumor spheres than ALDH-1− cells.
Conclusions:
Our clinical and non-clinical data demonstrate that ALDH-1 LIs are predictive of response to therapy and further research could lead to individualized therapeutic strategies and novel therapeutic targets for EC patients.
Keywords: Esophageal carcinoma, chemotherapy resistance, radiation resistance, ALDH-1, predictive markers, prognosis
1.0 Introduction
Esophageal cancer (EC) remains a global health problem with more than 600,000 new cases diagnosed each year.1 While the incidence of squamous cell histology has been declining, that of adenocarcinoma of the esophagus and or gastroesophageal junction has been rising at an annual rate of 1.5% since 1998 in the USA.2 Approximately 50% of newly diagnosed patients have local-regional cancer. When feasible, based on the extent of the tumor and co-morbidities, patients with localized thoracic EC are often treated with chemoradiation then surgery (trimodality therapy; TMT),3, 4 because primary surgery5, 6 or preoperative chemotherapy produces lower cure rates.7
One distinct issue with preoperative therapy is that of unpredictability of response to therapy and patient outcome. Approximately 20% of patients achieve a pathologic complete response (defined as no residual cancer cells in the resected specimen; pathCR). Patients with pathCR often have a longer survival8, 9 and have a lower rate distant relapse than those who have <pathCR.10 In ~20% of cases tumor is extremely resistant (defined as ≥50% residual cancer in the surgical specimen; exCRTR).11 One challenge is to predict the outcomes prior to surgery (spare surgery in some cases with pathCR) and another is to predict the possibility of exCRTR prior to chemoradiation (avoid chemoradiation in some, if possible). We have reported a clinical variables model that is associated with pathCR but the specificity and sensitivity of the model was low for clinical implementation.12 Additionally, clinical response after chemoradiation is not associated with pathCR.13 There is not an established biomarker(s) model for clinical implementation.
We focused on aldehyde dehydrogenase-1 (ALDH-1) as a potential biomarker because our prior data suggested that the cancer stem cell (CSC) markers participate in repopulation of resistant EC.14, 15 CSCs are a chemotherapy-resistant population capable of self-renewal.16ALDH-1 is a marker of normal and malignant human mammary stem cells and a prognosticator of poor clinical outcome.17 ALDH-1 is highly expressed in the tumorigenic cell population of various cancers including lung, breast,18 ovarian,19 pancreas,20 brain, colon, and head and neck.21 Jiang et al. reported that isolated NSCLC cells with over-expression of ALDH-1 (and CD133) have in vitro features of CSCs, including proliferation, self-renewal, differentiation, and resistance to chemotherapy.22,23 Similarly, ALDH-1 over-expressing ovarian cancer cells that were enriched by CD44 were resistant to chemotherapy.19 In breast carcinomas, high ALDH-1 activity identified tumorigenic cell fraction that could recapitulate the heterogeneity of the parental tumor.17, 24 The association of ALDH-1 with chemotherapy-resistance has been reported in mantle cell lymphoma25 and pancreatic adenocarcinoma.20 In EC, ALDH-1 has been associated with nodal metastases and poor prognosis.26, 27
Our analyses are unique in that we report substantial response to therapy data in a large cohort of EC patient population treated with TMT but most importantly, we report the predictive value of ALDH-1 that has not been reported previously and considerable complementary non-clinical experimental results in EC cells that have not been reported previously.
2.0 Patients and Methods
2.1 Patient population
Eligible patients had to have a histologic documentation of the adenocarcinoma or squamous cell carcinoma of the thoracic EC. In addition, patients were required to have complete clinical staging to include baseline endoscopic ultrasonography, computerized tomography of the chest and abdomen, complete blood count, serum chemistries, pulmonary function studies, and electrocardiogram. All patients were evaluated and discussed by the multidisciplinary team (comprising of various specialties: gastroenterology, pathology, medical oncology, radiation oncology, thoracic surgery, and others). All patients were a priori deemed eligible for and later completed TMT. The surgical specimen of each patient was scored by previously published methods11, 28 and designated as: pathCR, some response, or exCRTR. We focused on the two extremes of response (pathCR and exCRTR).
2.2 Trimodality therapy
All patients received 50.4 Gy of radiation in 28 fractions. Concurrent chemotherapy included a fluoropyrimidine plus either a platinum compound or taxane. Approximately 6 weeks after the completion of chemoradiation, patients underwent a preoperative work-up to include imaging studies, blood tests, and upper endoscopy with biopsies. Surgery ensued. The type of surgery to be performed (Ivor-Lewis, transhiatal, or other) was at the discretion of the primary surgeon.
2.3 Follow-up of patients
After surgery, patients were followed periodically for 5 years or until death. Survival data were collected from our Tumor Registry, medical records, or the Social Security Database.
2.4 Tissue collection and analysis
Untreated tumor biopsies for research purposes were collected under an Institutional Review Board approved ongoing banking protocol at our institution. Research studies were performed under another approved protocol. Histology was confirmed in the corresponding adjacent section prior to ALDH-1 staining. All tissue sections were 4-μm in thickness and numerically adjacent. Staining was performed using Abcam ab23375 antibody, rabbit polyclonal at 1:100 dilution. Positive controls were placed on all tissue sections and consisted of FFPE cell pellets of cell lines known to overexpress ALDH-1. Negative controls were used as well. Two members of the team, without prior knowledge of patient outcome, independently scored each tumor to establish the average labeling index. Procedure was in place for discordant cases to be jointly reviewed under a double-headed microscope. Minimum of 200 and maximum of 400 tumor cells were counted in highest scoring region(s). Results were then submitted for analysis to our biostatisticians.
2.5 Cells and reagents
The human esophageal adenocarcinoma cell lines FLO-1, BE3, SKGT-4, JHESO and OACP (provided by Drs. Raju and Hung, both at our institution).29, 30 All cell lines are authorized and re-characterized in the core facility every 6 months. Cells were cultured in DMEM supplemented with 10% fetal bovine serum (FBS) and antibiotics (100 mg/mL streptomycin and 100 IU/mL of penicillin). 5-FU and docetaxel were purchased from Sigma Chemical Co. (St. Louis, MO). Antibodies ALDH-1 and Shh were obtained from Abcam (Cambridge, MA), YAP1 was purchased from Santa Cruz Biotechnology; SOX9 was from were purchased from Chemicon (Billerica, MS), Bcl-2 was obtained from Cell SignalingTechnology (Beverly, MA).
2.6 Flow cytometric labeling and fluorescence-activated cell sorting
ALDH-1 activity was assessed by fluorescence-activated cell sorting in three cell lines (OAPC, JHESO and FLO-1) according to the ALDEFLUOR detection kit following the protocol and Diethylaminobenzaldehyde (DEAB) was used to inhibit ALDH-1 activity to show the specificity of the detection. ALDH-1 positive or negative cells were sorted from JHESO cells by fluorescence-activated cell sorting according to the ALDEFLUOR detection kit. ALDEFLUOR/DEAB treated cells were used to define negative gates. FACS was performed with >1 × 10⁶ cells using the BD FACSCanto II (Becton Dickinson) or FACSAria (Becton Dickinson).
2.7 Tumor sphere formation assay
Sphere culture was performed as previously described.31 Briefly, Single cells or FACS-isolated ALDH-1+ or ALDH-1− cell populations (2500/well) were seeded in triplicate onto a 6-well ultra-low attachment plate (Corning) in serum-free DMEM/F-12 supplemented with 10 ng/ml epidermal growth factor, 5 μg/ml insulin, 0.5 μg/ml hydrocortisonum and bovine pituitary extract (Invitrogen). After 10-14 days of culture, the number of tumor spheres formed (diameter >100 μm) was counted under a microscope.
2.8 Cell proliferation assay
Cell proliferation assays were performed using the CellTiter 96 aqueous nonradioactive cell proliferation assay (MTS) according to the instructions of the manufacturer (Promega Co., Madison, WI). All assays were performed in triplicate and repeated at least three times.
2.9 Protein extraction and western blot analysis
Protein isolation and Western blot analyses were performed as previously described and immunoreactive bands were visualized by chemiluminescence detection.32
2.91 Establishment of 5FU-resistant of EC cells
The 5-FU resistant SKGT-4 and Yes-6 cell lines were generated by continuously culturing the drug-sensitive parental cell lines (SKGT-4 and Yes-6) in medium containing increasing concentrations of 5-FU in a stepwise procedure over 6 months. Resistant cell lines were maintained in the presence of 5-FU. To avoid an influence of 5-FU, all resistant cell lines were cultured in 5-FU–free medium for over 3 weeks before subsequent analysis.
2.92 Statistical Methods
Univariate logistic regression was fit for the binary outcome of pathCR (or exCRTR), where ALDH-1 LI was included as the only covariate. The fitted model was validated through a 3-fold cross validation, where 2/3 of the data set was used as the “training set” and remaining 1/3 served as the “validation set”. This process was repeated 1000 times and the average concordance index was summarized. The concordance index (C-index)33 is a measure for validating the predictive ability of a survival model and ranges between 0 and 1, with higher values indicating better predictive/discriminative models. We also assessed the goodness-of-fit through fitting the model using 1000 bootstrap samples. All statistical analyses were performed in Splus.
3.0 Results
3.1 Patient characteristics
Patient characteristics are shown in Table 1. The majority of patients were men (89%) and had adenocarcinoma histology (96%). Most had baseline T3 or higher tumors (84%) and node positive (61%) disease by endoscopic ultrasound.
Table 1.
Patient Characteristics
| Frequency | |||
| Age (years) | Median | 62 | |
| Range | 27-80 | ||
| Gender | M | 149 | 89.22% |
| F | 18 | 10.78% | |
| Ethnicity | White | 152 | 91.02 |
| Hispanic | 13 | 7.78 | |
| African-American | 2 | 1.20 | |
| Histology | Adeno | 160 | 95.81% |
| SCC | 7 | 4.19% | |
| Tumor grade | Well-diff | 4 | 2.40% |
| Mod diff | 72 | 43.11% | |
| Poorly diff | 91 | 54.49% | |
|
Baseline EUS
T Stage |
Tx | 8 | 4.79% |
| T2 | 19 | 11.38% | |
| T3 | 137 | 82.04% | |
| T4 | 2 | 1.20% | |
| T4b | 1 | 0.60% | |
|
Baseline EUS N
stage |
N0 | 60 | 35.93% |
| N1 | 102 | 61.08% | |
| Nx | 5 | 2.99% | |
| Baseline M | M0 | 155 | 92.81% |
| M1a | 12 | 7.19% | |
|
Induction
Chemo |
Yes | 67 | 40.12 |
| No | 100 | 59.88 | |
| Type of Surgery | Ivor Lewis Esophagectomy | 113 | 67.66 |
| Transhiatal Esophagectomy | 18 | 10.77 | |
| Transthoracic Esophagectomy | 9 | 5.39 | |
| Three-field Esophagectomy | 13 | 7.78 | |
| Minimally Invasive Esophagectomy | 14 | 8.38 | |
| Taxanes * | 96 | ||
| Platinum * | 86 | ||
|
Taxane and
platinum* |
21 |
EUS denotes, endoscopic ultrasonography.
all patients received a fluoropyrimidine (iv or oral)
3.2 Response to chemoradiation
40 (24%) of 167 patients had pathCR, 27 (16%) had exCRTR and the rest had some evidence of response in the surgical specimen.
3.3 Overall and progression-free survival
Of 167 patients, 87 have died. The median overall survival (OS) is 46 months (95% CI: 32.6-79.6). Of 167 patients, 95 have died or experienced relapse. The median progression-free survival time is 28 months (95% CI: 19.5-not estimable).
3.4 Prediction: ALDH-1 labeling indices and response to chemoradiation
Figure 1 shows an example of ALDH-1 staining in untreated tissues of a patient with pathCR and another with exCRTR.
Figure 1.
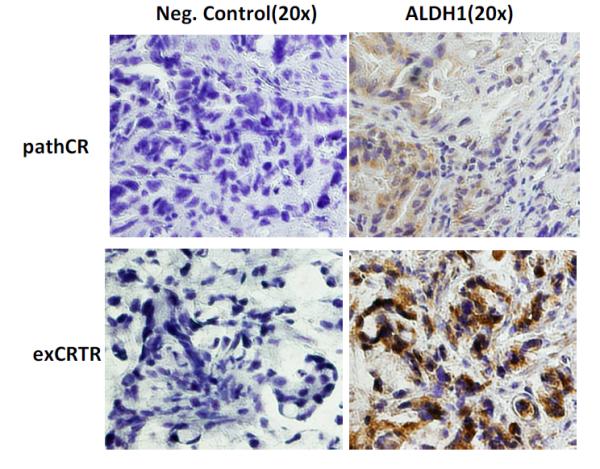
Immunohistochemistry staining of ALDH-1 in untreated EC tumor of a patient with pathCR showing low LI (upper row) and a patient with exCRTR showing high LI (lower row). Abbreviations: pathCR, pathologic complete response; exCRTR, extreme resistance; and LI, labeling index.
For pathCR, the partial residual plot suggested a linear association between ALDH-1 and the logit of pathCR (there was only one outlier with ALDH-1 LI of 0.6). The fitted univariate logistic regression model suggested that higher ALDH-1 LI was associated with lower probability of pathCR (Odds ration [OR]=0.432; p=<0.001). The C-index was 0.797 for the fitted model. The 3-fold cross validation resulted in an average C-index of 0.798. The C-index from 1,000 bootstrap samples was also 0.798. (Figure 2)
Figure 2.
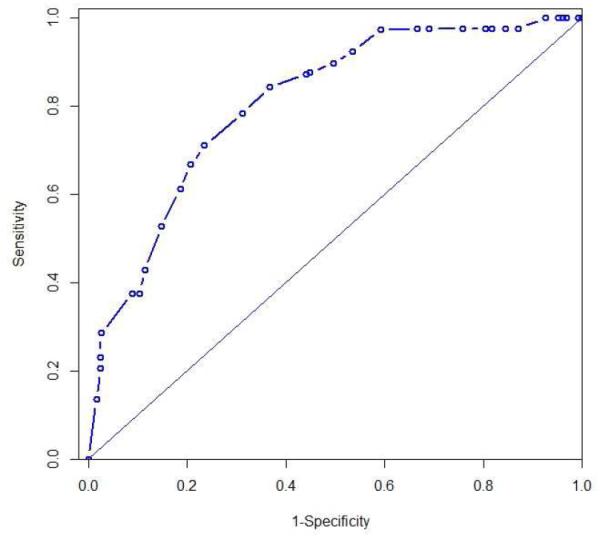
Area under the receiver operating characteristic curve for pathCR (pathologic complete response) with C-index of 0.798)
For exCRTR, the partial residual plot suggested a linear association between ALDH-1 and the probability of exCRTR (there was only one exception with ALDH-1 LI of 0.3). The fitted univariate logistic regression model suggested that higher ALDH-1 is associated with higher logit of achieving exCRTR (OR=3.782; p=<0.001). The C-index was 0.961 for the fitted model. The 3-fold cross validation resulted in an average C-index of 0.961 and it was 0.960 from 1,000 bootstrap samples. (Figure 3)
Figure 3.
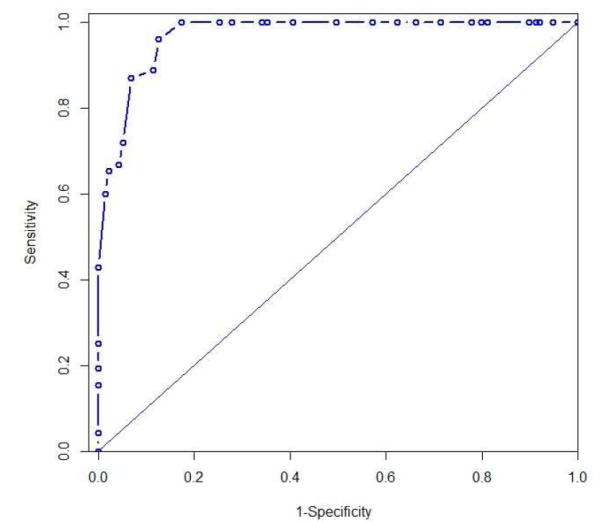
Area under the receiver operating characteristic curve for exCRTR (pathologic extreme resistance) with C-index of 0.960)
3.5 Prognosis: ALDH-1 labeling indices and prognosis of patients
For overall survival, the Martingale residual plot suggested a linear relationship between ALDH-1 LIs and the risk of death. The fitted univariate Cox proportional hazard model suggested that higher ALDH-1 LI was significantly associated with an increased risk of death (Hazard ratio [HR]=3.4; p=0.03).
For progression-free survival, the Martingale residual plot suggested a linear relationship between ALDH-1 Li and the risk of death or relapse. The fitted univariate Cox proportional hazards model suggested that higher ALDH-1 LI was significantly associated with increase risk of death or relapse (HR=3.87; p=0.006). ALDH-1 expression was associated with lymph node metastases.
3.6 ALDH-1 and resistance in cell lines with upregulation of resistance-conferring genes
The proportion of ALDH-1 + cells is high for OAPC cells, medium for JHESO cells and low for FLO-1 cells (Figure 4). FACS analysis demonstrated that the level of ALDH1+ cells in EC cell lines are correlated with response to 5-FU (data shown) and docetaxel (data not shown) treatment. The cells with higher proportion of ALDH-1+ such as OACP and JHESO were more resistant to chemotherapy than FLO-1 cells with lower proportion of ALDH-1+. Correspondingly, stem cell signaling related genes: SOX9, YAP1, Shh and Hes-1 which have been reported as resistance conferring genes are correlated to ALDH1 level as well as response to 5-FU and docetaxel.
Figure 4.

EC cells with high ALDH-1 LIs are resistant to chemotherapy and upregulate resistance-conferring genes. A. ALDH1 activity assessed by fluorescence activated cell sorting in 3 cell lines (FLO-1, JHESO, and OAPC) according to ALDEFLUOR detection kit following the protocol and diethylaminobenzaldehyde (DEAB) was used to inhibit ALDH-1 activity to document the detection specificity. B. Bar graphs demonstrating the percentage of ALDH-1 positive cells in 3 cell lines. C. Immunoblotting of 3 cell lines demonstrates upregulation of resistance conferring CSC genes are more upregulated in cells with higher percentage of ALDH-1. D. 3 cell lines exposed to various concentrations of 5-FU and the degree of response (cells with high percentage of ALDH-1 are more resistant).
ALDH-1 + and − cells were sorted from JHESO cells. ALDH-1+ cells had a higher proliferation rate than ALDH-1− cells. ALDH-1− cells were highly sensitive to 5-FU compared to ALDH-1+ cells (Figure 5).
Figure 5.
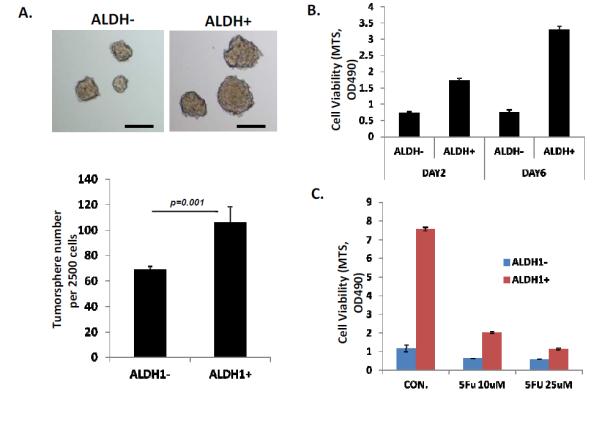
Cells with higher percentage of ALDH-1 more readily for tumor sphere and are resistant to 5-FU. A. From JHESO, ALDH-1+ and ALDH-1− cells are sorted by fluorescence activated cell sorting in 3 cell lines (FLO-1, JHESO, and OAPC) according to ALDEFLUOR detection kit following the protocol and tumor sphere assays were carried out in triplicate in ultra-low attachment plate in the tumor sphere medium. After 8-10 days in culture, the number and size of the tumor spheres were counted under a microscope. The ALDH-1+ cells formed larger tumor spheres and these are numerically shown in the bar graph below. B. The proliferation rate of ALDH1+ and ALDH-1− cells using the MTS proliferation assay on day 2 and day 6 demonstrate higher proliferative activity of ALDH-1+ cells. C. ALDH-1+ cells are more resistant to 5-FU at different concentrations.
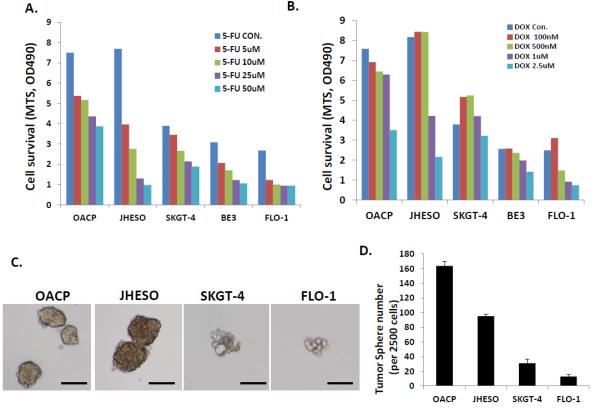
Our results also demonstrated that cell lines with higher ability to form tumor spheres (OAPC and JHESO) had a higher fraction of ALDH-1+ cells and were more resistant to 5-FU and docetaxel compared to those with diminished ability to form tumor spheres (SKGT-4, BE3, and FLO-1; Figure 6).
Figure 6.

Effect of exposure to various concentrations of 5-FU and docetaxel on various cell lines in relation to their ability to form tumor spheres (CSC property). Cells that readily formed tumor spheres (OAPC and JHESO) were more resistant to cytotoxics than those cells that had difficulty forming tumor spheres (FLO-1). A. Response of various cell lines to various concentrations of 5-FU. B. Response of various cell lines to various concentrations of docetaxel. C. Tumor sphere assay were done in triplicate in ultra-low attachment plates and tumor spheres were counted after 8-10 days in culture. D. Bar graph showing tumor sphere formation ability of various cell lines.
Upregulation of ALDH-1 and other stem cell markers (YAP1 and Gal-3) were noted in SKGT-4 and YES-6 cells when both were made resistant to 5-FU (Figure 7).
Figure 7.
Upregulation of ALDH-1 when SKGT-4 and YES-6 cells are made resistant to 5-FU. A. Overexpression of ALDH1 and other CSC-related genes (YAP1 and Gal-3) if cells were resistant to 5-FU at different concentrations. B. 5-FU response of SKGT-4 parenteral cells and made resistant cells using MTS cell proliferation assay. C. 5-FU response of YES-6 parenteral cells and made resistant cells using MTS cell proliferation assay.
4.0 Discussion
Our results on EC cells suggest that high ALDH-1 LIs are associated with therapy resistance, aggressive phenotype (higher proliferative rate) in tumor spheres, and overexpression of resistance conferring genes (Shh, YAP1, Shh, Gal-3, and Hes-1). In addition, we observed that if cells were made resistant to 5-FU, the proportion of ALDH-1+ cells increased, there was overexpression of resistance conferring genes, and aggressive phenotype in the tumor sphere assays. These unique data support the observations made in our large cohort of patients.
Our cohort of 167 was treated with the uniform strategy of TMT. The pathologic responses were characterized by validated method28 and ALDH-1 LIs were assessed in untreated tumor tissue. Our data are particularly striking for the enrichment of only exCRTR tumor patients in a specific category where ALDH-1 LI are ≥60. The C-index in various models was 0.960 by two cross validation methods. This observation opens up a possibility of a therapeutic strategy in which one could avoid chemoradiation prior to surgery in these patients or add a specific agent that might overcome resistance to chemoradiation; e.g., Shh inhibition15 or by targeting other genes such asYAP1, Gal-3, Hes-1, etc. The data on patients who achieved pathCR is also encouraging. Nearly all pathCR patients had ALDH-1 LI <0.3 (there was only one exception). The C-index for pathCR was 0.798 by two cross validation methods. This observation could also trigger a unique strategy. Patients who have low baseline ALDH-1 LI (and achieve a clinical complete response as defined in the reference13 following completion of chemoradiation) could be investigated for selective surgery.
Our results define the heterogeneity of response to chemoradiation in patients with localized EC but moreover, tie these results to ALDH-1 (a well known marker of CSCs or side population). Our results are supported by complimentary findings that higher the density of CSCs in a given tumor, higher is the likelihood of the tumor being resistant to therapy.34 In addition, our non-clinical data demonstrate that upregulation of resistance conferring genes occurs when cells have high ALDH-1 LIs or are made resistant to cytotoxic agents (which also enriches for ALDH-1 + cells). These observations provide a research trajectory to focus on a specific therapeutic target(s) in patients that can be exploited to overcome therapy resistance. Most importantly, these are the first data to establish ALDH-1 as a predictive biomarker.
Our analysis has the drawback of not having an independent validation cohort yet. This would be our next step before strategizing for clinical implementation. We were able to cross-validate by two separate methods and provide unique non-clinical supportive data. The strength of our results is that (1) this is the first report of ALDH-1 as a predictive marker in cancer patients, (2) we are reporting on a large number of patients all treated with TMT, (3) we have scored the surgical specimens for treatment response assessment with a validated method,28 and (4) our non-clinical data confirm the clinical observations but also provide insights into how we could uncover clinical therapeutic targets for EC patients.
5.0 Conclusion
In conclusion, ALDH-1 LIs are predictive of pathCR (p=<0.001) and exCRTR (p=<0.001), and prognostic of overall survival (p=0.03) and progression-free survival (p=0.006), produce high C-index by two cross validation methods for exCRTR (0.960) and pathCR (0.798), and finally, our non-clinical data parallel our clinical observations and provide insights into how to navigate effectively for making more progress. Finally, our data can pave the path to implementation of a biomarker strategy for individualized therapeutic strategies for EC patients.
Supplementary Material
Highlights.
ALDH-1, a stem cell biomarker, was examined in 167 untreated adenocarcinoma of the esophagus
ALDH-1 expression levels correlated with resistance or response to chemoradiation
Non-clinical experiments correlated with clinical observations.
First demonstration of ALDH-1 as a predictive biomarker
Acknowledgements
We are grateful to Dr. Julie G. Izzo for her invaluable contributions to this project. In addition, we acknowledge excellent patient care provided by Drs. P. M. Lynch, W. A. Ross, A. Dekovich, R. Bresalier, S. H. Lin, J. Welsh, and G. Walsh.
Funding: Supported in part by the grants CA142072, CA127672, CA129906, and CA172741 (JAA) by the National Cancer Institute, USA, and donations received from the Caporella, Dallas, Sultan, Park, Smith, Frazier, Oaks, Sultan, Vanstekelenburg, and Cantu Families, the Schecter Private Foundation, Rivercreek Foundation, Kevin Fund, Myer Fund, Dio Fund, Milrod Fund, and the Multidisciplinary Research Grants provided by the University of Texas M. D. Anderson Cancer Center, Houston, USA
Footnotes
Publisher's Disclaimer: This is a PDF file of an unedited manuscript that has been accepted for publication. As a service to our customers we are providing this early version of the manuscript. The manuscript will undergo copyediting, typesetting, and review of the resulting proof before it is published in its final citable form. Please note that during the production process errors may be discovered which could affect the content, and all legal disclaimers that apply to the journal pertain.
The authors have declared no conflict of interest.
References
- 1.Jemal A, Bray F, Center MM, Ferlay J, Ward E, Forman D. Global cancer statistics. CA Cancer J Clin. 2011;61:69–90. doi: 10.3322/caac.20107. [DOI] [PubMed] [Google Scholar]
- 2.Thrift AP, Whiteman DC. The incidence of esophageal adenocarcinoma continues to rise: analysis of period and birth cohort effects on recent trends. Ann Oncol. 2012;23:3155–3162. doi: 10.1093/annonc/mds181. [DOI] [PubMed] [Google Scholar]
- 3.van Hagen P, Hulshof MC, van Lanschot JJ, et al. Preoperative chemoradiotherapy for esophageal or junctional cancer. N Engl J Med. 2012;366:2074–2084. doi: 10.1056/NEJMoa1112088. [DOI] [PubMed] [Google Scholar]
- 4.Ajani JA, Barthel JS, Bentrem DJ, et al. Esophageal and esophagogastric junction cancers. J Natl Compr Canc Netw. 2011;9:830–887. doi: 10.6004/jnccn.2011.0072. [DOI] [PubMed] [Google Scholar]
- 5.Rice TW, Rusch VW, Apperson-Hansen C, et al. Worldwide esophageal cancer collaboration. Dis Esophagus. 2009;22:1–8. doi: 10.1111/j.1442-2050.2008.00901.x. [DOI] [PubMed] [Google Scholar]
- 6.Kelsen DP, Ginsberg R, Pajak TF, et al. Chemotherapy followed by surgery compared with surgery alone for localized esophageal cancer. N Engl J Med. 1998;339:1979–1984. doi: 10.1056/NEJM199812313392704. [DOI] [PubMed] [Google Scholar]
- 7.Allum WH, Stenning SP, Bancewicz J, Clark PI, Langley RE. Long-term results of a randomized trial of surgery with or without preoperative chemotherapy in esophageal cancer. J Clin Oncol. 2009;27:5062–5067. doi: 10.1200/JCO.2009.22.2083. [DOI] [PubMed] [Google Scholar]
- 8.Rizk NP, Venkatraman E, Bains MS, et al. American Joint Committee on Cancer staging system does not accurately predict survival in patients receiving multimodality therapy for esophageal adenocarcinoma. J Clin Oncol. 2007;25:507–512. doi: 10.1200/JCO.2006.08.0101. [DOI] [PubMed] [Google Scholar]
- 9.Rohatgi P, Swisher SG, Correa AM, et al. Characterization of pathologic complete response after preoperative chemoradiotherapy in carcinoma of the esophagus and outcome after pathologic complete response. Cancer. 2005;104:2365–2372. doi: 10.1002/cncr.21439. [DOI] [PubMed] [Google Scholar]
- 10.Rohatgi PR, Swisher SG, Correa AM, et al. Failure patterns correlate with the proportion of residual carcinoma after preoperative chemoradiotherapy for carcinoma of the esophagus. Cancer. 2005;104:1349–1355. doi: 10.1002/cncr.21346. [DOI] [PubMed] [Google Scholar]
- 11.Chirieac LR, Swisher SG, Ajani JA, et al. Posttherapy pathologic stage predicts survival in patients with esophageal carcinoma receiving preoperative chemoradiation. Cancer. 2005;103:1347–1355. doi: 10.1002/cncr.20916. [DOI] [PubMed] [Google Scholar]
- 12.Ajani JA, Correa AM, Hofstetter WL, et al. Clinical parameters model for predicting pathologic complete response following preoperative chemoradiation in patients with esophageal cancer. Ann Oncol. 2012 doi: 10.1093/annonc/mds210. [DOI] [PMC free article] [PubMed] [Google Scholar]
- 13.Cheedella NK, Suzuki A, Xiao L, et al. Association between clinical complete response and pathological complete response after preoperative chemoradiation in patients with gastroesophageal cancer: analysis in a large cohort. Ann Oncol. 2012 doi: 10.1093/annonc/mds617. [DOI] [PMC free article] [PubMed] [Google Scholar]
- 14.Sims-Mourtada J, Izzo JG, Apisarnthanarax S, et al. Hedgehog: an attribute to tumor regrowth after chemoradiotherapy and a target to improve radiation response. Clin Cancer Res. 2006;12:6565–6572. doi: 10.1158/1078-0432.CCR-06-0176. [DOI] [PubMed] [Google Scholar]
- 15.Sims-Mourtada J, Izzo JG, Ajani J, Chao KS. Sonic Hedgehog promotes multiple drug resistance by regulation of drug transport. Oncogene. 2007;26:5674–5679. doi: 10.1038/sj.onc.1210356. [DOI] [PubMed] [Google Scholar]
- 16.Awad O, Yustein JT, Shah P, et al. High ALDH activity identifies chemotherapy-resistant Ewing's sarcoma stem cells that retain sensitivity to EWS-FLI1 inhibition. PLoS ONE. 2010;5:e13943. doi: 10.1371/journal.pone.0013943. [DOI] [PMC free article] [PubMed] [Google Scholar]
- 17.Ginestier C, Hur MH, Charafe-Jauffret E, et al. ALDH1 is a marker of normal and malignant human mammary stem cells and a predictor of poor clinical outcome. Cell Stem Cell. 2007;1:555–567. doi: 10.1016/j.stem.2007.08.014. [DOI] [PMC free article] [PubMed] [Google Scholar]
- 18.Ricardo S, Vieira AF, Gerhard R, et al. Breast cancer stem cell markers CD44, CD24 and ALDH1: expression distribution within intrinsic molecular subtype. J Clin Pathol. 2011;64:937–946. doi: 10.1136/jcp.2011.090456. [DOI] [PubMed] [Google Scholar]
- 19.Wang YC, Yo YT, Lee HY, et al. ALDH1-Bright Epithelial Ovarian Cancer Cells Are Associated with CD44 Expression, Drug Resistance, and Poor Clinical Outcome. American Journal of Pathology. 2012;180:1159–1169. doi: 10.1016/j.ajpath.2011.11.015. [DOI] [PubMed] [Google Scholar]
- 20.Kim MP, Fleming JB, Wang HM, et al. ALDH Activity Selectively Defines an Enhanced Tumor-Initiating Cell Population Relative to CD133 Expression in Human Pancreatic Adenocarcinoma. PLoS ONE. 2011:6. doi: 10.1371/journal.pone.0020636. [DOI] [PMC free article] [PubMed] [Google Scholar]
- 21.Nguyen GH, Murph MM, Chang JY. Cancer Stem Cell Radioresistance and Enrichment: Where Frontline Radiation Therapy May Fail in Lung and Esophageal Cancers. Cancers (Basel) 2011;3:1232–1252. doi: 10.3390/cancers3011232. [DOI] [PMC free article] [PubMed] [Google Scholar]
- 22.Jiang F, Qiu Q, Khanna A, et al. Aldehyde dehydrogenase 1 is a tumor stem cell-associated marker in lung cancer. Molecular Cancer Research. 2009;7:330–338. doi: 10.1158/1541-7786.MCR-08-0393. [DOI] [PMC free article] [PubMed] [Google Scholar]
- 23.Moreb JS, Baker HV, Chang LJ, et al. ALDH isozymes downregulation affects cell growth, cell motility and gene expression in lung cancer cells. Mol Cancer. 2008;7:87. doi: 10.1186/1476-4598-7-87. [DOI] [PMC free article] [PubMed] [Google Scholar]
- 24.Nogami T, Shien T, Tanaka T, et al. Expression of ALDH1 in axillary lymph node metastases is a prognostic factor of poor clinical outcome in breast cancer patients with 1-3 lymph node metastases. Breast Cancer. 2012 doi: 10.1007/s12282-012-0350-5. [DOI] [PubMed] [Google Scholar]
- 25.Brennan SK, Meade B, Wang Q, Merchant AA, Kowalski J, Matsui W. Mantle cell lymphoma activation enhances bortezomib sensitivity. Blood. 2010;116:4185–4191. doi: 10.1182/blood-2010-02-268375. [DOI] [PMC free article] [PubMed] [Google Scholar]
- 26.Wang Y, Zhe H, Gao P, Zhang N, Li G, Qin J. Cancer stem cell marker ALDH1 expression is associated with lymph node metastasis and poor survival in esophageal squamous cell carcinoma: a study from high incidence area of northern China. Diseases of the Esophagus. 2012;25:560–565. doi: 10.1111/j.1442-2050.2011.01279.x. [DOI] [PubMed] [Google Scholar]
- 27.Zhang G, Ma L, Xie YK, Miao XB, Jin C. Esophageal cancer tumorspheres involve cancer stem-like populations with elevated aldehyde dehydrogenase enzymatic activity. Molecular Medicine Reports. 2012;6:519–524. doi: 10.3892/mmr.2012.939. [DOI] [PubMed] [Google Scholar]
- 28.Wu TT, Chirieac LR, Abraham SC, et al. Excellent interobserver agreement on grading the extent of residual carcinoma after preoperative chemoradiation in esophageal and esophagogastric junction carcinoma: a reliable predictor for patient outcome. Am J Surg Pathol. 2007;31:58–64. doi: 10.1097/01.pas.0000213312.36306.cc. [DOI] [PubMed] [Google Scholar]
- 29.Raju U, Ariga H, Koto M, et al. Improvement of esophageal adenocarcinoma cell and xenograft responses to radiation by targeting cyclin-dependent kinases. Radiother Oncol. 2006;80:185–191. doi: 10.1016/j.radonc.2006.07.027. [DOI] [PubMed] [Google Scholar]
- 30.Soldes OS, Kuick RD, Thompson IA, 2nd, et al. Differential expression of Hsp27 in normal oesophagus, Barrett's metaplasia and oesophageal adenocarcinomas. Br J Cancer. 1999;79:595–603. doi: 10.1038/sj.bjc.6690094. [DOI] [PMC free article] [PubMed] [Google Scholar]
- 31.Song S, Maru DM, Ajani JA, et al. Loss of TGF-beta Adaptor beta2SP Activates Notch Signaling and SOX9 Expression in Esophageal Adenocarcinoma. Cancer Res. 2013;73:2159–2169. doi: 10.1158/0008-5472.CAN-12-1962. [DOI] [PMC free article] [PubMed] [Google Scholar]
- 32.Song S, Mazurek N, Liu C, et al. Galectin-3 mediates nuclear beta-catenin accumulation and Wnt signaling in human colon cancer cells by regulation of glycogen synthase kinase-3beta activity. Cancer Res. 2009;69:1343–1349. doi: 10.1158/0008-5472.CAN-08-4153. [DOI] [PMC free article] [PubMed] [Google Scholar]
- 33.Harrell FE. Regression modeling strategies. Springer-Verlag; New York: 2001. [Google Scholar]
- 34.Steg AD, Bevis KS, Katre AA, et al. Stem cell pathways contribute to clinical chemoresistance in ovarian cancer. Clin Cancer Res. 2012;18:869–881. doi: 10.1158/1078-0432.CCR-11-2188. [DOI] [PMC free article] [PubMed] [Google Scholar]
Associated Data
This section collects any data citations, data availability statements, or supplementary materials included in this article.