Abstract
Children with mucopolysaccharidosis II (MPS II), also known as Hunter syndrome, an X-linked disorder, suffer from a multisystem dysfunction caused by the accumulation of glycosaminoglycans. However, there has been no systemic report on the growth of patients with MPS II. The purpose of this study is to describe the growth patterns of patients with MPS II and to compare with the patterns of age-matched controls. Data (height, weight, age, etc.) was collected in a longitudinal study of Japanese male patients with MPS II (n = 111). The mean birth length was 50.31 ± 1.42 cm, while the mean birth weight was 3.35 ± 0.39 kg. The mean final height and weight at 18 years and older were 125.63 ± 9.09 cm and 37.18 ± 8.72 kg; corresponding to a difference of −46.40 cm and −25.89 kg lower, when compared with healthy Japanese male controls. The mean birth BMI was 10.84 ± 3.29 kg/m2, while the mean BMI at 18 years was 29.41 ± 6.15 kg/m2. The growth pattern in patients with MPS II was characterized by overgrowth for the first several years, although growth velocity fell below that of the normal healthy controls after one year of age. No statistical difference in height was observed between patients with the attenuated and severe phenotypes in each age class.
In conclusion, this report describes the natural history of growth in patients with MPS II, which can help in monitoring the progression of the disease as well as assessing therapeutic efficacy.
Keywords: Hunter Syndrome, Growth charts, Mucopolysaccaridosis type II, Lysosomal Storage Disorders, Height Velocity
INTRODUCTION
Mucopolysaccharidosis II (MPS II, Hunter syndrome; OMIM #309900) is a lysosomal storage disorder (LSD) caused by a mutation in the X-linked gene IDS. Affected individuals lack the enzyme, iduronate 2-sulfatase (I2S), which decreases the amount of the sulfate moiety released from the glycosaminoglycans (GAGs), dermatan sulfate (DS) and heparan sulfate (HS) during their degradation [1]. In the absence of this enzyme, the stepwise degradation of DS and HS is blocked resulting in the accumulation of the respective GAG substrate in the lysosomes and extracellular matrix (ECM) in a wide range of tissues. Although the enzymatic deficiencies result in the accumulation of the pathological substrates, the mechanism causing the pathogenesis of the disease remains unknown [2].
The most significant aspect of the disease is the detrimental CNS involvement that manifests most often as progressive cognitive degeneration, although individuals with the attenuated form of the disease have minimal CNS involvement. The severe phenotype, which is characterized by CNS involvement, is more than twice as prevalent as the attenuated form of the disease [3]. Progressive cardiac and airway disease, along with cognitive degeneration in severe cases, usually results in death during the first or second decade of life; whereas patients with the attenuated phenotype may survive into adulthood [1,4].
MPS II has a prevalence rate suggested to be between 1:100,000 and 1:170,000 male births [5,6], and is the most prevalent form of MPS disorders in East Asian countries constituting 52% of all MPS cases diagnosed [7]. An examination of patients with Hunter syndrome showed that exon 3 of the IDS gene had significantly more mutations than other exons [8]. The patients with MPS II have a wide range of symptoms caused by the disease affecting multiple different organ systems. Although corneal clouding does not occur in MPS II, optic head swelling does occur in 20% of patients [9]. Joint contractures cause a prominent loss of joint mobility and are one of the early diagnostic cues in the diagnosis of MPS II. The skeletal abnormalities, dysostosis multiplex, in MPS II are comparable regardless of clinical phenotype and are common among other types of MPS disorders. Dysostosis multiplex is characterized in general as a thickening of the long bones with irregular ossification centers [1]. Respiratory issues are common and result from the accumulation of GAGs in the tongue, oropharynx, and trachea causing the airways to narrow leading to airway obstruction. Airway obstruction is worsened by stiffness of the chest wall, hepatosplenomealgy, and thickening of respiratory secretions, which reduces the thoratic volume [1]. The major causes of morbidity and mortality in patients with MPS II are abnormal hearts; 82% of patients have cardiovascular signs and symptoms [1]. Of those patients with cardiovascular involvement, 57% are from cardiac valve involvement, 8% from cardiomyopathy, 7% from tachycardia, 6% from hypertension, 4% from arrhythmia and congestive heart failure, and 2% from peripheral vascular disease [3]. The most significant signs of the disease are from the cognitive degradation. Early in life, patients may be able to reach early developmental milestones, however, psychomotor delays are usual in the late infantile period and cognitive regression begins between ages six and eight [1]. The most common neurological signs, behavioral and cognitive problems, are found in approximately one third of patients [3]. Extensive and aberrant Mongolian spot is also a characteristic finding of Hunter syndrome in Japan [10]. Surgical operations of inguinal and/or umbilical hernia are often done before the diagnosis of Hunter syndrome [11].
Current therapies include enzyme replacement therapy (ERT), substrate reduction therapy (SRT), and hematopoietic stem cell therapy (HSCT). HSCT has been shown to be effective in the treatment of MPS diseases and other LSDs. Tanaka et al (2012) demonstrated that HSCT provides effectiveness towards brain or heart involvement, when performed before signs of brain atrophy or valvular regurgitation and that HSCT is worthwhile in early stages of the disease for patients with MPS II [12].
ERT was applied to several types of MPS including MPS II using a recombinant form of the human I2S (idursulfase, Elaprase®, Shire Human Genetic Therapies, Inc., Lexington, MA. USA). However, idursulfase cannot pass through the blood brain barrier and only patients with the attenuated form of the disease have been treated [2,1,13]. Clinical trials have shown that ERT decreases urinary GAG levels as well as improves the measures of pulmonary function and walking ability [14–17].
Growth in patients with MPS II has been known to be below that of normal healthy controls; however, it remains unclear if this poor growth is generalizable regardless of the clinical phenotype of MPS II [18,19]. Appropriate growth charts recording the natural growth of MPS II patients are required as a baseline record by which to measure the clinical progression of the disease and to evaluate the effectiveness of any treatment administered to patients.
In this report, we have explored by making standard growth charts of MPS II: (1) What are the natural growth patterns of patients with MPS II? (2) Is there a statistical difference in growth between the patients with the attenuated and severe phenotypes?
MATERIALS AND METHODS
STUDY SUBJECTS
Patients diagnosed with MPS II by enzyme assay were recruited at Gifu University to participate in this study by providing clinical history and growth data. The study was approved by the Institutional Review Board (IRB) from Gifu University and Nemours/Alfred I. duPont Hospital for Children.
This study was based upon the data obtained from 111 Japanese male patients with MPS II. Height (n = 778) and weight (n = 800) measurements were obtained from these patients with MPS II.
ANTHROPOMETRIC MEASUREMENTS
Measurement of height was performed at the health-check system in Japan (infantile healthcheck at public healthcare centers in local government, health-check in schools and /or in hospitals). Anthropometric measurements were taken using a standard technique and included body length and weight. Until 3 years of age, the lengths of patients were measured in the supine position using a liberometer. After 3 years of age, height was taken in a standing position using a stadiometer, and was fairly objective, although height measurements might be affected due to structural abnormalities affecting how erect one can stand. The measured value of height in patients above 18 years remained unchanged and was grouped with patients who were 18 years old. No measurement was included in this study once the treatment with growth hormones, ERT, and/or HSCT was initiated.
STATISTICAL ANALYSIS
Data used for the construction of growth charts were age (years and months), height (cm), weight (kg), and clinical phenotype (attenuated or severe). The patients with a severe form had CNS involvement, while the patients with an attenuated form had minimal or absence of CNS involvement. The BMI was calculated from the height and weight data by dividing the weight by the height squared (kg/m2).
Patient data was grouped by age, and the values (> mean +2SD, < mean −2SD) were removed for each age group to exclude any outliers. Statistical analysis for mean, standard deviation, min, and max values were then preformed on the data sets without outliers.
The percentile curves for the height, weight, and BMI growth charts were calculated for each age group. Polynomial trend lines were then used to make smoothened percentile curves using Microsoft Excel, 2007.
A Student t-test was performed on the height and weight data for the patients separated by their clinical phenotypes to determine the statistical relationship between these two patient groups.
The standard control data was taken from established Japanese data sets for healthy male controls issued by Japanese Ministry of Health, Labor, and Welfare.
RESULTS
Length and Height
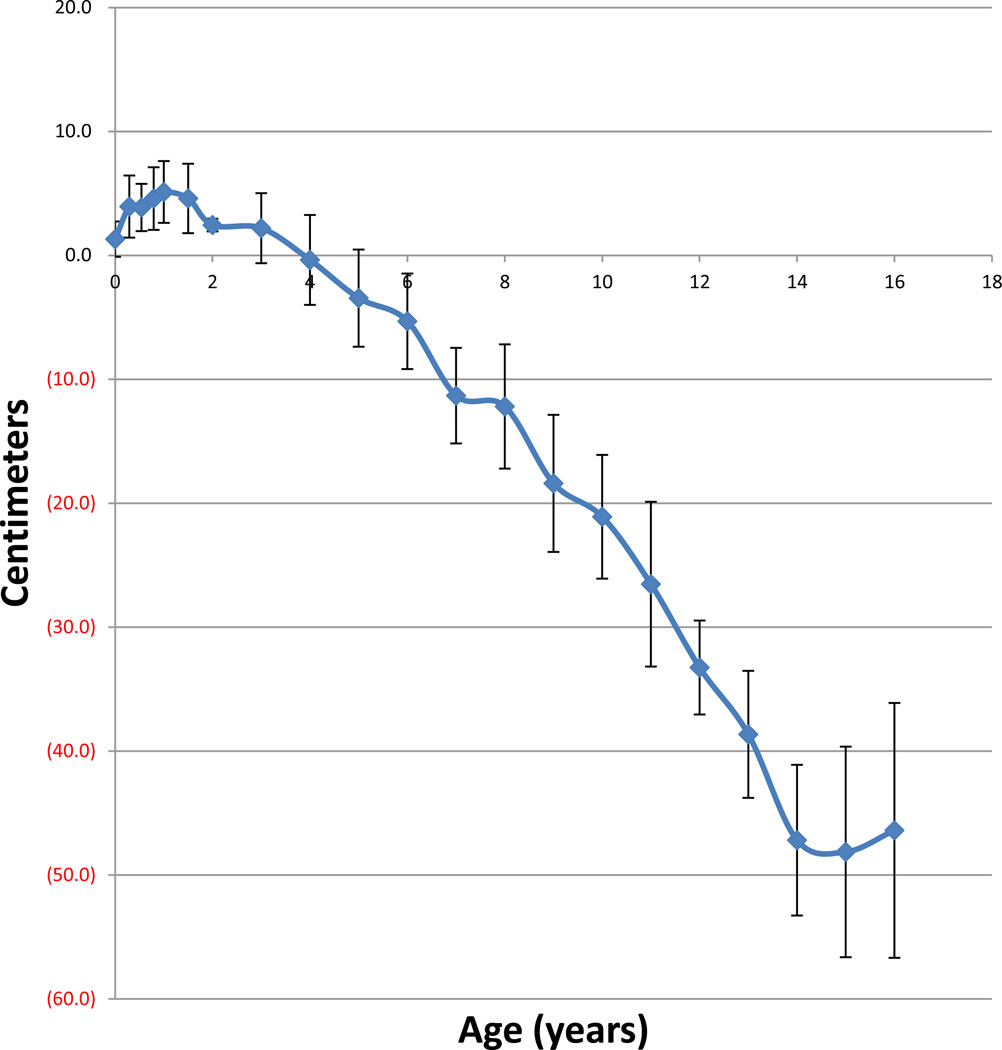
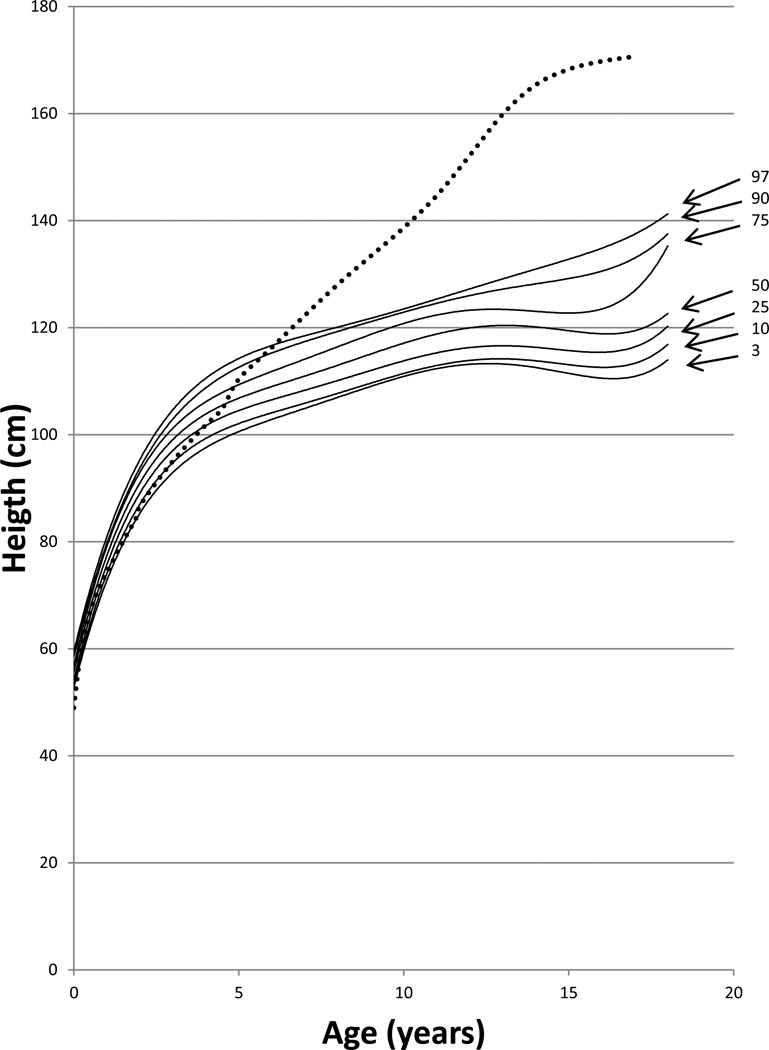
The mean birth length for the patients with MPS II was 50.31 ±1.42 cm (n = 98), 1.31 cm taller than that in healthy control boys (49.0 cm). Until three years of age, the 50th percentile for height of patients with MPS II was above that of the 50th percentile for healthy age-matched controls. At the age of 18 months old, mean length of the patients was 84.72 ± 2.80 cm (n = 77), 4.59 cm taller than that in healthy control boys, and >25% of the 18 months old patients were over 97 percentile of healthy boys. However, by the fourth year, the 50th percentile for height of patients fell below that of the age matched control. By 14 and 15 years of age, the 50th percentile for height of patients reached below 45 cm when compared with that in the age-matched controls. The mean height for males at 16 years was 123.40 ± 10.28 cm (n = 7), which corresponds to a difference of 46.40 cm smaller than the age-matched controls (Tables 1, 2; Figs. 1, 2).
Table 1.
Height in MPS II until 48 months of age
| Age (month) | n | mean (cm) | SD | min | max |
|---|---|---|---|---|---|
| 0 | 98 | 50.31 | 1.42 | 47.0 | 53.5 |
| 1 | 16 | 56.50 | 1.71 | 54 | 59 |
| 3.5 | 78 | 65.92 | 2.50 | 60.4 | 70.5 |
| 6.5 | 64 | 71.73 | 1.90 | 67.0 | 76.0 |
| 9.5 | 53 | 76.34 | 2.53 | 71.7 | 82.0 |
| 12 | 57 | 79.44 | 2.49 | 75.0 | 85.0 |
| 18 | 77 | 84.72 | 2.80 | 78.5 | 90.0 |
| 24 | 52 | 89.11 | 0.51 | 82.8 | 96.0 |
| 36 | 63 | 97.26 | 2.83 | 89.0 | 105.2 |
| 48 | 38 | 101.48 | 3.63 | 94 | 108 |
Table 2.
Height in MPS II (5 to 18 years)
| Age (years) | n | mean (cm) | SD | min | max |
|---|---|---|---|---|---|
| 5 | 30 | 106.95 | 3.92 | 99.5 | 116 |
| 6 | 31 | 110.98 | 3.85 | 102 | 120 |
| 7 | 16 | 110.98 | 3.85 | 102 | 120 |
| 8 | 22 | 115.90 | 5.01 | 107 | 126 |
| 9 | 8 | 115.00 | 5.53 | 108 | 122 |
| 10 | 15 | 117.61 | 4.99 | 109 | 125 |
| 11 | 6 | 118.17 | 6.65 | 110 | 125 |
| 12 | 12 | 118.94 | 3.79 | 113.3 | 126 |
| 13 | 4 | 121.25 | 5.12 | 116 | 127 |
| 14 | 9 | 118.21 | 6.08 | 110 | 130.4 |
| 15 | 6 | 120.17 | 8.50 | 111 | 135 |
| 16 | 7 | 123.40 | 10.28 | 110 | 140.8 |
| 18 | 16 | 125.63 | 9.09 | 112 | 143 |
Figure 1. Comparison of mean height between patients with MPS II and age-matched normal controls.
Difference in mean height between patients with MPS II and normal controls is expressed as centimeters. Error bars show ± 1 SD.
Figure 2. Growth chart for patients with MPS II from birth to 18 years of age.
The dotted line shows the mean height for healthy males. The solid line shows heights for MPS II patients. Arrows point to their respective percentile curve.
75% (at birth) and 90% (at 18 months) of patients with MPS II had body lengths equal to or greater than the mean birth length of the normal age-matched control, respectively. However, by 7 years of age, the 97th percentile for patients moved and stayed below the mean height of the healthy controls (Fig. 2). Overgrowth before age 4 and sudden growth cessation after age 6 is a characteristic growth pattern of Hunter syndrome.
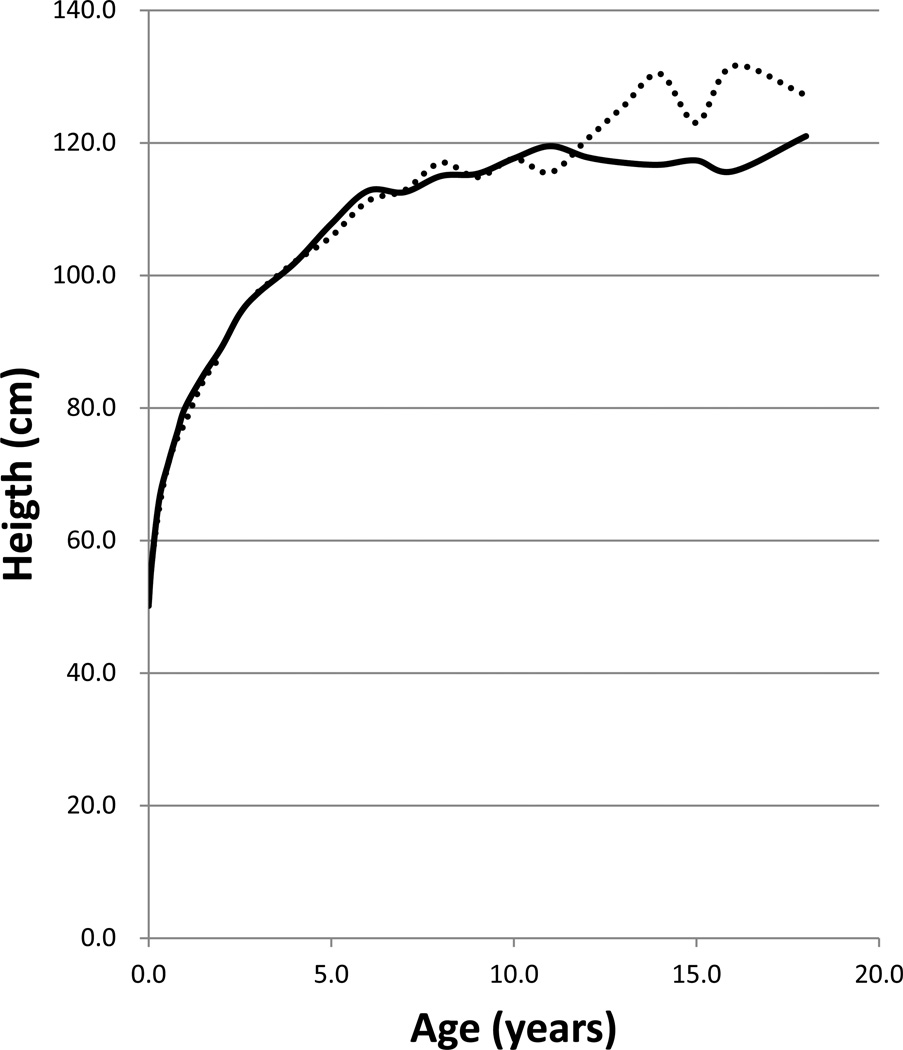
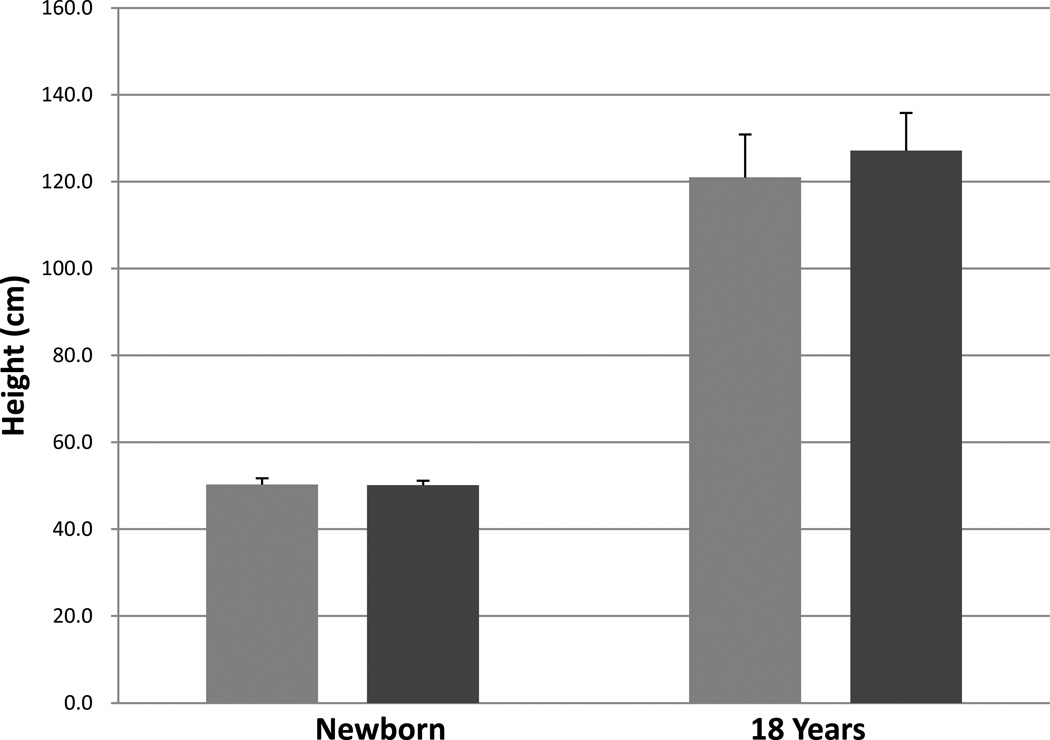
The mean birth length for patients with a severe phenotype was 50.29 ± 1.47 cm (n = 68), and the mean birth length for patients with the attenuated phenotype of the disease was 50.13 ± 1.07 cm (n = 28). The mean final height for the patients with a severe phenotype was 121.00 ± 9.90 cm (n = 4) and the mean final height for the patients with an attenuated phenotype was 127.17 ± 8.70 cm (n = 12) (Table 3; Figs. 3, 4).
Table 3.
Height in MPS II (severe vs. attenuated)
| Severe | Attenuated | t-test | |||||
|---|---|---|---|---|---|---|---|
| Age (years) |
n | mean (cm) | SD | n | mean (cm) | SD | p= |
| At birth | 68 | 50.29 | 1.47 | 28 | 50.13 | 1.07 | 0.5423 |
| 1 month | 12 | 56.50 | 1.57 | 4 | 56.50 | 2.38 | 1.0000 |
| 3.5 month | 57 | 66.23 | 2.55 | 21 | 65.06 | 2.21 | 0.0539 |
| 6.5 month | 45 | 71.76 | 1.96 | 19 | 71.67 | 1.82 | 0.8619 |
| 9.5 month | 41 | 76.44 | 2.81 | 13 | 75.52 | 2.01 | 0.2066 |
| 1y | 43 | 80.04 | 2.56 | 16 | 77.81 | 2.58 | 0.0064 |
| 1.5 y | 58 | 84.93 | 2.87 | 19 | 84.07 | 2.53 | 0.2220 |
| 2y | 39 | 89.16 | 3.03 | 10 | 87.95 | 3.42 | 0.3253 |
| 2.5y | 4 | 94.25 | 4.35 | 0 | N/A | N/A | N/A |
| 3y | 45 | 97.35 | 2.37 | 17 | 97.51 | 3.33 | 0.8605 |
| 4y | 26 | 101.88 | 4.14 | 12 | 102.03 | 2.80 | 0.8979 |
| 5y | 20 | 107.77 | 5.82 | 12 | 105.85 | 2.88 | 0.2249 |
| 6y | 17 | 112.74 | 5.31 | 15 | 111.19 | 3.30 | 0.3226 |
| 7y | 11 | 112.55 | 5.28 | 5 | 112.80 | 6.53 | 0.9413 |
| 8y | 11 | 114.98 | 4.06 | 11 | 116.99 | 6.17 | 0.3791 |
| 9y | 3 | 115.33 | 6.11 | 5 | 114.80 | 5.89 | 0.9092 |
| 10y | 9 | 117.64 | 3.82 | 6 | 117.55 | 6.81 | 0.9762 |
| 11y | 4 | 119.50 | 6.81 | 2 | 115.50 | 7.78 | 0.6046 |
| 12y | 7 | 117.83 | 2.27 | 5 | 120.50 | 5.15 | 0.3260 |
| 13y | 2 | 117.00 | 1.41 | 2 | 125.50 | 2.12 | 0.0546 |
| 14y | 8 | 116.69 | 4.28 | 1 | 130.40 | N/A | N/A |
| 15y | 3 | 117.33 | 5.69 | 3 | 123.00 | 11.14 | 0.4902 |
| 16y | 3 | 115.70 | 5.17 | 3 | 131.57 | 10.03 | 0.0930 |
| 18y | 4 | 121.00 | 9.90 | 12 | 127.17 | 8.70 | 0.3205 |
Figure 3. Comparison of mean height between patients with severe and attenuated phenotype.
The dotted line shows the mean height for patients with an attenuated phenotype. The solid line shows the mean height for patients with a severe phenotype.
Figure 4. Comparison of the mean height between patients with attenuated and severe phenotypes.
From left to right; severe phenotype (newborn), attenuated phenotype (newborn), severe phenotype (18 years old), and attenuated phenotype (18 years old). Error bars show + 1 SD.
A Student's t-test was performed on the heights of severe and attenuated patients, showing that there is no statistical difference at any age between the two patient populations in body length (Table 3; Fig. 4).
Height Velocity
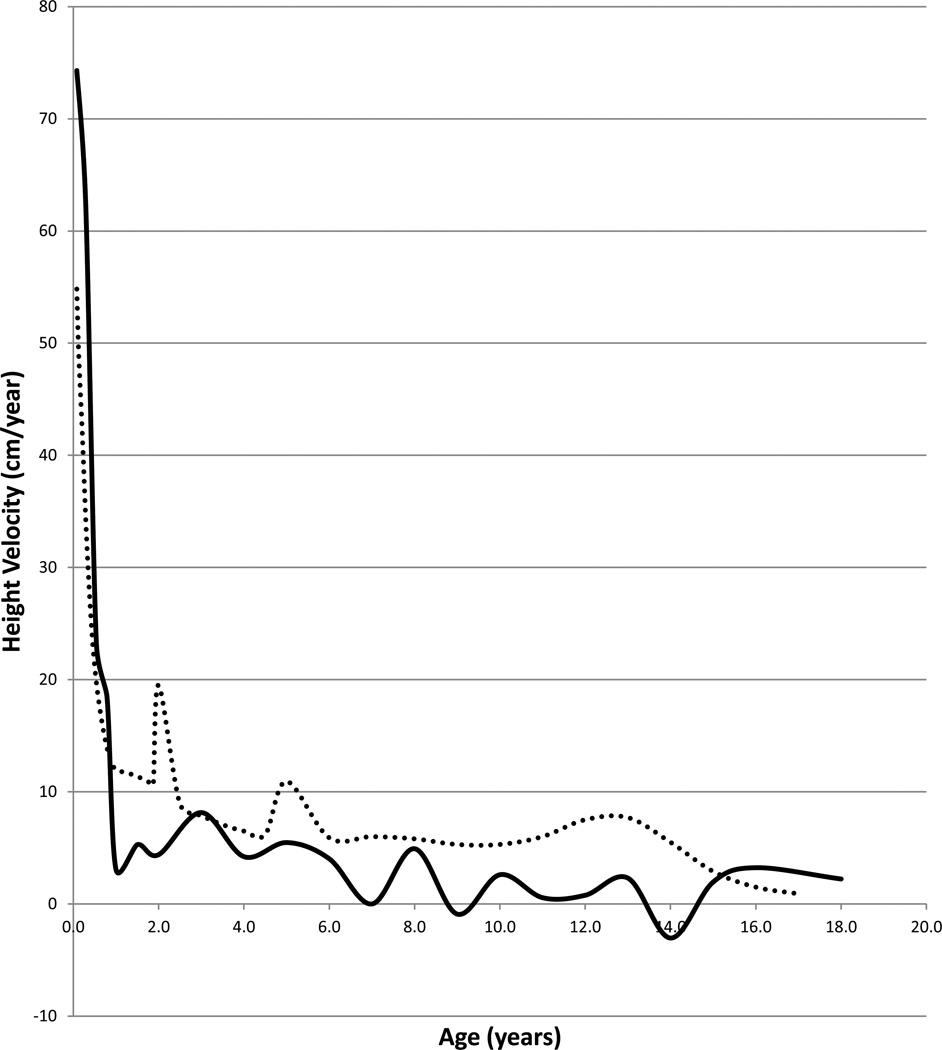
Height velocity curve for patients was made by plotting the change in height per year (Δ height/year). For patients with MPS II, height velocity was higher than that of the normal age-matched controls from birth to the first year of age. However, following age one, the average height velocity for patients with MPS II was at or below that of the normal control. Growth spurts for patients with MPS II were also substantially smaller than those in normal children. The growth velocity of patients with MPS II was jagged and fell below the zero mark at 9 and 14 years (Fig. 5).
Figure 5. Growth velocity from birth to 18 years of age in patients with MPS II.
The dotted line shows the growth velocity of the normal control. The solid line shows the mean height velocity for patients with MPS II.
Weight-for-age and BMI
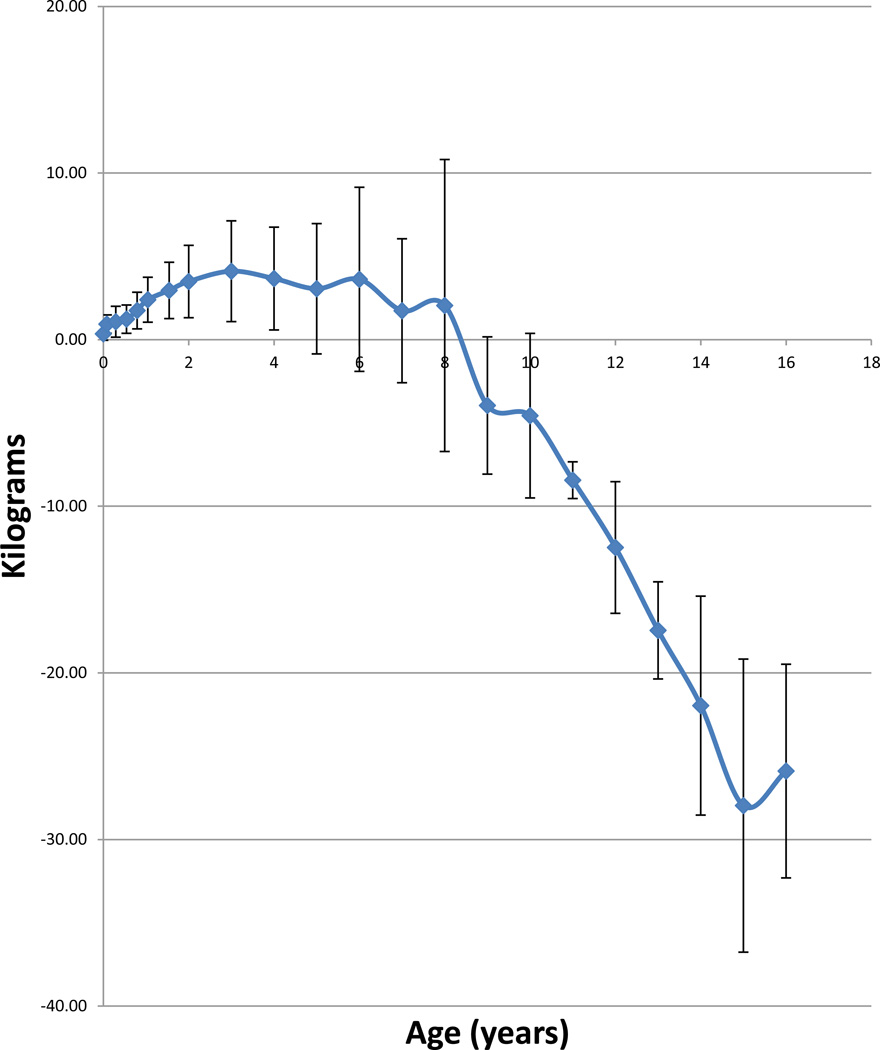
The mean birth weight for patients with MPS II was 3.35 ± 0.39 kg (n = 103), which corresponds to a 0.35 kg increase in weight when compared with healthy controls. The mean weight for patients with MPS II was above that of the control for the first eight years of life, but from 9 years of age the mean weight of the patients fell below that of the normal control, reaching a maximum difference of 27.89 kg below the normal control by age 15 years. The mean weight of patients with MPS II at 18 years and older was 37.18 ± 8.72 kg (Tables 4, 5; Figs. 6, 7).
Table 4.
Body weight in MPS II until 48 months of age
| Age (month) | n | mean (kg) | SD | min | max |
|---|---|---|---|---|---|
| 0 | 103 | 3.35 | 0.39 | 2.58 | 4.15 |
| 1 | 18 | 5.07 | 0.55 | 4.20 | 6.00 |
| 3.5 | 80 | 7.71 | 0.93 | 6.00 | 9.64 |
| 6.5 | 64 | 9.23 | 0.85 | 7.28 | 11.00 |
| 9.5 | 55 | 10.45 | 1.10 | 8.00 | 13.00 |
| 12 | 62 | 11.64 | 1.35 | 9.00 | 15.00 |
| 18 | 79 | 13.30 | 1.69 | 9.50 | 18.00 |
| 24 | 58 | 15.41 | 2.17 | 11.40 | 23.00 |
| 36 | 66 | 18.09 | 3.02 | 12.50 | 26.00 |
| 48 | 38 | 19.43 | 3.09 | 13.40 | 28.00 |
Table 5.
Body weight in MPS II (5 to 18 years)
| Age (year) | n | mean (kg) | SD | min | max |
|---|---|---|---|---|---|
| 5 | 27 | 21.66 | 3.91 | 13.40 | 31.00 |
| 6 | 32 | 24.52 | 5.53 | 13.40 | 40.00 |
| 7 | 14 | 25.14 | 4.32 | 19.00 | 32.00 |
| 8 | 22 | 28.45 | 8.76 | 13.40 | 48.00 |
| 9 | 6 | 25.55 | 4.12 | 21.00 | 31.00 |
| 10 | 17 | 28.14 | 4.94 | 20.40 | 39.65 |
| 11 | 3 | 28.27 | 1.10 | 27.00 | 29.00 |
| 12 | 13 | 30.03 | 3.95 | 22.50 | 36.00 |
| 13 | 4 | 30.35 | 2.91 | 28.00 | 34.00 |
| 14 | 10 | 31.04 | 6.57 | 20.90 | 40.00 |
| 15 | 6 | 29.63 | 8.80 | 17.00 | 44.00 |
| 16 | 7 | 33.71 | 6.41 | 25.50 | 41.60 |
| 18 | 16 | 37.18 | 8.72 | 26.80 | 54.00 |
Figure 6. Comparison of mean weight between patients with MPS II and age-matched normal controls.
Difference in mean height between patients with MPS II weight and normal controls is expressed as kilograms. Error bars show ± 1 SD.
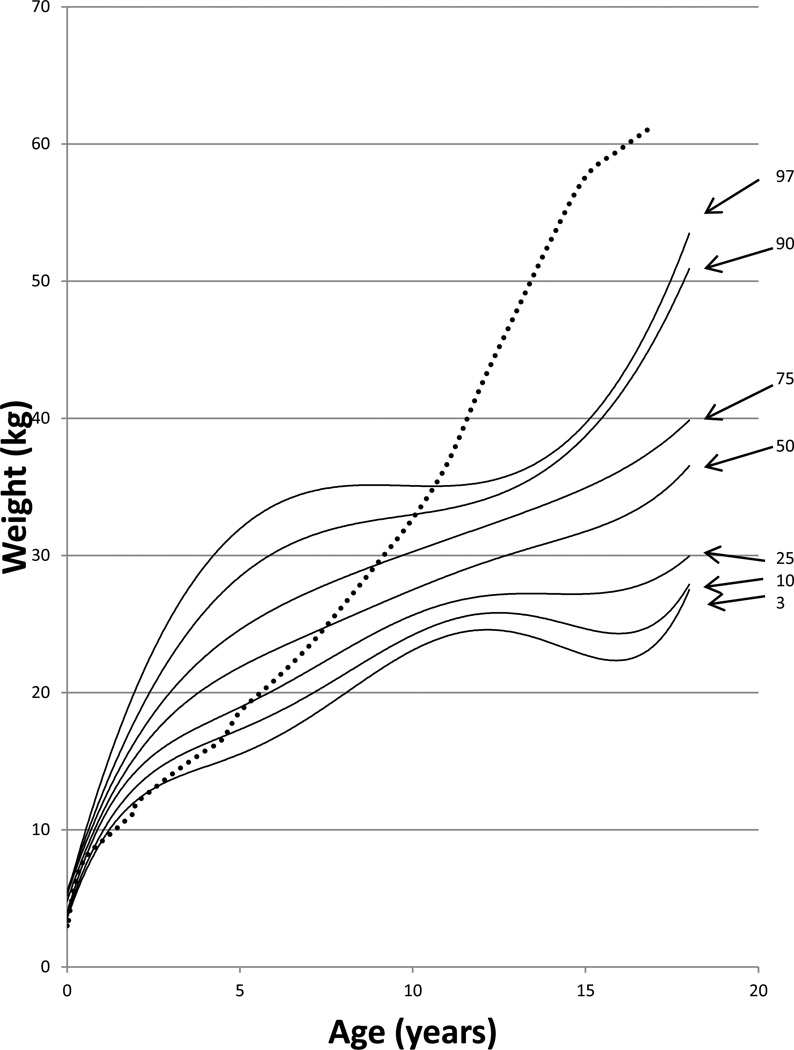
Figure 7. Weight curve for patients with MPS II from birth to 18 years of age.
The dotted line shows the mean height for healthy males. The solid line shows weights for patients with MPS II. Arrows point to their respective percentile curves.
At the end of the first month of life, 97% of patients with MPS II had body weights that were above the mean body weight of the normal control. By the 48th month of age, 90% of patients were above the mean normal weight for that age group. At the age of 18 months old, mean weight of the patients was 13.30 ± 1.69 cm (n = 79), 2.96 kg heavier than that in healthy control boys, and >50% of the 18 months old patients were over 97 percentile of healthy boys. Overweight before age 9 and gradual weight cessation thereafter is also a characteristic growth pattern of Hunter syndrome. By the 11th year of age, the 97th percentile for the patients fell below the mean weight of the normal healthy control (Fig. 7).
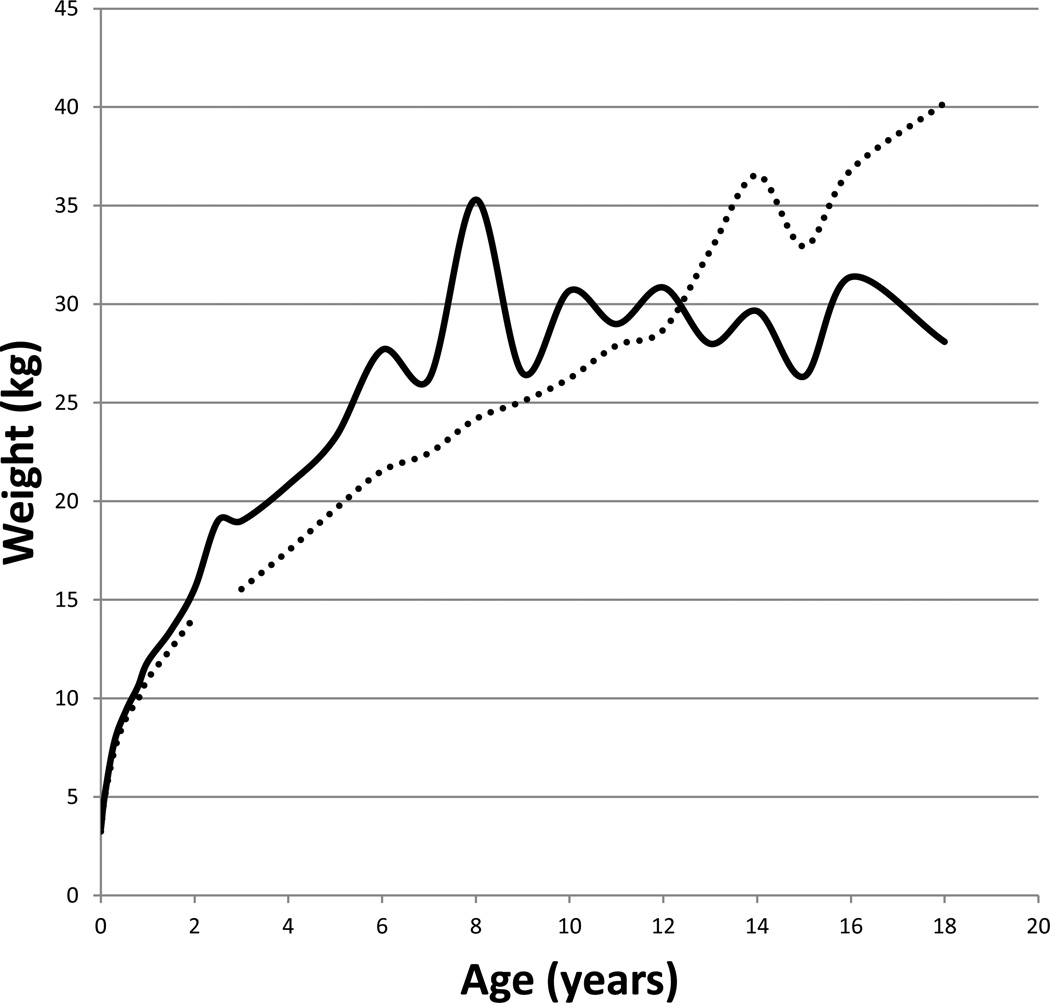
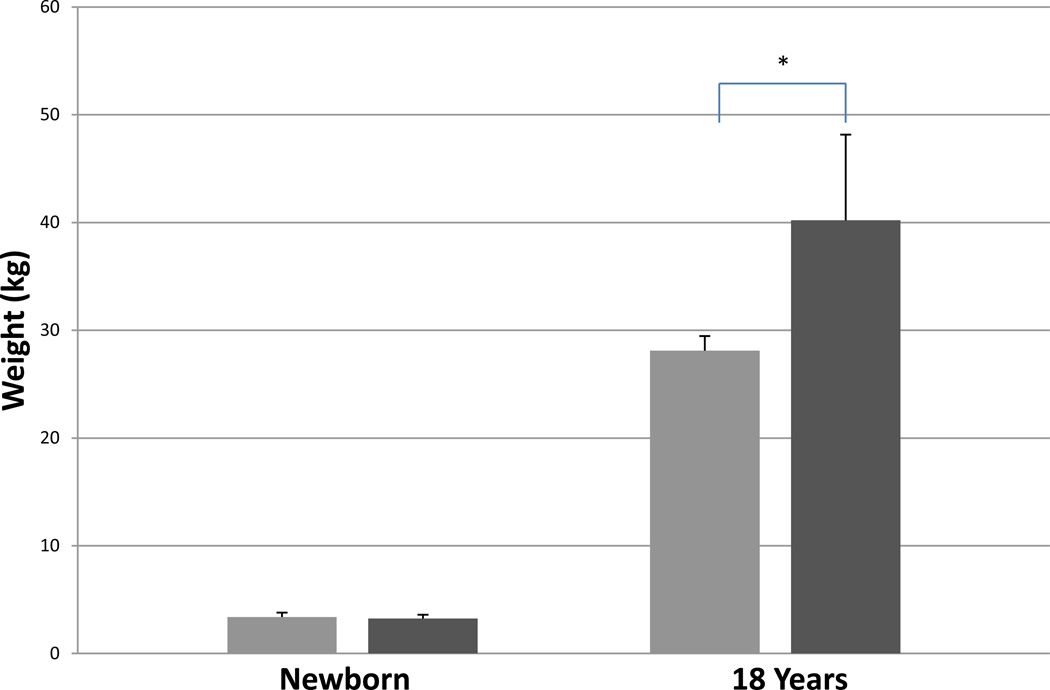
The mean birth weights for patients with a severe form and an attenuated form were 3.40 ± 0.40 kg (n = 72) and 3.25 ± 0.35 kg (n = 31), respectively. The mean final weight for patients with MPS II was 28.10 ± 1.36 kg (n = 4) for the severe phenotype and 40.20 ± 7.96 kg (n = 12) for the attenuated phenotype. A t-test was performed on the weights of severe and attenuated phenotypes of the patients, showing that there is a significant difference of the body weights between the two clinical phenotypes at certain ages. Significant differences between the body weights of patients was found from the age of 3.5 months to 1 year, from 2 years to 6 years, and again, separately, at 8 and 18 years old (Table 6; Figs. 8, 9).
Table 6.
Body weight in MPS II (severe vs. attenuated)
| Severe | Attenuated | t-test | |||||
|---|---|---|---|---|---|---|---|
| Age (years) |
n | mean (kg) | SD | n | mean (kg) | SD | p= |
| At birth | 72 | 3.40 | 0.40 | 31 | 3.25 | 0.35 | 0.07259 |
| 1 month | 15 | 5.09 | 0.57 | 3 | 4.97 | 0.59 | 0.76747 |
| 3.5 month | 59 | 7.83 | 0.97 | 21 | 7.39 | 0.71 | 0.03266 |
| 6.5 month | 48 | 9.41 | 1.05 | 18 | 9.02 | 0.45 | 0.03629 |
| 9.5 month | 42 | 10.61 | 1.14 | 13 | 9.94 | 0.78 | 0.02298 |
| 1y | 46 | 11.86 | 1.35 | 16 | 10.99 | 1.15 | 0.01767 |
| 1.5 y | 61 | 13.48 | 1.76 | 17 | 12.54 | 1.14 | 0.07379 |
| 2y | 41 | 15.58 | 2.09 | 13 | 14.16 | 1.62 | 0.01699 |
| 2.5y | 5 | 19.02 | 3.55 | 0 | N/A | N/A | N/A |
| 3y | 47 | 19.01 | 2.88 | 18 | 15.55 | 1.67 | 0.00000 |
| 4y | 26 | 20.84 | 3.65 | 13 | 17.50 | 2.13 | 0.00094 |
| 5y | 17 | 23.23 | 3.72 | 9 | 19.60 | 1.85 | 0.00286 |
| 6y | 20 | 27.69 | 6.16 | 12 | 21.54 | 2.47 | 0.00048 |
| 7y | 10 | 26.21 | 4.30 | 4 | 22.45 | 3.45 | 0.13056 |
| 8y | 12 | 35.31 | 10.42 | 10 | 24.18 | 2.33 | 0.00354 |
| 9y | 2 | 26.50 | 3.54 | 4 | 25.08 | 4.82 | 0.71003 |
| 10y | 11 | 30.70 | 6.22 | 7 | 26.24 | 4.59 | 0.10137 |
| 11y | 1 | 29.00 | N/A | 2 | 27.90 | 1.27 | N/A |
| 12y | 8 | 30.86 | 3.50 | 5 | 28.70 | 4.67 | 0.40451 |
| 13y | 2 | 28.00 | 0.00 | 2 | 32.70 | 1.84 | 0.17179 |
| 14y | 8 | 29.66 | 6.42 | 2 | 36.55 | 4.88 | 0.23703 |
| 15y | 3 | 26.33 | 8.14 | 3 | 32.93 | 9.72 | 0.41968 |
| 16y | 4 | 31.39 | 6.31 | 3 | 36.80 | 6.20 | 0.31351 |
| 18y | 4 | 28.10 | 1.36 | 12 | 40.20 | 7.96 | 0.00024 |
Figure 8. Comparison of mean weight between patients with severe and attenuated phenotypes.
The dotted line shows the mean weight for patients with an attenuated phenotype. The solid line shows the mean weight for patients with a severe phenotype.
Figure 9. Comparison of mean weights between patients with attenuated and severe phenotypes.
From left to right; severe phenotype (newborn), attenuated phenotype (newborn), severe phenotype (18 years old), and attenuated phenotype (18 years old). Error bars show + 1 SD. * Shows a significant difference.
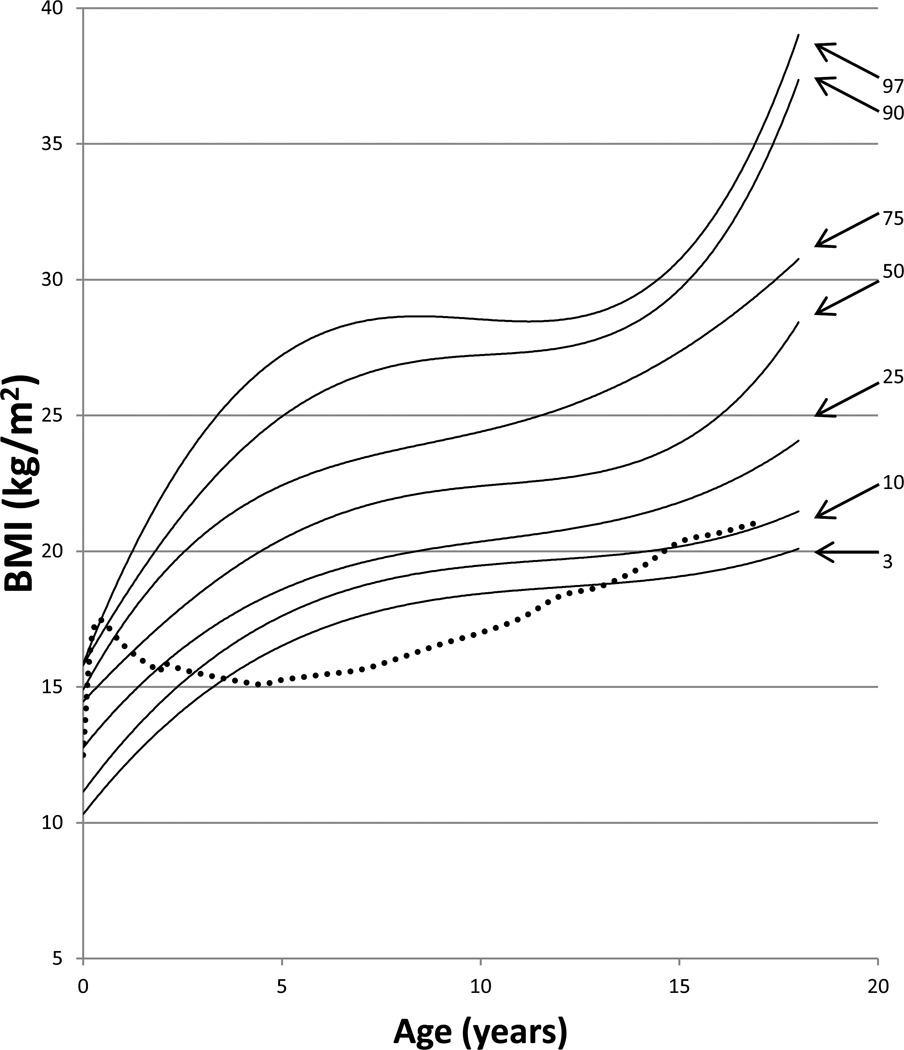
The average BMI for newborn patients was 10.84 ± 3.30 kg/m2, and the BMI for patients at18 years and older was 29.41 ± 6.15 kg/m2. When compared with the normal control, 97% of patients had a BMI higher than the mean BMI of the normal control, but by the 1 year of age > 50% of patients had BMIs above that of the control. From ages of 5 to 13, 97% of patients had BMIs above the normal control. At the age of 16 years, 75% of patients had BMIs above the normal control (Fig. 10).
DISCUSSION
In this study, we have developed growth charts of patients with MPS II. Our study has demonstrated 1) that from birth to early in life the patients have overgrowth, 2) that growth velocity falls below that of the normal healthy controls after one year of age, and 3) that there is no statistical difference in height from birth to 8 years of age between the severe and attenuated phenotypes of the patients. Our results show that from birth to early in life, the average height and weight of patients with MPS II are above that of the normal controls, until 4 years for height and 9 years for body weight. Short stature is often written in many textbooks as the most typical clinical features of MPS II; however, this makes it difficult for the patients to be diagnosed with MPS II at birth and in the early infantile period by physical appearance. We should remind that patients with MPS II show overgrowth in infantile period before they develop growth retardation. This overgrowth may be valuable to detect MPS II in the early infantile period and requires the development of an accurate newborn screening, allowing the treatment of the disease before signs and symptoms appear.
We combined the two phenotypes to create the most accurate standard growth chart for patients suffering from MPS II. The pattern of growth of patients with MPS II is characterized by impaired growth velocity by the first year of age that progresses throughout life. By 9 years of age, the height velocity of patients with MPS II had grown smaller, compared with that of the normal control. Growth in patients with the severe phenotype stopped by 12 years of age. However, growth did not stop in patients with the attenuated phenotype, whose height continued to grow up to 18 years of age. Our results suggested that from ages 9 to 18 years old, there was no significant difference in height between the phenotypes of patients; however, the reliability of these measurements is limited by the small number of patients in these age groups. Therefore, we cannot conclude the two phenotypes show the same growth patterns in the later years of our study.
The difference in pattern of growth velocity between patients and the normal controls could be revised by further accumulation of data from patients with MPS II. The overgrowth of patients with MPS II was observed at birth and the mean birth length of the patients was between the 75th and 90th percentiles of the normal control. The mean height of MPS II patients from one month of age until 1.5 years of age was above the 90th percentile of the normal control. By 4 years of age, the mean height for MPS II patients fell below the 50th percentile of the normal control. It is noteworthy that overgrowth in early life has also been pointed out in MPS I, IVA, and VI [20,21]. It is unclear where this initial overgrowth comes from, but because it is found in other types of MPS, there is likely some common mechanism. This may be due to hormonal changes present during fetal development and/or during the early life of MPS patients.
The appearance of CNS involvement usually manifests from the ages of 6 to 8, with progressive neurological impairment and regression [1], which seems to closely follow the development of hydrocephalus, at a median age of 5.8 years old [3]. The appearances of these traits appeared 3 years after the mean height fell below that of the normal control at 4 years of age.
This study has three limitations to interpret the growth patterns of the patients with MPS II. First of all, because the number of measurements taken from each patient grew smaller with age, especially after 13 years of age, one can argue whether the current collected data can reflect the natural course of the disease through the life of Hunter syndrome. Complicating the issue was that most of the patients who did not provide data had the severe phenotype, possibly biasing the results towards attenuated patients in the higher ages of our study. This stems from the fact that patients with the severe phenotype have a life expectancy of only one to two decades. Another limitation of our study is that the data collected came from one ethnic background. While this data allows for an accurate tool to track the progression of the disease and any treatments given to Japanese patients, it may not apply to other ethnicities. It is of great interest to investigate whether other ethnic populations have the same growth patterns or not. Nevertheless, since there has been no growth chart available for patients with MPS II until now, the growth charts in this study should provide a significant impact to understand physical development of patients with MPS II. Finally, the accuracy of body length measurements might vary due to contractures, an inability to stand erect, and lack of cooperation in performing the measurements.
As in height, the body weights of patients with MPS II are above during infantile and early childhood period and then markedly below those of age-matched controls. At 17 years of age, the BMI for 75 % of patients with MPS II was above the mean value for the age-matched control. By 18 years of age, approximately 25% of patients have BMIs that indicate the patients as being overweight, BMI between 25–30 (kg/m2); and 50% of patients have BMIs that indicate the patient as being obese, BMI >30 (kg/m2). The source of greater weights in patients with MPS II is due to not only a lower level of daily activity, but also the large and thick skull, the huge liver, and the fluid congestion by heart dysfunction. Higher weights were seen in attenuated patients from 13 to 18 years of age. The final weight for patients with an attenuated form was heavier by 12.1 kg than that for patients with a severe form. Such difference in weight can be associated with a higher height in patients with an attenuated form. Physicians should consider the effect of overweight or obesity to the activity of daily life in Hunter syndrome.
As of now, the cause of the short stature in patients with MPS II remains unsolved, but may be caused by disturbances in the osseous growth-plate region [1]. The disturbances most likely come from the accumulation of the GAG substrates in the chondrocytes of the epiphyseal plate and ECM. This accumulation may produce abnormal collagen in ECM and block normal ossification, as proposed in MPS IVA by Zustin et al. (2010) [22].
In conclusion, we have defined the first growth charts of MPS II in a Japanese population, which will be useful to know the progression of the disease and to monitor therapeutic efficacy. Overgrowth in infantile period and severe undergrowth thereafter were the characteristic feature of growth pattern in MPS II. This growth chart contributes to the clarification of the mechanism of overgrowth at an early stage and growth retardation with age in Hunter syndrome.
Figure 10. BMI curve for patients with MPS II from birth to 18 years of age.
The dotted line shows the mean BMI for healthy males. The solid line shows BMIs for patients with MPS II. Arrows point to their respective percentile curves.
Highlights.
Growth charts of patients with MPS II were established
Overgrowth was observed in infantile period
Short stature was marked with age
No clear difference in growth was observed by phenotype
The reader will understand natural history of growth in patients with MPS II
ACKNOWLEDGMENTS
This work was supported by grants from the Austrian MPS Society, the National MPS Society, and the International Morquio Organization (Carol Ann Foundation), and the research grant for intractable diseases from the Ministry of Health, Labour, and Welfare of Japan. S.T. was supported by National Institutes of Health grant 5 P20 RR020173-07. The content of the article has not been influenced by the sponsors.
Abbreviations
- DS
dermatan sulfate
- ECM
extracellular matrix
- ERT
enzyme replacement therapy
- GAG
glycosaminoglycan
- HSCT
hematopoietic stem cell therapy
- HS
heparan sulfate
- I2S
iduronate 2-sulfatase
- LSD
Lysosomal storage disorder
- MPS II
mucopolysaccharidosis II
- SRT
substrate reduction therapy
Footnotes
Publisher's Disclaimer: This is a PDF file of an unedited manuscript that has been accepted for publication. As a service to our customers we are providing this early version of the manuscript. The manuscript will undergo copyediting, typesetting, and review of the resulting proof before it is published in its final citable form. Please note that during the production process errors may be discovered which could affect the content, and all legal disclaimers that apply to the journal pertain.
REFERENCES
- 1.Scarpa M. Mucopolysaccharidosis Type II. In: Pagon RA, Adam MP, Bird TD, Dolan CR, Fong CT, Stephens K, editors. GeneReviews™ [Internet] Seattle (WA): University of Washington, Seattle; 1993–2013. 2007 Nov 06 [updated 2011 Feb 22] [Google Scholar]
- 2.Valayannopoulos V. Enzyme replacement therapy and substrate reduction therapy in lysosomal storage disorders with neurological expression. Handb. Clin. Neurol. 2013;113:1851–1857. doi: 10.1016/B978-0-444-59565-2.00055-1. [DOI] [PubMed] [Google Scholar]
- 3.Wraith JE, Beck M, Giugliani R, Clarke J, Martin R, Muenzer J HOS Investigators. Initial report from the Hunter Outcome Survey. Genet. Med. 2008;10:508–516. doi: 10.1097/gim.0b013e31817701e6. [DOI] [PubMed] [Google Scholar]
- 4.da Silva EMK, Strufaldi MLW, Andriolo RB, Silva LA. Enzyme replacement therapy with idursulfase for mucopolysaccharidosis type II (Hunter syndrome) Cochrane Database of Systematic Reviews. 2011;(Issue 11) doi: 10.1002/14651858.CD008185.pub2. Art. No.: CD008185. [DOI] [PubMed] [Google Scholar]
- 5.Nelson J, Crowhurst J, Carey B, Greed L. Incidence of the mucopolysaccharidoses in Western Australia. Am. J. Med. Genet. A. 2003;123A:310–313. doi: 10.1002/ajmg.a.20314. [DOI] [PubMed] [Google Scholar]
- 6.Baehner F, Schmiroeskamp C, Krummenauer F, Miebach E, Bajbouj M, Whybra C, Kohlschutter A, Kampmann C, Beck M. Cumulative incidence rates of the mucopolysaccharidoses in Germany. J. Inherit. Metab. Dis. 2005;28:1011–1017. doi: 10.1007/s10545-005-0112-z. [DOI] [PubMed] [Google Scholar]
- 7.Lin HY, Lin SP, Chuang CK, Niu DM, Chen MR, Tsai FJ, Chao MC, Chiu PC, Lin SJ, Tsai LP, Hwu WL, Lin JL. Incidence of the mucopolysaccharidoses in Taiwan, 1984–2004. Am J Med Genet. A. 2009;149A(5):960–964. doi: 10.1002/ajmg.a.32781. [DOI] [PubMed] [Google Scholar]
- 8.Pollard LM, Jones JR, Wood TC. Molecular characterization of 355 mucopolysaccharidosis patients reveals 104 novel mutations. J. Inherit. Metab. Dis. 2013;36(2):179–187. doi: 10.1007/s10545-012-9533-7. [DOI] [PubMed] [Google Scholar]
- 9.Collins ML, Trabouls EI, Maumenee IH. Optic nerve head swelling and optic atrophy in the systemic mucopolysaccharidoses. Ophthalmology. 1990;97:1445–1449. doi: 10.1016/s0161-6420(90)32400-4. [DOI] [PubMed] [Google Scholar]
- 10.Ochiai T, Suzuki Y, Kato T, Shichino H, Chin M, Mugishima H, Orii T. Natural history of extensive Mongolian spots in mucopolysaccharidosis type II (Hunter syndrome): a survey among 52 Japanese patients. J Eur Acad Dermatol Venereol. 2007;(8):1082–1085. doi: 10.1111/j.1468-3083.2007.02203.x. [DOI] [PubMed] [Google Scholar]
- 11.Mendelsohn NJ, Harmatz P, Bodamer O, Burton BK, Giugliani R, Jones SA, Lampe C, Malm G, Steiner RD, Parini R. Hunter Outcome Survey Investigators. Importance of surgical history in diagnosing mucopolysaccharidosis type II (Hunter syndrome): data from the Hunter Outcome Survey. Genet Med. 2010;(12):816–822. doi: 10.1097/GIM.0b013e3181f6e74d. [DOI] [PubMed] [Google Scholar]
- 12.Tanaka A, Okuyama T, Suzuki Y, Sakai N, Takakura H, Sawada T, Tanaka T, Otomo T, Ohashi T, Ishige-Wada M, Yabe H, Ohura T, Suzuki N, Kato K, Adachi S, Kobayashi R, Mugishima H, Kato S. Long-term efficacy of hematopoietic stem cell transplantation on brain involvement in patients with mucopolysaccharidosis type II: a nationwide survey in Japan. Mol. Genet. Metab. 2012;107:513–520. doi: 10.1016/j.ymgme.2012.09.004. [DOI] [PubMed] [Google Scholar]
- 13.Heese BA. Current strategies in the management of lysosomal storage diseases. Semin. Pediatr. Neurol. 2008;15(3):119–126. doi: 10.1016/j.spen.2008.05.005. [DOI] [PubMed] [Google Scholar]
- 14.Jones SA, Parini R, Harmatz P, Giugliani R, Fang J, Mendelsohn NJ HOS Natural History Working Group on behalf of HOS Investigators. The effect of idursulfase on growth in patients with Hunter syndrome: data from the Hunter Outcome Survey (HOS) Mol. Genet. Metab. 2013;109(1):41–48. doi: 10.1016/j.ymgme.2013.03.001. [DOI] [PubMed] [Google Scholar]
- 15.Muenzer J, Wraith JE, Beck M, Giugliani R, Harmatz P, Eng CM, Vellodi A, Martin R, Ramaswami U, Gucsavas-Calikoglu M, Vijayaraghavan S, Wendt S, Puga AC, Ulbrich B, Shinawi M, Cleary M, Piper D, Conway AM, Kimura A. Aphase II/III clinical study of enzyme replacement therapy with idursulfase inmucopolysaccharidosis II (Hunter syndrome) Genet. Med. 2006;8:465–473. doi: 10.1097/01.gim.0000232477.37660.fb. [DOI] [PubMed] [Google Scholar]
- 16.Muenzer J, Beck M, Eng CM, Giugliani R, Harmatz P, Martin R, Ramaswami U, Vellodi A, Wraith JE, Cleary M, Gucsavas-Calikoglu M, Puga AC, Shinawi M, Ulbrich B, Vijayaraghavan S, Wendt S, Conway AM, Rossi A, Whiteman DA, Kimura A. Long-term, open-labeled extension study of idursulfase in the treatment of Hunter syndrome. Genet. Med. 2011a;13:95–101. doi: 10.1097/GIM.0b013e3181fea459. [DOI] [PubMed] [Google Scholar]
- 17.Muenzer J, Beck M, Giugliani R, Suzuki Y, Tylki-Szymanska A, Valayannopoulos V, Vellodi A, Wraith JE. Idursulfase treatment ofHunter syndrome in children younger than 6 years: results from the Hunter Outcome Survey. Genet. Med. 2011b;13:102–109. doi: 10.1097/GIM.0b013e318206786f. [DOI] [PubMed] [Google Scholar]
- 18.Rózdzynska A, Tylki-Szymanska A, Jurecka A, Cieslik J. Growth pattern and growth prediction of body height in children with mucopolysaccharidosis type II. Acta Paediatr. 2010;100:456–460. doi: 10.1111/j.1651-2227.2010.02060.x. [DOI] [PubMed] [Google Scholar]
- 19.Pinto LL, Schwartz IV, Puga AC, Vieira TA, Munoz MV, Giugliani R. Prospective study of 11 Brazilian patients with mucopolysaccharidosis II. J. Pediatr. (Rio J) 2006;82:273–278. doi: 10.2223/JPED.1512. [DOI] [PubMed] [Google Scholar]
- 20.Tomatsu S, Montaño A, Oikawa H, Giugliani R, Harmatz P, Smith M, Sasuki Y, Orii T. Preedy VR, editor. Impairment of body growth in mucopolysaccharidoses. Handbook of Growth and growth monitoring in health and disease. 2012:2091–2116. Handbook of Growth and Growth Monitoring in health and disease, DOI 10.1007/978-1-4419-1795-9_126, © Springer science+Business media, LLC 2012. [Google Scholar]
- 21.Montaño AM, Tomatsu S, Brusius A, Smith M, Orii T. Growth charts for patients affected with Morquio A disease. Am. J. Med. Genet. A. 2008;146A(10):1286–1295. doi: 10.1002/ajmg.a.32281. [DOI] [PubMed] [Google Scholar]
- 22.Zustin J. Morquio disease: the role of cartilage canals in the pathogenesis of chondrogenic dwarfism. Med. Hypotheses. 2010;75:642–644. doi: 10.1016/j.mehy.2010.08.006. [DOI] [PubMed] [Google Scholar]


