Abstract
Complex dose delivery techniques like intensity-modulated radiation therapy (IMRT) require dose measurement in three dimensions for comprehensive validation. Previously, we demonstrated the feasibility of the “PRESAGE™/optical-computed tomography (CT)” system for the threedimensional verification of simple open beam dose distributions where the planning system was known to be accurate. The present work extends this effort and presents the first application of the PRESAGE™/optical-CT system for the verification of a complex IMRT distribution. A highly modulated 11 field IMRT plan was delivered to a cylindrical PRESAGE™ dosimeter (16 cm in diameter and 11 cm in height), and the dose distribution was readout using a commercial scanninglaser optical-CT scanner. Comparisons were made with independent GAFCHROMIC® EBT film measurements, and the calculated dose distribution from a commissioned treatment planning system (ECLIPSE®). Isodose plots, dose profiles, gamma maps, and dose-volume histograms were used to evaluate the agreement. The isodose plots and dose profiles from the PRESAGE™/optical-CT system were in excellent agreement with both the EBT measurements and the ECLIPSE® calculation at all points except within 3 mm of the outer edge of the dosimeter where an edge artifact occurred. Excluding this 3 mm rim, gamma map comparisons show that all three distributions mutually agreed to within a 3% (dose difference) and 3 mm (distance-to-agreement) criteria. A 96% gamma pass ratio was obtained between the PRESAGE™ and ECLIPSE® distributions over the entire volume excluding this rim. In conclusion, for the complex IMRT plan studied, and in the absence of inhomogeneities, the ECLIPSE® dose calculation was found to agree with both independent measurements, to within 3%, 3 mm gamma criteria.
Keywords: dosimetry, 3D, PRESAGE, optical, computed tomography, CT, IMRT, quality assurance, gel
I. INTRODUCTION
A practical and low-cost three-dimensional (3D) dosimetry system would be a valuable addition to existing tools for intensity-modulated radiation therapy (IMRT) commissioning and routine verification. At present IMRT commissioning is often performed with a combination of two-dimensional (2D) relative dose measurement (radiographic or Gafchromic film1 or diode arrays2) and absolute dose measurements at a few points with a calibrated ion chamber. Achieving comprehensive verification in 3D with these tools presents at best a limited sampling of the 3D distribution and can be very time consuming and difficult to do well. The challenge of attempting comprehensive 3D dosimetric verification with 2D and one-dimensional techniques, may well be a contributing factor to a widespread incidence of IMRT implementation errors that have recently been reported by the Radiological Physics Center.3,4 The development and introduction of practical and accurate 3D dosimetry techniques may help to reduce the incidence of IMRT implementation errors.
A number of articles5–7 have reviewed the many studies demonstrating the feasibility of 3D gel-dosimetry techniques for comprehensive 3D dose measurement. A 3D gel, often contained in a specialized container impermeable to oxygen, records the delivered dose which can subsequently be imaged by a variety of methods including optical computed tomography (optical-CT),6,8–12 magnetic resonance imaging,7,13 or x-ray-CT.14 Here, we focus on optical-CT as it represents a low-cost and high resolution imaging modality. Achieving accurate optical-CT readout in early polymer gel dosimeters was challenging because of the presence of scattered light originating from radiation induced polymer microparticles within the gel.9 Light scatter is the mechanism of radiation induced optical contrast in these gels. Scatter artifacts may arise, and scan times are longer because of the need for scanning configurations which achieve efficient scatter rejection, at the expense of slow scanning speed.6,15,16 Other limitations of 3D gel dosimeters may include sensitivity of the response to oxygen and the requirement for an external container where dose-readout is lost.
Recently, PRESAGE™ (Heuris, Inc., Pharma LLC) was introduced as a material with attractive characteristics for 3D dosimetry.17,18 PRESAGE™ is a solid polyurethane plastic which does not need an external container, permitting in theory, dose-measurement close to the edge of the dosimeter. PRESAGE™ exhibits a radiochromic response as it turns green upon exposure to radiation. The mechanism of optical contrast is light absorption (as opposed to light scatter), and the low scatter contamination renders the material well suited for accurate optical-CT readout. The plastic nature of PRESAGE™ renders it also amenable to machining to customized shapes and sizes.
Previous work has focused on fundamental studies of the basic radiochromic and dosimetric characteristics of PRESAGE™,18 and investigation of the feasibility of PRESAGE™/optical-CT system for 3D dosimetry.12 The latter investigations involved delivering simple dose distributions that were known to be well modeled by the ECLIPSE® treatment planning system. The ECLIPSE® dose distribution could thus be used as gold standard against which to evaluate the PRESAGE™/optical-CT dosimetry system. Excellent agreement was observed demonstrating the feasibility of the system for accurate 3D dosimetry in large volume PRESAGE™ dosimeters. The present study uses similar dosimeters and builds on this earlier work by applying the PRESAGE™/optical-CT system to the verification of a highly complex IMRT delivery, where the accuracy of the ECLIPSE® distribution is no longer well known. Independent measurements were also performed using EBT Gafchromic film. Comparison with two independent measurements enabled investigation into the accuracy with which the ECLIPSE® IMRT dose calculation algorithm models actual delivery in the case studied.
II. MATERIALS AND METHODS
II.A. The PRESAGE™ 3D dosimeter
PRESAGE™ is a transparent and solid polyurethane plastic doped with a radiochromic leuco dye which exhibits radiation induced color change, with peak absorption occurring at ~633 nm. Different formulation protocols yield dosimeters with varying radiochromic characteristics. In the present work, cylindrical PRESAGE™ dosimeters 16 cm diameter and 11 cm height were used, similar to those in Ref. 12 and with an effective atomic number of 8.3, a physical density of 1.07 g/cm3, and a CT number of ~200. The radiochromic response of PRESAGE™ has been found to be linear with dose and stable to within 2% within 2 days after irradiation.18 The sensitivity was determined spectropho-tometrially to be ~0.023 cm−1 Gy−1, and calculations following the method outlined by Xu et al.19 indicated a dose of 6 Gy to the planning target volumes (PTVs) would yield a close to optimal maximum attenuation (optical density =0.7 m−1) within the dosimeter for the MGS scanner.
II.B. OCTOPUS™ optical CT scanner
Optical-CT was used to readout the 3D dose distributions recorded in the PRESAGE™ dosimeters. The optical-CT scanner was acquired from MGS Research Inc. (Madison, CT) and is referred to as the OCTOPUS™ scanner. A full description of the OCTOPUS™ is given in Ref. 12, and only a brief overview is presented here. The OCTOPUS™ scanner incorporates a He–Ne laser beam (wavelength 633 nm, diameter ~0.8 mm), which translates across the dosimeter to acquire a single projection of data. Two photodiodes acquire the transmitted and reference laser signal data, respectively. The dosimeter is mounted on a turn table in an aquarium containing a semitransparent fluid of matched index of refraction to minimize refraction of the laser during each projection. The fluid in the aquarium was a mixture of octyl salicylate and methoxy octyl cinnamate (RI=1.504). After each projection, the dosimeter is rotated a set amount (e.g., 1 deg), ready for acquisition of the next projection. Once all the projections are acquired for a particular slice, the laser was moved up or down to scan the next slice. Synchronization of motion control (laser translation) and data acquisition was achieved using TESTPOINT® (CEC, Inc., Billerica, MA).
II.C. IMRT dose verification experiment
IMRT treatment of the cylindrical PRESAGE™ dosimeter proceeded in a similar manner to that for an actual patient. First, a treatment planning x-ray CT scan was taken of the dosimeter with the cylindrical axis parallel to the long axis of the couch (i.e., in treatment position). Isocentric “cross” marks were scribed onto the dosimeter to enable subsequent registration of the measured and calculated distributions. Marks were made with a scalpel blade and were just deep enough to be visible on the optical-CT projection scans with-out causing severe streak artifacts. Prior to the x-ray CT scan, three CT markers of 1 mm diameter (X-SPOTS®, BEEKLEY, Bristol, CT) were attached to the dosimeter at the locations of the three cross marks. Prior tests confirmed that the low dose of the x-ray CT (~1 cGy) does not induce any measurable optical density (OD) change in the dosimeter.12 For treatment, the dosimeter was positioned on the treatment couch to match the setup in the treatment plan (described in Sec. II C 1, below) and irradiated at room temperature by a Varian 21EX linear accelerator.
II.C.1. Target definition and treatment planning
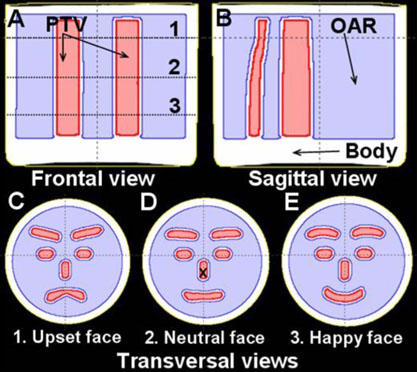
The IMRT plan was created in a commissioned ECLIPSE® treatment planning system. Multiple PTVs were contoured on the CT slices, such that serial browsing of the contoured slices gave the appearance of a schematic human face changing from “upset” to “neutral” to “happy” (Fig. 1). The region outside the PTVs, including a 4 mm margin, was labeled as an organ-at-risk (OAR). This complex multicomponent PTV, with complex geometrical changes in all three dimensions, represents a highly challenging planning problem. An 11 field coplanar IMRT plan was created with 6 MV beams equally distributed over 360 deg, with gantry angles of 15°, 50°, 80°, 115°, 145°, 180°, 215°, 245°, 280°, 315°, and 345° respectively. The ECLIPSE® inverse planning optimization was run to achieve a uniform 6 Gy to the PTV while minimizing the dose to the surrounding OAR. The standard pencil beam algorithm in ECLIPSE® was then used to calculate the 3D dose distribution within the dosimeter, with an in-plane spatial resolution of 1.25 mm2.
FIG. 1.
Frontal (a), sagital (b), and axial (c)–(e) views of the PRESAGE™ dosimeter showing the segmented structures used for treatment planning; the external contour (BODY), OAR, and PTV, respectively. The locations of the three axial views (c–e) are indicated as the dotted lines 1–3 in (a). In the axial view, the multicomponent PTV appears to gradually change from an upset schematic face (c), to neutral (d), and to a happy schematic face (e). There is a 4 mm margin between the PTV and the surrounding OAR. Delivery of a homogenous uniform dose to the multicomponent PTV, while minimizing the dose to the surrounding OAR, represents an extremely challenging treatment planning problem for the ECLIPSE® IMRT algorithm.
II.C.2. 3D dose measurement by OCTOPUS™ optical-CT scanner
The PRESAGE™ dosimeter was scanned using the OCTOPUS™ scanner both before (prescan) and after (postscan) the IMRT irradiation. Each scan consisted of 31 transaxial slices, with 2 mm separation, where each slice was reconstructed from 100 projections separated by 1.8° angular increments. Scanning time for a single slice was about 7 min, with about 4 h required to scan each dosimeter. When all projections had been acquired, the 3D distribution of radiochromic absorption was reconstructed using in house MATLAB software based on the filtered backprojection algorithm (Mathworks, Natic, MA). Reconstruction resolution was 0.5 mm in-plane, with consistent slice separation of 2 mm. The radiation induced change in OD throughout the dosimeter was determined by subtracting the prescan reconstruction from the postscan reconstruction. Because of the linear relationship between OD change and dose,18 the net distribution after subtraction represents the relative distribution of the absorbed dose in the dosimeter. The net OD distribution was normalized at a fixed point in the PTV [shown as a cross mark in Fig. 1(d)]. Scans were performed such that the three alignment marks were included in one of the reconstructed slices, such that they could facilitate registration with x-ray CT and hence the calculated dose distribution from ECLIPSE®.
II.C.3. Dose measurement by EBT film
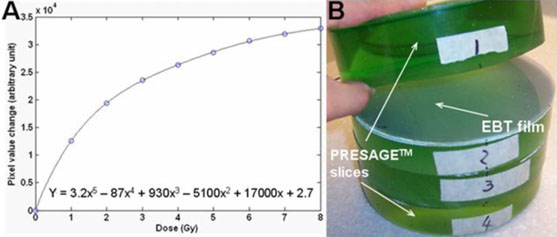
Independent 2D dose measurements in selected planes were made by Gafchromic® EBT film so as to facilitate resolution of any discrepancies between the PRESAGE™/ optical-CT and ECLIPSE® distributions. The EBT film/ EPSON4990 flatbed scanning system was chosen because of its practical convenience for phantom studies, increased accuracy through avoidance of film processing, energy and directional independence, and temporal stability of response.12,20 Accurate dosimetry can be achieved provided scans are acquired with consistent methodology including orientation, positioning, and timing.21 A calibration curve was acquired at the same time as the experimental irradiations and is shown in Fig. 2(a). The methodology for calibration is described in.12 On completion of the optical-CT scanning described in Sec. II C 2, the dosimeter was cut into four sections [Fig. 2(b)] and three EBT films (each 16 cm in diameter) from the same batch were cut to fit as shown to measure the dose at different axial slice locations. Three marks were made on each film to match the three alignment marks on the dosimeter. Matching these marks enabled image registration between the EBT, planning and PRESAGE™/optical-CT dose distributions. The dosimeter together with the film inserts was then irradiated with the same 11 field IMRT treatment plan. The irradiated EBT films were subsequently scanned using an EPSON® perfection 4990 flatbed scanner in transmission mode. The EBT film was also scanned preirradiation to enable determination of the radiation induced EBT change. The EPSON scanner acquires 16 bit image data in each of three channels (red, green, and blue) but only the red channel was extracted for analysis because EBT has a maximum response to red light at ~633 nm.20 The calibration curve was applied to the EBT film to enable conversion to dose.
FIG. 2.
(a) The calibration curve for EBT film to 6 MV radiation. (b) After the PRESAGE™ dosimeter was scanned by optical-CT, it was cut into four axial sections. The locations of the cut planes correspond to the optimal representations of the upset, neutral, and happy face representations shown in Fig. 1. EBT films (~16 cm diameter) were inserted at the cut planes, as shown, to provide independent measurement of the planar dose distributions in these planes.
II.C.4. Dose registration and evaluation
The 3D dose distribution measured by the PRESAGE™/ optical-CT system (PRESAGE™ dose), the planar dose measured by the EBT film (EBT dose), and the calculated 3D dose from the ECLIPSE® (ECLIPSE® dose), were all loaded into DoseQA software24 for registration and analysis. The alignment marks served as markers for registering the data sets. Three-way comparison between the dose measurements (PRESAGE™ and EBT) and calculation (ECLIPSE®) was performed using qualitative and quantitative tools including dose profiles, isodose line plots, dose-volume histograms, and gamma maps (3% dose difference and 3 mm distance-to-agreement). True 3D comparisons were only feasible between the PRESAGE™ and ECLIPSE® distributions. However, in the three planes where EBT data was available, three-way comparisons were performed.
III. RESULTS AND DISCUSSIONS
III.A. Dose measurement by PRESAGE™—optical-CT system
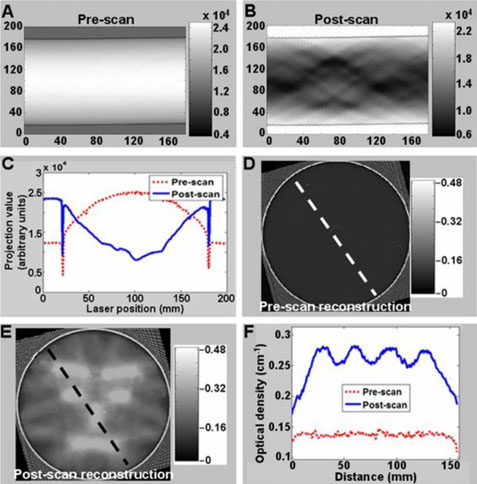
A full set of pre- and post-irradiation optical-CT data is shown in Fig. 3 for the central slice through the PRESAGE™ dosimeter, corresponding to the clearest representation of the neutral face distribution. The sinograms of transmitted light intensity [Figs. 3(a) and 3(b)] indicae negligible attenuation in the dosimeter prior to irradiation, and significant and variable attenuation post-irradiation. Data from a single illustrative projection [Fig. 3(c)] shows good signal to noise characteristics and matching to the dynamic range of the detector. The “edge artifact” commonly observed in optical-CT scanning is observed as the loss of signal at the edges of the dosimeter where laser light is refracted away from the detector such that the edge of the dosimeter appears to strongly attenuate the laser light. The narrow width of the signal loss indicates a good index match of the dosimeter to the fluid. Strong absorption is observed in the post-irradiated profile, which extends out near to the edge of the dosimeter, corresponding to PTV regions closer to the edge. Primary sources of noise in optical CT projections include impurity particles in the fluid drifting into the path of the laser beam, small scratches and imperfections in and on the surface of the dosimeter, and nonuniform transmittance through the walls of the aquarium. It is anticipated that the noise can be reduced further by more sophisticated PRESAGE™ manufacturing techniques, better fluidfiltration, and better “flood field” correction for imperfections in the walls of the aquarium.
FIG. 3.
A complete set of optical-CT scan data of the PRESAGE™ dosimeter acquired with the OCTOPUS™ optical-CT scanner. Data from the central slice are shown and are representative of all other slices. The first row [(a) and (b)] shows the pre- and post-irradiation sinograms of projection data for the entire slice (laser light intensity, x axis(projection number, y axis(mm along the projection). Individual pre- and post-irradiation projection profiles are shown in (c). Pre- and post-irradiation reconstructed optical attenuation maps are shown in (d) and (e), respectively. Corresponding profile data through the reconstructed images along the indicated dashed lines are shown in (f).
The corresponding pre- and post-irradiation optical CT reconstructions of the slice are shown in Figs. 3(d) and 3(e), with an example profile through the reconstructed images given in Fig. 3(f). The reconstructed neutral face distribution is clearly visible, as is the edge artifact observed in the outer 3 mm of the dosimeter. The quality of data right out to this edge is a substantial improvement over our previous work,12 where data were lost within 1 cm of the wall. The improvement is attributed to better refractive index matching of the fluid, the use of a more attenuating fluid, but mostly to the fact that an improved PRESAGE™ formulation was used which maintains accurate dose information out to the edge of the dosimeter. In Fig. 3 data loss is restricted to ~3 mm of the edge as indicated in the profile data in Fig. 3(f), which shows the pre-irradiation attenuation is very uniform right out to within a few milimeters of the edge of the dosimeter. The post irradiation profile shows clear modulation with low noise. The useful (edge artifact free) region of the dosimeter is about 96% of its diameter.
III.B. Comparison of PRESAGE™/optical-CT, ECLIPSE®, and EBT dose distributions
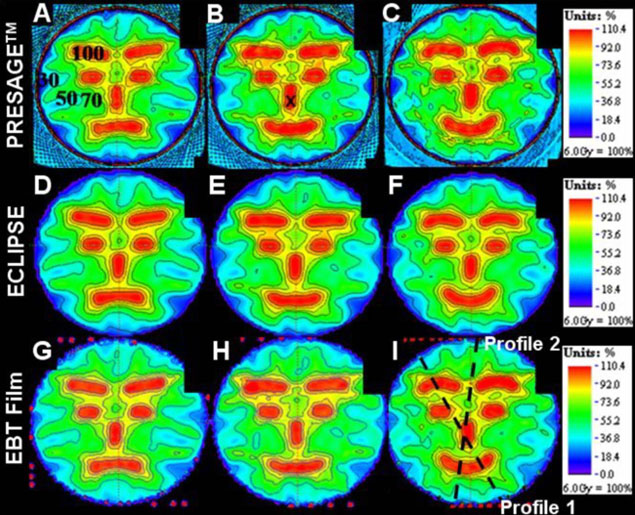
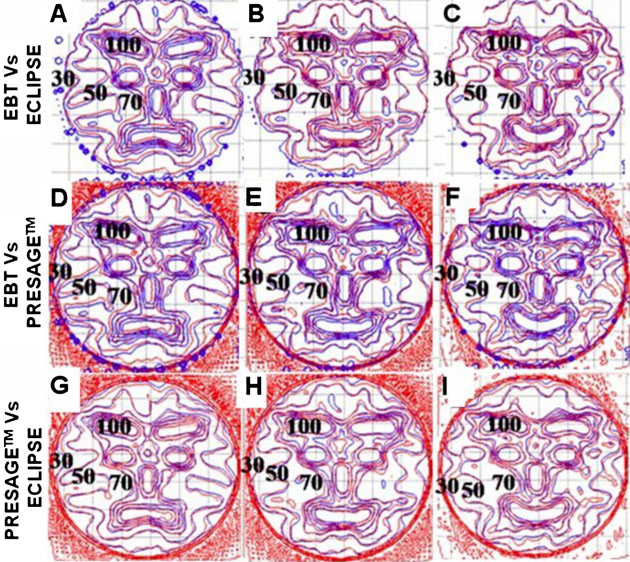
Colorwash isodose distributions for the three selected slices corresponding to best representations of the upset, neutral, and happy face distributions, and where EBT measurements were also available, are compared in Fig. 4. The upper, middle and lower rows correspond to the PRESAGE™/ optical-CT, ECLIPSE®, and the EBT unfiltered dose distributions, respectively. All dose distributions were normalized at the same point, indicated by the cross mark within the nose in Fig. 4(b). In general the three sets of isodose plots show very close agreement between all three distributions. The ECLIPSE® distribution is smoother, with less noise, than either of the measured distributions, as expected. Some relatively minor differences can be discerned between the distributions, but systematic trends are not readily apparent, and it is not possible to state whether the ECLIPSE® distribution agrees more closely with one or the other of the measured distributions. In some cases both measured distributions appear to show a discrepancy with the ECLIPSE® distribution. An example is the 50% (yellow) outer edge to the right eyebrow in both measured distributions [Figs. 4(c) and 4(i)] appear more pronounced than in the ECLIPSE® distribution. But in other areas the ECLIPSE® distribution appears midway between the two measured distributions as in comparing the region between the eyebrows and the eyebrows and eyes in Figs. 4(b), 4(e), and 4(h). In general, no consistent or systematic trends are discerned, and the distributions appear very similar with discrepancies attributed to be within the noise limit. Another consideration is that the two measured distributions (EBT and PRESAGE™) actually correspond to two independent deliveries of the same treatment plan. Any variation in the mechanics of the delivery would also contribute to differences in the measured distribution. A comparison of dose profiles along the dashed lines of Fig. 4(i) is plotted in Fig. 5, and also support the interpretations made in this section. There are regions where both measurements show differences with ECLIPSE®, and others where ECLIPSE® appears to come midway between the measurements. Despite these differences, the agreement between both measured distributions and the calculated distribution from ECLIPSE® remains striking as is further evident in Fig. 6, which shows overlay isodose-line intercomparisons, for the same three slices.
FIG. 4.
Comparison of dose distributions in the three selected slices (see Fig. 1) between PRESAGE™, ECLIPSE®, and EBT film. The first row images [(a)–(c)] are dose distributions from PRESAGE™. The second [(d)–(f)] and third [(g)–(i)] rows are corresponding images from the ECLIPSE® and EBT distributions. The cross mark in (b) indicates the point where the dose distributions were normalized to convert to relative dose. The percent isodose lines (100%, 90%, 80%, 70%, 50%, and 30%) are superimposed onto the dose maps to aid comparison.
FIG. 5.
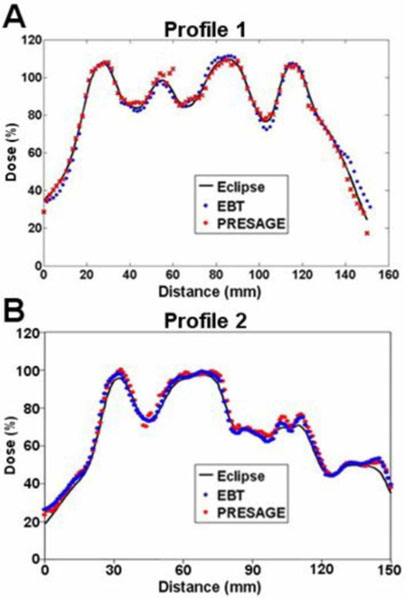
Line profiles through the ECLIPSE®, PRESAGE™, and EBT dose distributions along the dashed lines shown in Fig. 4(i).
FIG. 6.
Isodose overlay plots of the 100%, 90%, 80%, 70%, 50%, and 30% isodose lines for the three selected slices (Fig. 1) between PRESAGE™, ECLIPSE®, and EBT film dose distributions. The first row [(a)–(c)] compares isodose lines between EBT (blue) and ECLIPSE® (red). The second row [(d)–(f)] compares isodose lines between EBT (blue) and PRESAGE™ doses (red). The last row [(g)–(i)] compares isodose lines between ECLIPSE® (blue) and PRESAGE™ (red) doses.
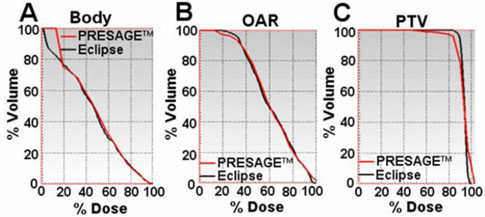
The primary advantage of the PRESAGE™/optical-CT system is the fact it can produce true 3D dosimetry, and this is highlighted in the dose maps and isodose lines of the sagittal view in Fig. 7 and dose-volume histogram (DVH) plots in Fig. 8. As the EBT data only existed in three planes, the sagittal comparisons and DVH plots are between just the PRESAGE™ and ECLIPSE® dose distributions. In general, excellent agreement is again observed for all isodose lines in Fig. 7 except for a slight reduction in dose in the top few slices of the dosimeter in the PRESAGE™ distribution. There was no independent EBT dose to determine which distribution is more accurate here, but it is probably an artifact in the PRESAGE™/optical-CT distribution. Preliminary investigations suggest the cause may be a reflection artifact of laser light from the underside of the top of the dosimeter. The BODY and OAR DVH curves are virtually indistinguishable except at doses below 20%, where the PRESAGE™ dose is artificially high due to the edge artifact. The PTV measured DVH curve indicates that the delivered dose was slightly less homogenous than that calculated by ECLIPSE®, with small regions of relative over and under dose occurring. It is likely that part of this difference is real and part is due to artifacts in the PRESAGE™ distribution. Further interpretation of the significance of these differences is difficult without multiple deliveries, which is beyond the scope of this preliminary study and is the subject of a separate ongoing study.
FIG. 7.
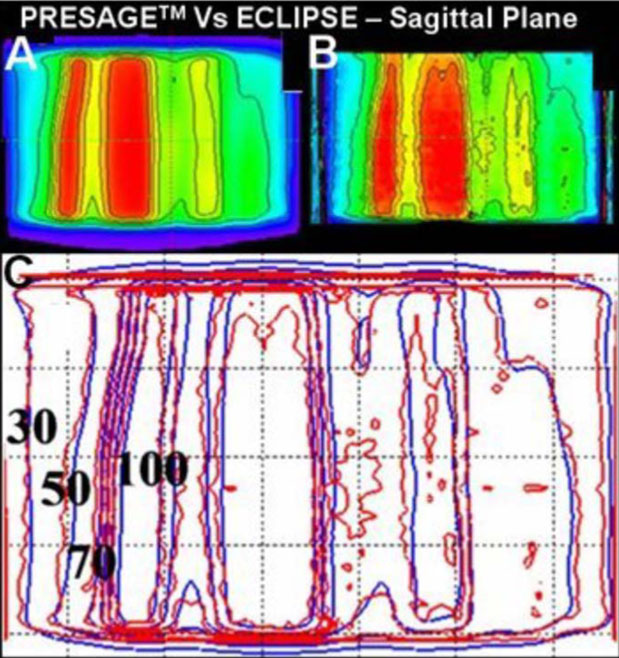
Sagittal view of the dose distributions and superimposed isodose lines from ECLIPSE® (a) and PRESAGE™ (b). (c) is the overlay of isodose lines—100%, 90%, 80%, 70%, 50%, and 30%.
FIG. 8.
Dose-volume histogram comparison between the PRESAGE™ and ECLIPSE® dose distributions. (a), (b), and (c) show overlay of dose volume histograms for the body, OAR, and PTV structures, respectively.
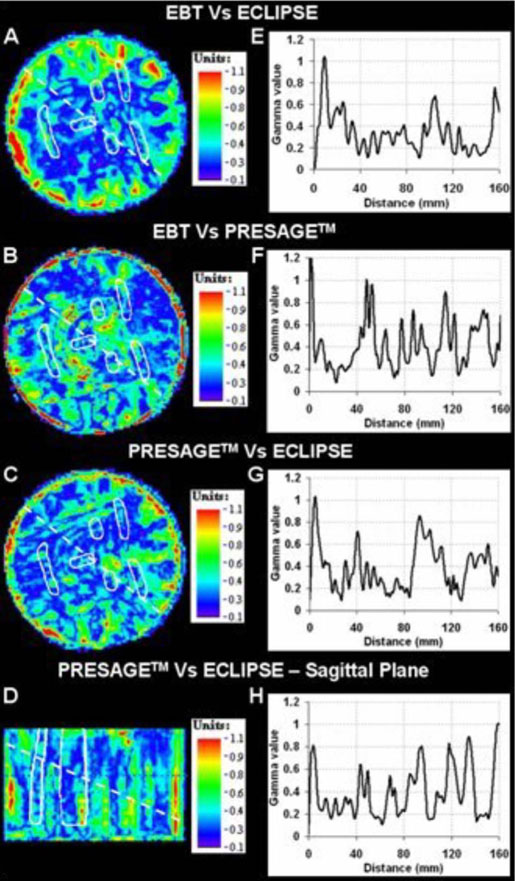
Qualitative comparison tools like isodose plots and overlays illustrate the encouraging performance of the PRESAGE™/optical-CT system for IMRT dose verification. A quantitative estimate of the extent of agreement/ disagreement is, however, required for comprehensive comparative analysis. Comparative gamma maps22,23 were therefore also calculated with acceptance criterion of 3% dose difference and 3 mm distance to agreement. This represents quite stringent criteria, and we note that the Radiological Physics Center uses a 7%—4 mm criteria for planar credentialing for the RTOG head and neck IMRT protocol.4 Gamma plots for the central axial and sagittal slices are shown in Fig. 9. Since only three slices for EBT dose were obtained, sagittal sagittal slice comparative analysis was not possible for EBT. Figures 9(e)–9(h) are line profiles along the dashed lines in the gamma maps. The gamma value is <1 for the most part, which demonstrates that the PRESAGE™—optical-CT dose measurement agrees with both the EBT film dose measurement and the ECLIPSE® treatment plan dose calculation within the 3%—3 mm criteria. The gamma pass rate for the 3D volumetric comparison between the PRESAGE™ and ECLIPSE® dose distributions was 92%. The pass rates for the axial 2D gamma comparisons of EBT versus PRESAGE™ and EBT versus ECLIPSE® were 91.4% and 94.0%, respectively. The majority of failures in all three comparisons occur near the edge of the dosimeter in the outer 3 mm. In this challenging region, the PRESAGE™ and EBT doses are inaccurate because of edge artifacts, and the ECLIPSE® dose is also likely to be inaccurate due to difficulty in modeling the build up region. If this outer 3 mm rim is ignored the pass rate rises to 96% for the 3D comparison of PRESAGE™ with ECLIPSE®, which represents a close agreement for such a complex plan. These pass rates are generally higher than observed in our MAPCHECK 2D QA tests for clinical H&N cases for the same gamma values.
FIG. 9.
Gamma maps on the central axial slice (criteria of 3% dose difference and 3 mm distance to agreement) between ECLIPSE® and EBT (a), PRESAGE™ and EBT (b), and ECLIPSE® and PRESAGE™ (c). (d) shows the gamma map between PRESAGE™ and ECLIPSE® on a sagittal view. PTV structures (white) are also overlaid. Plots (e)–(h) are the corresponding line profiles along the dashed lines.
IV. CONCLUSIONS
Prior work has demonstrated the feasibility of PRESAGE™/optical-CT for 3D dosimetry of simple known distributions. Here we applied the PRESAGE™/optical-CT system to verify the complex 3D distribution from an 11 field IMRT treatment plan. Independent measurement was also made with EBT in selected planes. A three-way comparison between the 3D PRESAGE™/optical-CT measurements, 3D ECLIPSE® calculations, and 2D EBT films measurements is presented. The results demonstrate that for this complex distribution, in the absence of inhomogeneities, the ECLIPSE® calculated distribution agreed with both independent measurements to within a 3% dose difference and 3 mm distance-to-agreement gamma criterion. The PRESAGE™/ optical-CT system acquired a full 3D dose distribution with spatial resolution of 0.5 mm2 in-plane with 2 mm slice spacing for the 16 cm diameter 10 cm height dosimeter in about 7 h. This work reinforces the practicality and effectiveness of the PRESAGE™/optical-CT dosimetry system to effectively address the dosimetric challenges of advanced radiation treatments. Comparison of measured and calculated dose-volume histogram comparisons are presented. These comparisons represent a major attraction of 3D dosimetry techniques, as they convey dosimetric data in a clinically relevant manner. The main limitation at present is the lengthy scan time, but this is likely to substantially reduce in the near future through upgrade of acquisition and motion components.
ACKNOWLEDGMENTS
The work was supported by the NIH Grant No. R01CA100835-02. We are very grateful to Gary Gluckman, Ph.D. for his support of the DOSEQA analysis tool.
References
- 1.Zeidan OA, et al. Characterization and use of EBD radiochromic film for IMRT dose verification. Med. Phys. 2006;33:4064–4072. doi: 10.1118/1.2360012. [DOI] [PubMed] [Google Scholar]
- 2.Letourneau D, Gulam M, Yan D, Oldham M, Wong JW. Evaluation of a 2D diode array for IMRT quality assurance. Radiother. Oncol. 2004;70:199–206. doi: 10.1016/j.radonc.2003.10.014. [DOI] [PubMed] [Google Scholar]
- 3.Molineu A, Hernandez N, Alvarez P, Followill D, Ibbott G. IMRT head and neck phantom irradiations: Correlation of results with institution size. Med. Phys. 2005;32:1983–1984. [Google Scholar]
- 4.Ibbott GS, Molineu A, Followill DS. Independent evaluations of IMRT through the use of an anthropomorphic phantom. Technol. Cancer Res. Treat. 2006;5:481–487. doi: 10.1177/153303460600500504. [DOI] [PubMed] [Google Scholar]
- 5.McJury M, et al. Radiation dosimetry using polymer gels: methods and applications. Br. J. Radiol. 2000;73:919–929. doi: 10.1259/bjr.73.873.11064643. [DOI] [PubMed] [Google Scholar]
- 6.Oldham M. 3D dosimetry by optical-CT scanning. J. Phys. 2006;56:58–71. doi: 10.1088/1742-6596/56/1/006. [DOI] [PMC free article] [PubMed] [Google Scholar]
- 7.De Deene Y. Gel dosimetry for the dose verification of intensity modulated radiotherapy treatments. Z. Med. Phys. 2002;12:77–88. doi: 10.1016/s0939-3889(15)70450-2. [DOI] [PubMed] [Google Scholar]
- 8.Gore JC, Ranade M, Maryanski MJ, Schulz RJ. Radiation dose distributions in three dimensions from tomographic optical density scanning of polymer gels: I. Development of an optical scanner. Phys. Med. Biol. 1996;41:2695–2704. doi: 10.1088/0031-9155/41/12/009. [DOI] [PubMed] [Google Scholar]
- 9.Maryanski MJ, Zastavker YZ, Gore JC. Radiation dose distributions in three dimensions from tomographic optical density scanning of polymer gels: II. Optical properties of the BANG polymer gel. Phys. Med. Biol. 1996;41:2705–2717. doi: 10.1088/0031-9155/41/12/010. [DOI] [PubMed] [Google Scholar]
- 10.Kelly RG, Jordan KJ, Battista JJ. Optical CT reconstruction of 3D dose distributions using the ferrous-benzoic-xylenol (FBX) gel dosimeter. Med. Phys. 1998;25:1741–1750. doi: 10.1118/1.598356. [DOI] [PubMed] [Google Scholar]
- 11.Krstajic N, Doran SJ. Focusing optics of a parallel beam CCD optical tomography apparatus for 3D radiation gel dosimetry. Phys. Med. Biol. 2006;51:2055–2075. doi: 10.1088/0031-9155/51/8/007. [DOI] [PubMed] [Google Scholar]
- 12.Guo P, Adamovics J, Oldham M. A practical three-dimensional dosimetry system for radiation therapy. Med. Phys. 2006;33:3962–3972. doi: 10.1118/1.2349686. [DOI] [PMC free article] [PubMed] [Google Scholar]
- 13.Vergote K, et al. Validation and application of polymer gel dosimetry for the dose verification of an intensity-modulated arc therapy (IMAT) treatment. Phys. Med. Biol. 2004;49:287–305. doi: 10.1088/0031-9155/49/2/008. [DOI] [PubMed] [Google Scholar]
- 14.Hilts M, Jirasek A, Duzenli C. Technical considerations for implementation of x-ray CT polymer gel dosimetry. Phys. Med. Biol. 2005;50:1727–1745. doi: 10.1088/0031-9155/50/8/008. [DOI] [PubMed] [Google Scholar]
- 15.Oldham M, Kim L. Optical-CT gel-dosimetry. II: Optical artifacts and geometrical distortion. Med. Phys. 2004;31:1093–1104. doi: 10.1118/1.1655710. [DOI] [PMC free article] [PubMed] [Google Scholar]
- 16.Oldham M, Siewerdsen JH, Kumar S, Wong J, Jaffray DA. Optical-CT gel-dosimetry I: basic investigations. Med. Phys. 2003;30:623–634. doi: 10.1118/1.1559835. [DOI] [PMC free article] [PubMed] [Google Scholar]
- 17.Adamovics J, Maryanski MJ. Characterisation of PRESAGE: A new 3-D radiochromic solid polymer dosemeter for ionising radiation. Radiat. Prot. Dosim. 2006;120:107–112. doi: 10.1093/rpd/nci555. [DOI] [PubMed] [Google Scholar]
- 18.Guo PY, Adamovics JA, Oldham M. Characterization of a new radiochromic three-dimensional dosimeterm. Med. Phys. 2006;33:1338–1345. doi: 10.1118/1.2192888. [DOI] [PMC free article] [PubMed] [Google Scholar]
- 19.Xu Y, Wuu CS, Maryanski MJ. Determining optimal gel sensitivity in optical CT scanning of gel dosimeters. Med. Phys. 2003;30:2257–2263. doi: 10.1118/1.1593837. [DOI] [PubMed] [Google Scholar]
- 20.Devic S, et al. Precise radiochromic film dosimetry using a flat-bed document scanner. Med. Phys. 2005;32:2245–2253. doi: 10.1118/1.1929253. [DOI] [PubMed] [Google Scholar]
- 21.Fuss M, Sturtewagen E, De Wagter C, Georg D. Dosimetric characterization of GafChromic EBT film and its implication on film dosimetry quality assurance. Phys. Med. Biol. 2007;52:4211–4225. doi: 10.1088/0031-9155/52/14/013. [DOI] [PubMed] [Google Scholar]
- 22.Low DA, Dempsey JF. Evaluation of the gamma dose distribution comparison method. Med. Phys. 2003;30:2455–2464. doi: 10.1118/1.1598711. [DOI] [PubMed] [Google Scholar]
- 23.Low DA, Harms WB, Mutic S, Purdy JA. A technique for the quantitative evaluation of dose distributions. Med. Phys. 1998;25:656–661. doi: 10.1118/1.598248. [DOI] [PubMed] [Google Scholar]
- 24. DoseQA software www.3cognition.com.


