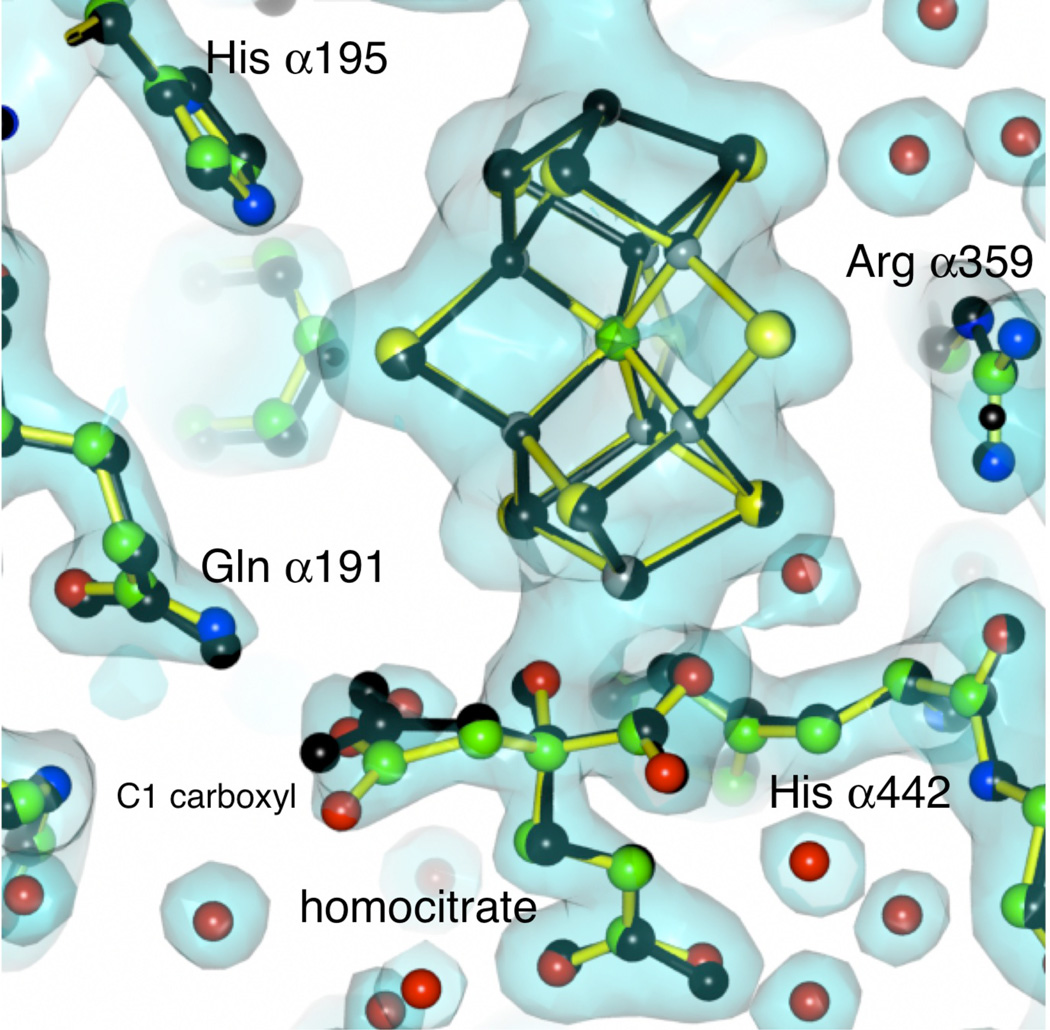
Figure 6.
Electron density map around the FeMo-cofactor and homocitrate of the A. vinelandii MoFe-protein crystallized at pH 9.5. The map is calculated at 2.0 Å resolution and contoured at 1.5 times the standard deviation. The yellow bonds and colored atoms represent the Av1 structure at pH 9.5, while the black bonds and atoms indicate the structure of Av1 at pH 8.0 as determined by Spatzal et al at 1.0 Å resolution (PDB 3U7Q (39)). Overall the two structures are quite similar (rms = 0.3 Å), although a displacement of the C1 carboxyl arm of homocitrate is indicated in the pH 9.5 structure compared to the pH 8.0 structure.

