

Abstract
Objective
In developing countries, newborn omphalitis may contribute significantly to morbidity and mortality. Community-based identification and management of omphalitis will require standardised clinical sign-based definitions. This study aimed to identify optimal sign-based algorithms to define omphalitis in the community and to evaluate the reliability and validity of cord assessments by non-specialist health workers for clinical signs of omphalitis.
Design
Within a trial of the impact of topical antiseptics on umbilical cord infection in rural Nepal, digital images of the umbilical cord were collected. Workers responsible for in-home examinations of the umbilical cord evaluated the images for signs of infection (pus, redness, swelling). Intra- and inter-worker agreement was evaluated, and sensitivity and specificity compared to a physician-generated gold standard ranking was estimated.
Results
Sensitivity and specificity of worker evaluations were high for pus (90%, 96% respectively) and moderate for redness (57%, 95% respectively). Swelling was the least reliably identified sign. Measures of observer agreement were similar to that previously recorded between experts evaluating subjective skin conditions. A composite definition for omphalitis that combined pus and redness without regard to swelling was the most sensitive and specific.
Conclusions
Two sign-based algorithms for defining omphalitis are recommended for use in the community. Focusing on redness extending to the skin around the base of the stump will identify cases of moderate and high severity. Requiring both the presence of pus and redness will result in a definition with very high specificity and moderate to high sensitivity.
Keywords: Omphalitis, neonatal infection, umbilical cord infection, validation, Nepal
INTRODUCTION
Omphalitis contributes to neonatal morbidity and mortality in developing countries.[1] However, community-based data on timing, case-fatality, and incidence of non-tetanus umbilical cord infection await identification of the best set of clinical signs to define infection. Evaluation of the performance of community health workers in recognising signs of omphalitis is a crucial step in translating clinical-based diagnostic approaches to the community setting.
Umbilical cord infections present with variable signs, including pus, erythema, swelling, warmth, tenderness, and/or foul odor. In both developed [2][3][4] and developing country settings [5][6][7][8] clinical definitions have varied considerably, and in some cases have required a positive umbilical culture. Diagnosis in the community, however, must be based solely on clinical signs of infection. An evaluation of the relative reliability and validity of potential signs is essential to the development of useful operational sign-based definitions of omphalitis.
In visually-dependent areas of medicine, formulating an accurate differential diagnosis from photographic slides is well integrated into training programs.[9][10][11][12][13] Classification of signs of skin lesions, however, is subjective and leads to substantial within-observer variation, even among experts.[14][15][16][17][18] The reliability of community health workers in identifying signs of omphalitis has not yet been assessed, and comparing worker assessments to those of a medical expert would provide credibility to use of field-based diagnostic algorithms.
Given the potential importance of topical cord antisepsis[19][20], we designed a community-based trial of the impact of chlorhexidine skin and cord cleansing on omphalitis and neonatal mortality in Sarlahi district, Nepal. Within this trial, we assessed the reliability and validity of sign-based definitions for cord infection in the community through use of digital images and repeated measures of intra- and inter-worker variation.
METHODS
Study Design
After obtaining informed consent, pregnant women were enrolled and followed until delivery. During home visits, the umbilical cord of newborns was examined for pus, redness, and swelling on days 1–4, 6, 8, 10, 12, 14, 21, and 28 after birth. For redness or swelling, workers indicated severity by recording ‘mild’ (limited to the cord stump only), ‘moderate’ (effecting abdominal skin at the base of the stump, < 2 cm) or ‘severe’ (redness spreading outward, > 2 cm) (Figure 1). Workers (N=61) learned to recognise potential signs of infection using images of the cord illustrating both the normal healing process and omphalitis of varying severity. Practical training under the guidance of supervisory staff members included examination of the cord of newborns in the community. Eleven more senior Area Coordinators (AC) were responsible for cord examinations during the first 7 days, while subsequent examinations were conducted by 50 Team Leader Interviewers (TLI).
Figure 1. Images of umbilical cord among infants in Sarlahi, Nepal.
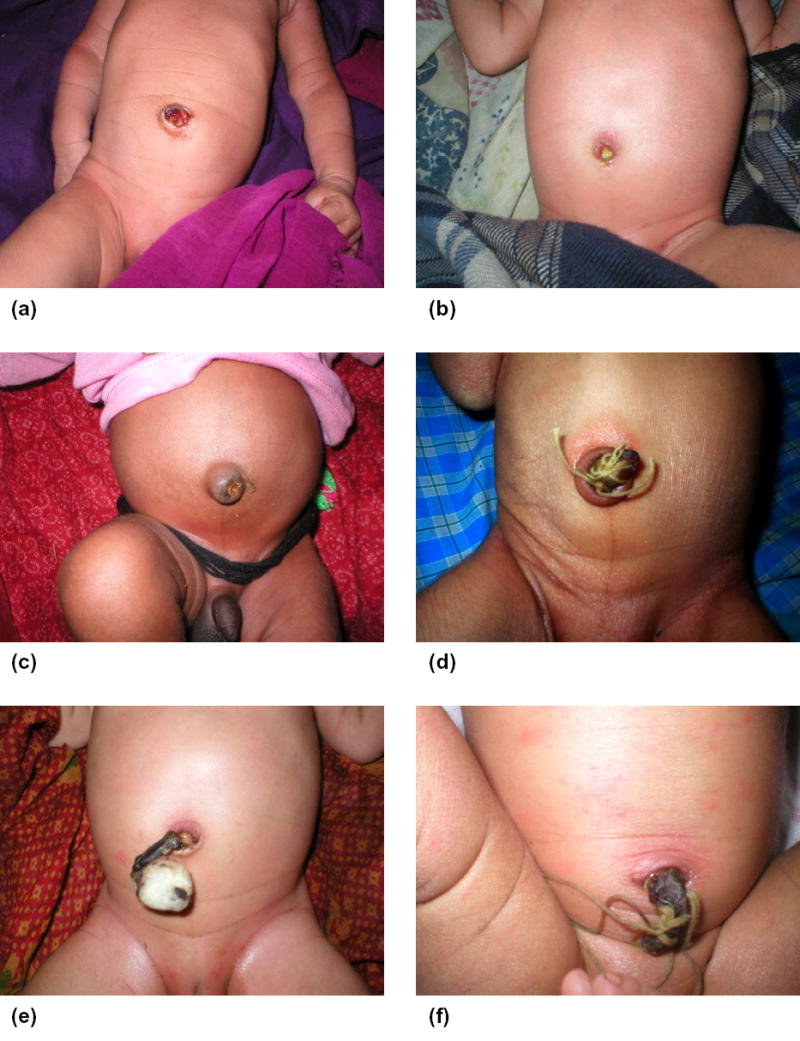
(a) mild redness, four days after birth; (b) pus, moderate redness, six days after birth; (c) moderate swelling, four days after birth; (d) severe redness, three days after birth; (e) moderate redness, three days after birth; (f) pus, severe redness, moderate swelling, three days after birth.
Between February 2003 and January 2004, workers used digital cameras (Olympus D-380, Olympus America Inc, Melville, NY, USA) during regular home visits to record a sample of umbilical cord images across the neonatal period. Among over 4500 images, 50 were selected to create a standard set for testing reliability and validity of cord assessments within a one hour testing period. To avoid over-estimation of agreement through guessing, and to allow comparison of multiple potential definitions of infection, the set was overpopulated with positive images. In three training sessions, conducted approximately three months apart, all workers assessed this standard set for signs of infection.
Statistical Analysis
Individual signs and a priori-determined combinations of signs (algorithms) were assessed for reliability and validity (Table 1) using kappa (κ) and percent agreement, the overall proportion of matching observations. Multiple-observer kappa and percent agreement were estimated according to extensions described previously.[21][22] Sensitivity, specificity, and positive/negative predictive values were estimated via comparison with gold standard rankings by a board-certified pediatric dermatologist (GLD). The internal consistency of the gold standard rankings was estimated via a second assessment of the rankings by GLD, while validity of the gold standard was estimated by obtaining an assessment by an independent pediatric dermatologist. Analyses were conducted using Stata 8.0 (Stata Corp., College Station, TX, USA).
Table 1.
Composition of the standard set of photographs (N=50) by clinical signs and algorithms
| Number | Sign/Algorithm | Total Positive Photos (%) |
|---|---|---|
| 01 | Pus | 22 (44) |
| 02 | Redness: | |
| - Exact (none, mild, moderate, severe) | † | |
| - Binary (moderate or severe vs. none or mild)* | 19 (38) | |
| 03 | Swelling: | |
| - Exact (none, mild, moderate, severe) | ‡ | |
| - Binary (moderate or severe vs. none or mild)* | 23 (46) | |
| 04 | Redness OR Swelling (moderate or severe) | 25 (50) |
| 05 | Redness AND Swelling (moderate or severe) | 17 (34) |
| 06 | Pus AND (Redness or Swelling (moderate or severe)) | 13 (26) |
| 07 | Pus AND Redness (moderate or severe) | 7 (14) |
| 08 | Pus AND (Redness AND Swelling (Any degree)) | 21 (22) |
| 09 | Pus AND (Redness AND Swelling (moderate or severe)) | 7 (14) |
| 10 | (Pus and moderate Redness) OR (severe Redness) | 9 (18) |
| Negative: no pus, no moderate/severe redness/swelling | 16 (32) |
Ratings of none or mild, and moderate or severe were combined into single values (0 and 1 respectively)
Number of photos by category of redness: none:14; mild:17; moderate:15; severe:4
Number of photos by category of swelling: none:6; mild:21; moderate:22; severe:1
Ethical Approval
The Nepal Health Research Council (Kathmandu, Nepal) and the Committee on Human Research of the Johns Hopkins Bloomberg School of Public Health (Baltimore, USA) approved the protocol.
RESULTS
The number and proportion of photographs in the standard set meeting the defined criteria for each sign or algorithm, according to gold standard rankings are shown in Table 1.
After calculating the intra-observer agreement for each worker, the proportion of workers with kappa >0.4 and the median level of percent agreement across all workers was estimated (Table 2). Pus was most consistently recognised by workers and redness showed significantly higher levels of agreement than swelling. Algorithms with broad definitions (#4, #8), and those not requiring swelling (#6, #7, #10) were scored more consistently than those requiring a distinction between swelling severity grades (#5, #9). Median percent agreement was moderate to high for all signs (>60%) and algorithms (>75%).
Table 2.
Intra-observer reliability: Proportion of workers (N=61) with kappa (κ) >0.4 by sign or algorithm
| Sign/Algorithm | κ > 0.4 (Proportion) | Median Percent Agreement |
|---|---|---|
| 01-Pus | 96.7 | 88.0 |
| 02-Redness | ||
| - Exact | 50.8 | 62.7 |
| - Binary* | 55.7 | 81.3 |
| 03-Swelling | ||
| - Exact | 36.1 | 68.0 |
| - Binary* | 8.2 | 89.0 |
| Alg-04 | 52.5 | 78.7 |
| Alg-05 | 08.2 | 94.7 |
| Alg-06 | 41.0 | 86.7 |
| Alg-07 | 36.1 | 90.7 |
| Alg-08 | 50.8 | 84.9 |
| Alg-09 | 18.0 | 97.3 |
| Alg-10 | 41.0 | 88.0 |
Ratings of none or mild, and moderate or severe were combined into single values (0 and 1 respectively).
Alg 04: Redness or swelling (moderate or severe)
Alg 05: Redness and swelling (moderate or severe)
Alg 06: Pus and (redness or swelling (moderate or severe))
Alg 07: Pus and redness (moderate or severe)
Alg 08: Pus and (redness and swelling (any degree))
Alg 09: Pus and (redness and swelling (moderate or severe))
Alg 10: (Pus and moderate redness) or (severe redness)
Inter-worker agreement by training session is shown in Table 3. Inter-observer agreement trended higher across later assessment sessions. Agreement in pus evaluations during the third training session [percent agreement (88.7); kappa statistic (0.77)] was substantial. As with intra-observer agreement, redness was more reliable across workers than swelling. Algorithms #5 and #9 were the least reliably assessed algorithms, largely a result of requiring observers to distinguish between grades of swelling.
Table 3.
Inter-observer reliability: Kappa (κ) and percent agreement for signs and algorithms, by training session
| Training 1 (n=61) | Training 2 (n=60) | Training 3 (n=60) | ||||
|---|---|---|---|---|---|---|
| Sign/Algorithm | (κ) | Percent Agreement | (κ) | Percent Agreement | (κ) | Percent Agreement |
| 01-Pus | 0.63 | 82.5 | 0.75 | 87.7 | 0.77 | 88.7 |
| 02-Redness | ||||||
| - Exact | 0.23 | 51.5 | 0.35 | 56.5 | 0.35 | 56.1 |
| - Binary* | 0.26 | 78.3 | 0.44 | 80.1 | 0.48 | 80.9 |
| 03-Swelling | ||||||
| - Exact | 0.17 | 53.1 | 0.23 | 56.4 | 0.21 | 56.6 |
| - Binary* | 0.10 | 82.8 | 0.12 | 86.2 | 0.13 | 87.8 |
| Alg-04 | 0.22 | 72.7 | 0.40 | 76.9 | 0.45 | 78.1 |
| Alg-05 | 0.05 | 89.2 | 0.06 | 90.2 | 0.11 | 92.3 |
| Alg-06 | 0.20 | 83.2 | 0.31 | 84.6 | 0.36 | 86.4 |
| Alg-07 | 0.19 | 87.4 | 0.32 | 87.6 | 0.39 | 89.4 |
| Alg-08 | 0.26 | 78.4 | 0.34 | 78.2 | 0.35 | 78.8 |
| Alg-09 | 0.05 | 93.3 | 0.05 | 95.5 | 0.06 | 93.2 |
| Alg-10 | 0.18 | 85.1 | 0.32 | 84.6 | 0.35 | 85.5 |
Ratings of none or mild, and moderate or severe were combined into single values (0 and 1 respectively).
Alg 04: Redness or swelling (moderate or severe)
Alg 05: Redness and swelling (moderate or severe)
Alg 06: Pus and (redness or swelling (moderate or severe))
Alg 07: Pus and redness (moderate or severe)
Alg 08: Pus and (redness and swelling (any degree))
Alg 09: Pus and (redness and swelling (moderate or severe))
Alg 10: (Pus and moderate redness) or (severe redness)
For the final training session, sensitivity, specificity and predictive values for pus, dichotomised rankings of redness and swelling, and each of the infection algorithms compared with the gold standard rankings are shown in Table 4.
Table 4.
Sensitivity/specificity analysis by sign or algorithm for third training session (compared to the gold standard rankings)
| Sign/Algorithm | Sensitivity (95% CI) | Specificity (95% CI) | Positive Predictive Value (95% CI) | Negative Predictive Value (95% CI) |
|---|---|---|---|---|
| 01-Pus | 0.90 (0.88, 0.93) | 0.96 (0.94, 0.98) | 0.95 (0.93, 0.97) | 0.93 (0.91, 0.95) |
| 02-Redness (Binary)* | 0.57 (0.52, 0.62) | 0.95 (0.93, 0.97) | 0.89 (0.85, 0.92) | 0.78 (0.76, 0.80) |
| 03-Swelling (Binary)* | 0.12 (0.10, 0.15) | 0.96 (0.95, 0.98) | 0.72 (0.66, 0.78) | 0.56 (0.55, 0.56) |
| Alg-04 | 0.50 (0.45, 0.54) | 0.94 (0.93, 0.96) | 0.90 (0.88, 0.93) | 0.65 (0.63, 0.67) |
| Alg-05 | 0.08 (0.06, 0.11) | 0.97 (0.96, 0.99) | 0.57 (0.49, 0.66) | 0.67 (0.65, 0.69) |
| Alg-06 | 0.36 (0.32, 0.41) | 0.96 (0.95, 0.98) | 0.80 (0.75, 0.85) | 0.81 (0.80, 0.82) |
| Alg-07 | 0.48 (0.43, 0.54) | 0.97 (0.95, 0.98) | 0.73 (0.67, 0.80) | 0.92 (0.91, 0.93) |
| Alg-08 | 0.44 (0.38, 0.50) | 0.97 (0.96, 0.98) | 0.91 (0.88, 0.94) | 0.71 (0.69, 0.73) |
| Alg-09 | 0.07 (0.04, 0.10) | 0.98 (0.97, 0.99) | 0.29 (0.24, 0.34) | 0.86 (0.85, 0.87) |
| Alg-10 | 0.47 (0.42, 0.52) | 0.95 (0.93, 0.96) | 0.69 (0.64, 0.75) | 0.89 (0.88, 0.90) |
Ratings of none or mild, and moderate or severe were combined into single values (0 and 1 respectively).
Alg 04: Redness or swelling (moderate or severe)
Alg 05: Redness and swelling (moderate or severe)
Alg 06: Pus and (redness or swelling (moderate or severe))
Alg 07: Pus and redness (moderate or severe)
Alg 08: Pus and (redness and swelling (any degree))
Alg 09: Pus and (redness and swelling (moderate or severe))
Alg 10: (Pus and moderate redness) or (severe redness)
When workers were required to distinguish between moderate/severe and none/mild levels of swelling, sensitivity was reduced. Specificity was high (>94%) for all algorithms. More experienced workers (ACs) had higher specificity and significant increases in positive predictive value (Table 5).
Table 5.
Comparison of validity measures by worker level† (AC vs TLI)
| Sensitivity | Specificity | Positive Predictive Value | Negative Predictive Value | |||||
|---|---|---|---|---|---|---|---|---|
| Sign/Algorithm | AC | TLI | AC | TLI | AC | TLI | AC | TLI |
| 01-Pus | 0.94 | 0.90 | 0.99 | 0.95 | 0.98 | 0.94 | 0.96 | 0.92 |
| 02-Redness (Binary)* | 0.57 | 0.56 | 0.99 | 0.94 | 0.97 | 0.86 | 0.79 | 0.78 |
| 03-Swelling (Binary)* | 0.09 | 0.13 | 0.99 | 0.96 | 0.92 | 0.71 | 0.56 | 0.56 |
| Alg-04 | 0.47 | 0.50 | 0.99 | 0.93 | 0.97 | 0.89 | 0.65 | 0.65 |
| Alg-05 | 0.09 | 0.08 | 1.00 | 0.97 | 0.94 | 0.58 | 0.68 | 0.67 |
| Alg-06 | 0.86 | 0.73 | 0.99 | 0.96 | 0.99 | 0.94 | 0.90 | 0.82 |
| Alg-07 | 0.48 | 0.48 | 0.99 | 0.96 | 0.90 | 0.66 | 0.92 | 0.92 |
| Alg-08 | 0.66 | 0.39 | 0.98 | 0.96 | 0.96 | 0.89 | 0.80 | 0.69 |
| Alg-09 | 0.04 | 0.07 | 1.00 | 0.98 | 0.75 | 0.36 | 0.86 | 0.87 |
| Alg-10 | 0.53 | 0.46 | 0.98 | 0.94 | 0.84 | 0.63 | 0.90 | 0.89 |
Ratings of none or mild, and moderate or severe were combined into single values (0 and 1 respectively)
Area coordinators (AC) were responsible for cord examinations during the first six days of life, while Team Leader Interviewers (TLI) conducted subsequent examinations
Alg 04: Redness or swelling (moderate or severe)
Alg 05: Redness and swelling (moderate or severe)
Alg 06: Pus and (redness or swelling (moderate or severe))
Alg 07: Pus and redness (moderate or severe)
Alg 08: Pus and (redness and swelling (any degree))
Alg 09: Pus and (redness and swelling (moderate or severe))
Alg 10: (Pus and moderate redness) or (severe redness)
Repeat rankings by the gold standard observer were highly reliable. Exact classification of swelling was the least consistent of all individual signs and algorithms (kappa=0.77), but still in the moderate to excellent range (data not shown). Variation between the two expert observers is shown in Table 6.
Table 6.
Percent agreement and kappa statistics for expert rankings by sign or algorithm
| Sign/Algorithm | Percent Agreement | Kappa |
|---|---|---|
| 01-Pus | 87.8 | 0.75 |
| 02-Redness | ||
| Exact | 68.0 | 0.55 |
| Binary* | 85.7 | 0.70 |
| 03-Swelling | ||
| Exact | 28.0 | 0.09 |
| Binary* | 69.4 | 0.25 |
| Alg-04 | 83.7 | 0.67 |
| Alg-05 | 71.4 | 0.20 |
| Alg-06 | 91.8 | 0.75 |
| Alg-07 | 91.8 | 0.70 |
| Alg-08 | 85.7 | 0.68 |
| Alg-09 | 83.7 | 0.27 |
| Alg-10 | 85.7 | 0.61 |
Ratings of none or mild, and moderate or severe were combined into single values (0 and 1 respectively).
Alg 04: Redness or swelling (moderate or severe)
Alg 05: Redness and swelling (moderate or severe)
Alg 06: Pus and (redness or swelling (moderate or severe))
Alg 07: Pus and redness (moderate or severe)
Alg 08: Pus and (redness and swelling (any degree))
Alg 09: Pus and (redness and swelling (moderate or severe))
Alg 10: (Pus and moderate redness) or (severe redness)
As with intra- and inter-observer reliability, agreement between the expert observers was high for pus and redness, while swelling was generally classified with poor consistency (kappa range: 0.09–0.25). For composite algorithms, the range of agreement ranged considerably, from excellent (#6, #7) or substantial (#4, #8, #10) to poor for those requiring a distinction between severe and non-severe swelling (#5, #9).
DISCUSSION
Reliability
Workers consistently evaluated the presence or absence of pus and intra-observer kappa statistics for redness were moderate or greater for more than half the workers. Swelling was inconsistently recognized, yet there was high median percent agreement. As workers seldom graded swelling in the moderate/severe category, the marginal distribution was highly skewed and each discordant assessment was heavily penalised when calculating kappa.
Levels of agreement were similar to previously documented estimates of intra-specialist variation in assessments of digital images for skin conditions.[14][15][16] Intra-observer variation among highly trained specialists in other fields has also been considerable when the diagnosis was subjective[23][24]; less variation has been seen for more objective outcomes such as respiratory/heart rate or body temperature.[25][26][27]
The improvement across training sessions is unlikely to be biased by recall of previous assessments as the number of images was large (n=50), the period between assessments long (3 months), and images were reviewed in random order. As observed elsewhere,[15] [24] inter-observer agreement was consistently less than intra-observer agreement, and comparable to those noted previously for classification of skin conditions.[14][15] [28][29]
Validity
Worker assessments were highly sensitive and specific for pus and severe redness, while swelling was rarely identified. While specificity remained high for all individual signs (> 0.95), sensitivity varied considerably across the proposed algorithms, and was lowest when the more subjective distinction between grades of swelling was required. Similarly, more easily identified signs (tachypnea) used in Integrated Management of Childhood Illness were more sensitive than subjective signs (chest indrawing, palmar pallor). [30][31][32][33][34][35]
Limitations
The tedious assessment exercises (approximately 45 minutes) may have led to decreased concentration and underestimates of reliability, as suggested elsewhere.[36][37] Prior investigators have stressed the importance of experience among observers.[9] [26] [30] In our study the large number of workers, range of ability, and varied levels of prior experience likely increased discordance, as evidenced by the reduced validity among the lesser experienced cadre (TLI). The two-dimensional images limited the ability of both workers and expert readers to evaluate the inherently three-dimensional character of swelling. Thus, our agreement indicators for swelling may underestimate the value of this sign in defining omphalitis.
CONCLUSION
We recommend two specific algorithms. The first (#2, binary) requires redness at the moderate or severe level, while a second recommended algorithm (#10) requires severe redness, or pus with moderate redness. Both definitions are highly specific; the former may be more useful in settings or programs where a higher number of false-positives can be tolerated, while the latter will be more useful in situations where the focus is on severe cases. Research is required to further develop and validate these algorithms in other populations, such as in Africa, where assessment of omphalitis prevalence and impact of treatment will depend on sign-based diagnosis.
Acknowledgments
This study was supported by grants from the National Institutes of Health, National Institute of Child Health and Human Development (HD44004 and HD38753), The Bill & Melinda Gates Foundation (810-2054) and cooperative agreements between the Johns Hopkins Bloomberg School of Public Health and the Office of Heath and Nutrition, United States Agency for International Development (HRN-A-00-97-00015-00, GHS-A-00-03-000019-00). The funding sources played no role in the study design, collection, data analysis, writing of the report, or decision to submit the paper for publication. Dr. Buddy Cohen, Department of Dermatology, Johns Hopkins University, provided the alternative rankings of the 50 photographs in the standard set. The corresponding author (LCM) had full access to all the data in the study and takes responsibility for the integrity of the data and the accuracy of the data analysis.
Footnotes
COMPETING INTERESTS: None
References
- 1.World Health Organization. Care of the umbilical cord. WHO/FHE/MSM-cord care. Geneva: WHO, 1998.
- 2.Pezzati M, Biagioli EC, Martelli E, et al. Umbilical cord care: the effect of eight different cord-care regimens on cord separation time and other outcomes. Biol Neonate. 2002;81:38–44. doi: 10.1159/000047182. [DOI] [PubMed] [Google Scholar]
- 3.Janssen PA, Selwood BL, Dobson SR, et al. To dye or not to dye: a randomized, clinical trial of a triple dye/alcohol regime versus dry cord care. Pediatrics. 2003;111:15–20. doi: 10.1542/peds.111.1.15. [DOI] [PubMed] [Google Scholar]
- 4.Ford LA, Ritchie JA. Maternal perceptions of newborn umbilical cord treatments and healing. J Obstet Gynecol Neonatal Nurs. 1999;28:501–6. doi: 10.1111/j.1552-6909.1999.tb02023.x. [DOI] [PubMed] [Google Scholar]
- 5.Güvenç H, Güvenç M, Yenioglu H, et al. Neonatal omphalitis is still common in eastern Turkey. Scand J Infect Dis. 1991;23:613–16. doi: 10.3109/00365549109105186. [DOI] [PubMed] [Google Scholar]
- 6.Airede A. Pathogens in neonatal omphalitis. J Trop Pediatr. 1992;38:129–31. doi: 10.1093/tropej/38.3.129. [DOI] [PubMed] [Google Scholar]
- 7.Faridi MMA, Rattan A, Ahmad SH. Omphalitis Neonatorum. J Ind Med Assoc. 1993;91:283–5. [PubMed] [Google Scholar]
- 8.Sawardekar KP. Changing spectrum of neonatal omphalitis. Pediatr Infect Dis J. 2004;23:22–6. doi: 10.1097/01.inf.0000105200.18110.1e. [DOI] [PubMed] [Google Scholar]
- 9.Oliveira MR, Wen CL, Neto CF, et al. Web site for training nonmedical health-care workers to identify potentially malignant skin lesions and for teledermatology. Telemed J E Health. 2002;8:323–32. doi: 10.1089/15305620260353216. [DOI] [PubMed] [Google Scholar]
- 10.Papier A, Peres MR, Bobrow M, et al. The digital imaging system and dermatology. Int J Dermatol. 2000;39:561–75. doi: 10.1046/j.1365-4362.2000.00033.x. [DOI] [PubMed] [Google Scholar]
- 11.Mann T, Colven R. A picture is worth more than a thousand words: enhancement of a pre-exam telephone consultation in dermatology with digital images. Acad Med. 2002;77:742–3. doi: 10.1097/00001888-200207000-00030. [DOI] [PubMed] [Google Scholar]
- 12.Cyr PR. Family practice center-based training in skin disorders: a photographic approach. Fam Med. 1995;27:109–11. [PubMed] [Google Scholar]
- 13.Fawcett RS, Widmaier EJ, Cavanaugh SH. Digital technology enhances dermatology teaching in a family medicine residency. Fam Med. 2004;36:89–91. [PubMed] [Google Scholar]
- 14.Griffiths CEM, Wang TS, Hamilton TA, et al. A photonumeric scale for the assessment of cutaneous photodamage. Arch Dermatol. 1992;128:347–51. [PubMed] [Google Scholar]
- 15.Lund CH, Osborne JW. Validity and reliability of the neonatal skin condition score. J Obstet Gynecol Neonatal Nurs. 2004;33:320–27. doi: 10.1177/0884217504265174. [DOI] [PubMed] [Google Scholar]
- 16.Perednia DA, Gaines JA, Rossum AC. Variability in physician assessment of lesions in cutaneous images and its implications for skin screening and computer-assisted diagnosis. Arch Dermatol. 1992;128:357–64. [PubMed] [Google Scholar]
- 17.Whited JD, Hall RP, Simel DL, Horner RD. Primary care clinicians’ performance for detecting actinic keratoses and skin cancer. Arch Intern Med. 1997;157:985–90. [PubMed] [Google Scholar]
- 18.Whited JD, Hall RP, Simel DL, et al. Reliability and accuracy of dermatologists’ clinic-based and digital image consultations. J Am Acad Dermatol. 1999;41:693–702. doi: 10.1016/s0190-9622(99)70003-4. [DOI] [PubMed] [Google Scholar]
- 19.Zupan J, Garner P, Omari AAA. Topical umbilical cord care at birth (Cochrane Review). In: The Cochrane Library, Issue 3, 2004. Chichester, UK: John Wiley & Sons, Ltd. [DOI] [PMC free article] [PubMed]
- 20.Mullany LC, Darmstadt GL, Tielsch JM. Role of antimicrobial applications to the umbilical cord in neonates to prevent bacterial colonization and infection: a review of the evidence. Pediatr Infect Dis J. 2003;22:996–1002. doi: 10.1097/01.inf.0000095429.97172.48. [DOI] [PMC free article] [PubMed] [Google Scholar]
- 21.Fleiss JL. Measuring nominal scale agreement among many raters. Psychol Bull. 1971;76:378–82. [Google Scholar]
- 22.Landis JR, Koch GG. A one-way components of variance model for categorical data. Biometrics. 1977;33:671–9. [Google Scholar]
- 23.Nicholson AG, Addis BJ, Bharucha H, et al. Inter-observer variation between pathologists in diffuse parenchymal lung disease. Thorax. 2004;59:500–5. doi: 10.1136/thx.2003.011734. [DOI] [PMC free article] [PubMed] [Google Scholar]
- 24.Fine PE, Job CK, Lucas SB, et al. Extent, origin, and implications of observer variation in the histopathological diagnosis of suspected leprosy. Int J Lepr Other Mycobact Dis. 1993;61:270–82. [PubMed] [Google Scholar]
- 25.Lim WS, Carty SM, Macfarlane JT, et al. Respiratory rate measurement in adults--how reliable is it? Respir Med. 2002;96:31–3. doi: 10.1053/rmed.2001.1203. [DOI] [PubMed] [Google Scholar]
- 26.Edmonds ZV, Mower WR, Lovato LM, et al. The reliability of vital sign measurements. Ann Emerg Med. 2002;39:233–7. doi: 10.1067/mem.2002.122017. [DOI] [PubMed] [Google Scholar]
- 27.Singhi S, Bhalla AK, Bhandari A, et al. Counting respiratory rate in infants under 2 months: comparison between observation and auscultation. Ann Trop Paediatr. 2003;23:135–8. doi: 10.1179/027249303235002206. [DOI] [PubMed] [Google Scholar]
- 28.Taylor P. An assessment of the potential effect of a teledermatology system. J Telemed Telecare. 2000;6 (Suppl 1):S74–6. doi: 10.1258/1357633001934221. [DOI] [PubMed] [Google Scholar]
- 29.Whited JD, Horner RD, Hall RP, et al. The influence of history on interobserver agreement for diagnosing actinic keratoses and malignant skin lesions. J Am Acad Dermatol. 1995;33:603–7. doi: 10.1016/0190-9622(95)91278-9. [DOI] [PubMed] [Google Scholar]
- 30.Kahigwa E, Schellenberg D, Schellenberg JA, et al. Inter-observer variation in the assessment of clinical signs in sick Tanzanian children. Trans R Soc Trop Med Hyg. 2002;96:162–6. doi: 10.1016/s0035-9203(02)90290-7. [DOI] [PubMed] [Google Scholar]
- 31.Perkins BA, Zucker JR, Otieno J, et al. Evaluation of an algorithm for integrated management of childhood illness in an area of Kenya with high malaria transmission. Bull World Health Organ. 1997;75 (Suppl 1):33–42. [PMC free article] [PubMed] [Google Scholar]
- 32.Weber MW, Mulholland EK, Jaffar S, et al. Evaluation of an algorithm for the integrated management of childhood illness in an area with seasonal malaria in the Gambia. Bull World Health Organ. 1997;75 (Suppl 1):25–32. [PMC free article] [PubMed] [Google Scholar]
- 33.Kolstad PR, Burnham G, Kalter HD, et al. The integrated management of childhood illness in western Uganda. Bull World Health Organ. 1997;75 (Suppl 1):77–85. [PMC free article] [PubMed] [Google Scholar]
- 34.Horwood C, Liebeschuetz S, Blaauw D, et al. Diagnosis of paediatric HIV infection in a primary health care setting with a clinical algorithm. Bull World Health Organ. 2003;81:858–66. [PMC free article] [PubMed] [Google Scholar]
- 35.Simoes EA, Desta T, Tessema T, et al. Performance of health workers after training in integrated management of childhood illness in Gondar, Ethiopia. Bull World Health Organ. 1997;75 (Suppl 1):43–53. [PMC free article] [PubMed] [Google Scholar]
- 36.Taylor P, Goldsmith P, Murray K, et al. Evaluating a telemedicine system to assist in the management of dermatology referrals. Br J Dermatol. 2001;144:328–33. doi: 10.1046/j.1365-2133.2001.04023.x. [DOI] [PubMed] [Google Scholar]
- 37.Eedy DJ, Wootton R. Teledermatology: a review. Br J Dermatol. 2001;144:696–707. doi: 10.1046/j.1365-2133.2001.04124.x. [DOI] [PubMed] [Google Scholar]