

Summary
In mammals, extended period of fasting leads to the accumulation of blood ketone bodies including acetoacetate. Similar to the conversion of leucine to acetoacetate in fasting mammals, starvation conditions induced ketone body-like acetic acid generation from leucine in S. cerevisiae. Whereas wild type and ras2Δ cells accumulated acetic acid, long-lived tor1Δ and sch9Δ mutants rapidly depleted it through a mitochondrial acetate CoA-transferase-dependent mechanism, which was essential for lifespan extension. The sch9 Δ dependent utilization of acetic acid also required coenzyme Q biosynthetic genes and promoted the accumulation of intracellular trehalose. These results indicate that Tor-Sch9-deficiency extends longevity by switching cells to an alternative metabolic mode, in which acetic acid can be utilized for the storage of stress resistance carbon sources. These effects are reminiscent of those described for ketone bodies in fasting mammals and raise the possibility that the lifespan extension caused by Tor-S6K inhibition may also involve analogous metabolic changes in higher eukaryotes.
Keywords: chronological life span, acetic acid, Sch9, aging, leucine
Introduction
The mechanisms underlying the aging process in mammals remain poorly understood. The budding yeast Saccharomyces cerevisiae has served as a primary workhorse to study the mechanisms of aging. For instance, yeast has been responsible for the identification of two of the major pro-aging pathways: the Tor/S6K and the Ras/cAMP/PKA (Fabrizio et al., 2001; Kaeberlein et al., 2005; Longo et al., 1996; McCormick et al., 2011; Medvedik et al., 2007; Pedruzzi et al., 2000; Pedruzzi et al., 2003; Steffen et al., 2009). S. cerevisiae has also provided some of the initial links between pro-aging pathways and age-dependent genomic instability (Madia et al., 2009; McMurray and Gottschling, 2004).
The yeast chronological lifespan (CLS), a measure of the chronological survival of a post-mitotic population of cells, and the replicative lifespan (RLS), a measure of the replicative potential of an individual mother cell, have been the two major methods to assess yeast aging (Kaeberlein and Kennedy, 2005; Longo et al., 2012). Deficiency mutations in either Tor or Sch9, yeast orthologs of mammalian mTOR and S6K respectively, and in the Ras/cAMP/PKA pathway extend both the CLS and RLS (Fabrizio et al., 2001; Laplante and Sabatini, 2012; Pan and Shadel, 2009) in part by activating stress resistance serine threonine kinase Rim15 and its down-stream transcription factors Msn2/4 and Gis1 (Pedruzzi et al., 2000; Wei et al., 2008). Because the Tor/Sch9 pathway is known to be activated primarily by amino acids while the Ras/cAMP/PKA pathway is turned on in large part by glucose and considering the key role of Rim15, Msn2/4 and Gis1 in the lifespan extension caused by calorie restriction (CR), these pathways represent the central pro-growth and pro-aging signaling network activated by nutrients (Longo and Finch, 2003; Wei et al., 2008). In fact, yeast cells are nonviable if they lack both Ras1 and Ras2 or Tor1 and Tor2 (Barbet et al., 1996; Toda et al., 1985).
It has been demonstrated that dietary restriction extends the lifespan in a variety of organisms. In yeast, high level of glucose or ethanol shortens CLS (Fabrizio et al., 2005; Wei et al., 2008; Wei et al., 2009). Since high level of acetic acid promotes apoptosis in yeast, others have proposed that acetic acid and not ethanol is the primary factor promoting culture acidification, chronological aging, and apoptotic death (Burtner et al., 2009; Madeo et al., 2004). It has also been proposed that calorie CR increases chronological survival by reducing extracellular acetic acid and that the longevity of sch9Δ and ras2Δ mutants are due to reduced acetic acid production during the proliferative phase (sch9Δ) and acetic acid resistance after nutrient exhaustion (sch9Δ and ras2Δ) (Burtner et al., 2009). We propose that, at physiological levels, acetic acid promotes aging simply by activating pro-aging pathways in yeast, analogously to glucose and ethanol.
In this study, we investigated the role of acetic acid in chronological aging and examined its source and impact on the lifespan of wild type and long-lived S. cerevisiae.
Results
Yeast mutants deficient in the Ras/cAMP/PKA and Tor/Sch9 pathways exhibit different patterns of ethanol and acetic acid accumulation during chronological aging
To establish the relationship between carbon source metabolites and CLS, we measured the levels of ethanol and acetic acid in chronologically aged yeast cultures (Figure 1). Wild type cells accumulated acetate during chronological aging, whereas the deletion of either TOR1 or SCH9 resulted in depletion of extracellular acetate after a small peak on day 3 (Figure 1A). These data indicate that the Tor1-Sch9 pathway blocks the utilization of acetate. By contrast, mutations in RAS2 or CYR1, the central components of the other yeast pro-aging pathway with orthologs that promote aging in mice (Ferbeyre et al., 2002; Yan et al., 2007), accumulated similar or even higher levels of acetate compared to the wild type strain (Figure 1A). These results suggest that during the early stages of lifespan as extracellular glucose and other nutrients become depleted, the absence of Tor/Sch9 signaling promotes a metabolic change that utilizes acetic acid, analogous to the generation and use of the ketone bodies, acetoacetic acid and β-hydroxybutyrate, by mammalian cells during fasting (Cahill, 2006; Hawkins et al., 1986).
Figure1. Quantification of extracellular acetate and ethanol during chronological aging.
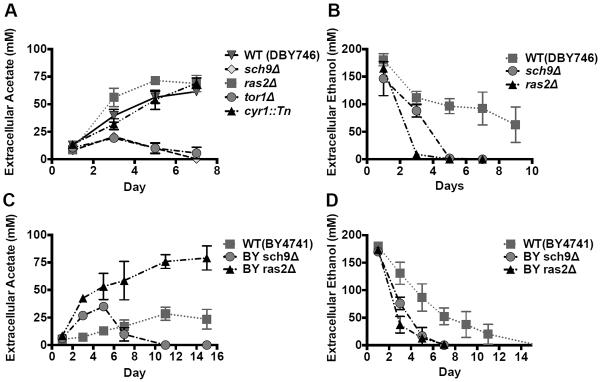
Extracellular acetate (A) and ethanol (B) concentrations of wild type, sch9Δ, ras2Δ, tor1Δ and cyr1::Tn mutants in DBY746 background on days 1, 3, 5 and 7. Data are presented as mean ± SEM (n=3–7). Extracellular acetate (C) and ethanol (D) concentrations of wild type, sch9Δ, ras2Δ mutants in BY4741 background (n=3–6).
CR is well known to extend longevity in a wide range of organisms, including yeast (Anderson and Weindruch, 2010; Kennedy et al., 2007). As we had previously shown (Fabrizio et al., 2005), the ethanol content remained relatively high in wild-type cultures until day 9, while it dropped by day 3 in sch9Δ and ras2Δ mutants (Figure 1B). These data rule out the possibility that wild type cells die from carbon source starvation. Thus, the removal of ethanol may partially contribute to the life span extension effects of Sch9 or Ras2 deficiency. To test whether these effects of Tor/Sch9 and Ras/cAMP/PKA on extracellular carbon sources are common characteristics of yeast cells, we also measured ethanol and acetate production in the BY4741 strains, one of the most widely studied yeast genetic background, and obtained similar results (Figure 1C, D). However, early carbon source depletion may only explain part of the lifespan extension in specific long-lived mutants, since acetic acid remained at very high levels in ras2Δ cultures (Figure 1A, C).
Ethanol, acetate and acidification promote aging by reducing the activity of stress response transcription factors
To better understand how carbon sources affects CLS, we switched day 3 cells to MES buffer containing glucose, ethanol or acetic acid (Figure 2). As shown in Figure 1, the average extracellular acetate concentration between day 3 and day 7, the period during which over 50% of the cells died, was approximately 50mM. The pH of the buffer was adjusted to that reached by wild type cells in the standard CLS assay (pH 3.7). The standard 2% glucose concentration or a 100mM acetic acid concentration (twice the physiological levels) caused the highest mortality in agreement with previous reports (Burtner et al., 2009; Granot and Snyder, 1991; Ludovico et al., 2001). By contrast, a physiological concentration of ethanol (0.8%) or of acetic acid (50mM) using the standard low aeration protocol (Longo et al., 2012) did not shortened lifespan to the same level as 2% glucose or 100mM acetic acid (Figure 2A). This observation suggests that at physiological levels, acetic acid affects chronological aging at a level similar to that of ethanol, but lower than that of glucose (Wei et al., 2009). To examine whether the carbon source influences stress resistance, we challenged cells with heat shock and oxidative stress (H2O2 treatment for 30min) after switching them to various carbon sources for 24 hours. At physiological concentrations, all the carbon sources sensitized yeast cells only to oxidative stress (Figure 2B).
Figure 2. Effect of carbon sources on chronological aging and stress response.

(A) Chronological survival of wild type (DBY746) cells in different media. Day 3 cells were washed and transferred to MES buffer in the presence of different carbon sources at the indicated concentrations. All media were adjusted to the same pH of the control (buffer only). (B) Stress resistance assay of wild type strain (DBY746) 24 hours after the switch to various buffers. Cells were heated for 100 min at 55°C or treated with 70mM H2O2 for 30min. A representative experiment was shown. (C, D) LacZ reporter assay. Wild-type cells with chromosomally integrated STRE- or PDS-lacZ reporter genes were switched to buffer containing different carbon sources after three days of growth in standard SDC medium. The STRE-lacZ (C) and PDS-lacZ (D) activities were measured 8 h and 24 h after the switch. Data shown are mean ± SEM (n=3–4). (E, F) Wild type (DBY746) cells were transferred to 40mM MES buffer (pH 6, pH 4) supplemented with ethanol (0.8%) or acetic acid (50mM) after two days of growth in SDC medium. The STRE-lacZ (E) and PDS-lacZ (F) activities were measured 4, 8 and 24 h after the switch (n=3). Star denotes p<0.05, double stars denote p<0.01. (G, H) Wild type cells were grown in SDC medium under the standard condition with limited aeration (aluminum caps) or high aeration condition (loose plastic caps). Extracellular acetate and ethanol concentrations were measured every other day.
Gis1 and Msn2/4 are stress responses transcription factors required for lifespan extension of Tor/Sch9 or Ras/cAMP/PKA deficient cells. To further understand how the carbon sources affect the stress response, we employed STRE- and PDS-driven LacZ reporter gene assay to monitor Msn2/4 and Gis1 transactivation, respectively (Figure 2C, D). High concentration of acetic acid (100mM) completely repressed the STRE- and PDS-dependent transactivation, while its physiological concentrations, up to 50mM, reduced the activation of these transcription factors (Figure 2C, D). This effect could explain the cytotoxicity of super-physiological levels of acetic acid. Cells in glucose medium showed significant reduction in PDS-driven gene expression in agreement with the stress resistance results (Figure 2B, D). Based on these results we conclude that physiological concentration of either acetic acid or ethanol in combination with media acidification similarly affects cellular protection and survival.
To determine the relative contribution of acidification to cellular survival and stress sensitization, we monitored the effect of pH on the activity of the Msn2/4 and Gis1 stress resistance transcription factors (Figure 2E, F). Similar to the experiment above, we switched cells to MES buffer (pH 6.0 or 4.0) supplemented with either physiological level of ethanol (0.8%) or acetate (50mM). Mild acidification (pH 4.0) did not significantly alter PDS- or STRE-dependent transactivation. In the presence of acetic acid, the increase in pH from 4 to 6 elevated STRE- and PDS-dependent lacZ activity (Figure 2E, F). This observation may explain why buffering the acidic media to pH 6 extends longevity (Burtner et al., 2009; Fabrizio et al., 2005; Kaeberlein, 2010). By contrast, a pH increase promoted PDS- but not STRE-dependent lacZ activity in ethanol medium (Figure 2E, F). We also buffered the spent medium collected from day 3 wild type cultures to pH 6.0 and found that PDS-LacZ but not STRE-LacZ activity was elevated and reached an almost two-fold increase compared to cells in the unbuffered medium by 48 hours (Figure S1A, B). These results suggest that Gis1 transactivation via the PDS elements, which are mostly negatively regulated by the Tor/Sch9 signaling pathway (Wei et al., 2008), may be responsible for part of the effects of medium acidification and ethanol or acetic acid on stress resistance and CLS.
In order to reconcile these data and the proposal by others that acetic acid is a toxic molecule that causes acute cytotoxicity (Kaeberlein, 2010; Longo et al., 2012), we investigated whether differences in technical procedures may be responsible for the different results. Using loose-fitting plastic caps that allow high aeration instead of the aluminum foil caps that limit aeration used in our method, Burtner and colleagues (2009) showed that ethanol was depleted rapidly and acetic acid accumulates in aging yeast cultures. We performed our viability assay using both methods. The evaporation rate was much higher in plastic cap covered flasks as the volume decreased by 50–70% by day 11 compared to a 15% decrease in flasks with aluminum foil caps (data not shown). The higher aeration also caused early depletion of ethanol and caused the levels of acetic acid to reach a concentration close to 100mM (Figure 2G, H). The pH of wild type cultures was maintained between 3.5 and 3.8 throughout the lifespan using both methods (Figure S1C). These results indicate that the methodology used by Burtner et al caused early depletion of ethanol and increased the levels of acetic acid to a toxic range, in contrast to our method in which ethanol remains the major carbon source and the concentration of acetic acid reached between days 3 and 7 is approximately 50–60mM. This demonstrates that CLS, similar to aging assays in other organisms, is dependent on environmental conditions.
Mutations that reduce acetic acid levels do not affect longevity or acidification
To further investigate the role of acetic acid in S. cerevisiae chronological aging, we compared the survival of isogenic yeast strains carrying mutations in genes involved in acetic acid metabolism (Figure 3A). ADY2 encodes an acetate transporter and its disruption has been reported to affect acetic acid cellular uptake (Paiva et al., 2004). PDC6 encodes an isoform of the pyruvate decarboxylase, which decarboxylates pyruvate to acetaldehyde. Deletion of PDC6 is expected to affect production of acetaldehyde from pyruvate, and, in turn, reduce acetate production (Pronk et al., 1996). ACS1 is an acetyl-coA synthetase, whose deficiency can affect acetate production (De Virgilio et al., 1992). Although mutants lacking Ady2, Pdc6 or Acs1 caused major reductions in the levels of acetic acid (Figure 3C), none of them displayed increased CLS or variation in ethanol concentration or pH (Figure 3B, F, S1D), suggesting that the levels of extracellular acetic acid using the standard CLS method used in our laboratory do not play a major role in either CLS lifespan or medium acidification. We confirmed our results in the BY4741 mutants lacking ALD6, a member of the acetaldehyde dehydrogenase (ACDH) family that catalyzes conversion of acetaldehyde into acetic acid (Figure 3A). Although little acetate was detectable in ald6Δ culture during chronological aging (Figure 3E), the chronological lifespan and medium pH did not differ significantly from those of the wild type cells (Figure 3D, G). However, we cannot rule out that these mutants may have common defects, other than those related to acetic acid accumulation, which prevent lifespan extension. Furthermore, it is possible that aeration condition may influence the role of these genes and pathways on acidification.
Figure 3. Genetic mutations affect acetic acid levels, CLS, and pH.

(A) The glucose metabolism pathway leading to ethanol and acetate generation. Chronological survival (B) and extracellular acetic acid concentration (C) of wild type (DBY746), ady2Δ, pdc6Δ and acs1Δ mutants (B, n=5–9; C, n=3–7).Chronological survival (D) and extracellular acetic acid concentration (E) of wild type (BY4741) and ald6Δ mutants (n=3). The pH of conditioned media during chronological aging of DBY746 (F) BY4741 (G) wild type cells and their derivatives.
Acetic acid is a ketone body-like metabolite generated in part from leucine metabolism
In mammalian cells, ketone bodies, including acetone, acetoacetic acid, and β-hydroxybutyric acid are generated from fatty acids and ketogenic amino acids catabolism. We hypothesized that acetic acid is a ketone body-like metabolite that serves as an energy source during periods of glucose depletion. We tested if leucine could affect acetic acid levels. The commonly used laboratory yeast strains contain mutations in amino acid biosynthetic genes (see experimental procedures). Standard growth medium is supplemented with excess 4X amino acids (leucine, histidine and uracil, in both backgrounds and tryptophan only for DBY746) to compensate for these genetic deficiencies (Fabrizio et al., 2001). When we reduced the excess amino acids or only leucine to 1X, the extracellular acetate concentration was markedly reduced while ethanol levels were not affected (Figure 4A, C). Notably, cell density of the 1X leucine culture reached only 25–30% of that reached by growth in 4X leucine (standard medium) but the acetic acid production remained greatly reduced when the effects were normalized per cell number (Figure S2A, B). Moreover, we evaluated CLS of DBY746 wild type cells in 1X leucine media and observed that life span was reduced when compared to same cells grown in standard media (Figure S4A). Similar results were obtained with the BY4741 genetic background (Figure 4B, D). Furthermore, the major difference in acetic acid production did not cause significant differences in culture pH indicating that acetic acid is not a major factor in medium acidification (Figure 4E, F). An increase in leucine levels could promote acetate production in the BY4741 (Figure S2C) but not in the DBY746 wild type strain, whose extracellular acetate levels were already high (data not shown).
Figure 4. Branched chain amino acid leucine affects acetic acid generation.

Wild type cells (DBY746 and BY4741) growing in SDC medium supplemented with 4X (4X 4AA) or 1X HIS, URA, LEU, TRP (1X 4AA) or 1X LEU with 4XHIS, URA, TRP (4X 3AA 1X LEU). (A, B) Extracellular acetate concentration. (C, D)Extracellular ethanol concentration (n=3–5). (E, F) pH of the cultures during chronological aging. (G) Leucine catabolism pathways in yeast and mammals. (H) Extracellular acetate concentration in cultures of wild type cells and of mutants lacking BAT1 and BAT2 genes (n=6); * p<0.05, paired t test, bat1Δ bat2Δ compared to WT.
Bat1 and Bat2 are the mitochondria and cytosolic branched-chain amino acid (BCAA) aminotransferases (Figure 4G) based on the proposed leucine metabolism pathway (Dickinson, 2000). Deletion of either of these two genes had little effect on acetate accumulation, but the double knockout mutants showed reduced extracellular acetate levels during early chronological aging (Figure 4H). However, chronological survival of the bat1Δ bat2Δ double mutants in the standard SDC did not differ significantly from those of wild type cells in same media (Figure S4B). This observation is possibly due to utilization of an alternative pathway in the bat1Δ bat2Δ double mutants. These data suggest that acetate production shares similarities to that of ketone bodies generation by leucine in mammals.
To examine whether prototrophy and auxotrophy may affect the survival of the long-lived mutants, we re-introduced the LEU2 gene in the tor1Δ and sch9Δ strains utilized in this study. As shown in Supplemental Figure S2D, both tor1Δ and sch9Δ mutants exhibit a longer life span in comparison to wild type, with sch9Δ presenting a more pronounced extended CLS than tor1Δ.
The acetate utilization by the sch9Δ mutant is dependent on Ach1
The pro-longevity effect of Tor-S6K inhibition, demonstrated in yeast, worms, flies and mice, is one of the most promising pharmacological interventions with the potential to extend healthy lifespan in humans (Fabrizio et al., 2001; Hansen et al., 2007; Harrison et al., 2009; Katewa and Kapahi, 2011; Pan and Shadel, 2009). To investigate the effect of Tor/Sch9 deficiency on acetic acid utilization we studied the role of Ach1, a mitochondrial CoA transferase that catalyzes the CoA-SH transfer from succinyl-CoA to acetate with minor acetyl-CoA-hydrolase activity (Figure 3A) (Fleck and Brock, 2009). The ACH1 deletion mutants and wild type cells displayed a similar mean lifespan, although the maximum lifespan of ach1Δ was shorter (Figure 5A). The sch9Δ ach1Δ double mutations caused a reversal of the longevity effect of sch9Δ and led to a significant increase in ethanol and acetate accumulation compared to sch9Δ mutants (Figure 5A–C). The acetate in the sch9Δ ach1Δ culture reached a concentration of over 100mM (Figure 2A). These results indicate that the activation of acetic acid utilization in cells deficient in Tor/Sch9 activity depends on ACH1, whose activity is required for lifespan extension in sch9Δ.
Figure 5. Ach1 and electron transport activity is important for acetic acid utilization.

(A) Chronological survival of wild type, ach1Δ, sch9Δ and sch9Δach1Δ mutants (n=7). (B, C) Extracellular acetic acid and ethanol concentration during chronological aging (n=4). (D) O2 consumption of wild type (DBY746) and sch9Δ mutants during chronological aging. Data are presented as mean ± SE (n=8–9). (E, F) WT (DBY746) and sch9Δ mutants were grown in SDC and switched to the carbon source mix medium (40mM MES buffer, pH 3.7: with 50mM acetic acid and 141mM ethanol). The medium was changed on day 3 and replaced every other day. Chronological survival and O2 consumption were monitored for the entire CLS study. Data are presented as mean ± SEM (n=7). (G) WT and deletion mutants were switched to 40mM MES buffer (pH 3.7) containing 25mM acetic acid. Acetate utilization was monitored.
Levels of non-fermentable carbon sources match respiration pattern in sch9Δ mutants
Down-regulation of the Tor1-Sch9 signaling pathway has been shown to induce an early increase of respiration rates (Bonawitz et al., 2007; Pan et al., 2011; Wei et al., 2009) as well as an early depletion in ethanol and acetic acid during chronological aging (Figure 1A, B). We hypothesized that inhibition of Tor/Sch9 signaling increases respiration by promoting the catabolism of ethanol and acetic acid. Oxygen consumption measurements revealed that Sch9 deficiency induced a high rate of respiration at early stages of survival, but low respiratory rates by day 7 (Figure 5D). In the BY4741 genetic background, deletion of SCH9 exerted a similar but delayed effect on O2 consumption (Figure S3C). These metabolic changes matched the pattern of ethanol and acetic acid depletion during chronological aging. However, sch9Δ mutants remained long-lived when ethanol and acetic acid were replenished every other day at physiological levels (141mM and 50mM, respectively) during the CLS (Figure 5E). The sch9Δ mutants maintained a high metabolism (Figure 5F), indicating that the effects of Tor/Sch9 deficiency on CLS are not simply due to entry into a low metabolism state. To examine the effect of each carbon source on respiration, we switched wild type and sch9Δ cells to MES buffer containing 0.8% (174mM) ethanol or 50mM acetic acid on day 3 and measured oxygen consumption 3 and 24 hours after the switch (Figure S3A, B). Whereas ethanol promoted cellular respiration, acetic acid, which was also rapidly depleted by sch9Δ mutants, did not support high respiration even at points in which its levels were high and it was still detectable 24 hours after the switch (data not shown, Figure S3A, B). Therefore, deficiencies in the Tor/Sch9 pathways activate an alternative metabolic mode that promotes rapid catabolism of ethanol, which induces high respiratory rates and a rapid catabolism of acetic acid.
To understand how long-lived mutants utilize acetic acid, we treated wild type and sch9Δ mutant cells with NaCN (0.25mM), a respiration inhibitor, on day 1 or day 3. Treatment of sch9Δ mutants with NaCN every other day until day 7, delayed the utilization of acetic acid (Figure S3D). We also employed mutants with impaired respiratory function. Coq genes catalyze ubiquinone (coenzyme Q) biosynthesis, which serves to transport electrons between the respiratory enzyme complex I, II and III in the mitochondrial inner membrane. Deletion of COQ2 or COQ4 genes in wild type cells and sch9Δ mutants led to impaired ethanol consumption and low acetic acid accumulation during chronological aging (Figure S3E, F). These results indicate that acetic acid catabolism in sch9Δ requires a fully functional respiratory chain, but does not necessarily result in elevated oxygen consumption in the absence of ethanol. Thus, Tor/Sch9 deficiency activates an alternative metabolic acetic acid catabolism mode that does not require high oxygen consumption.
Deletion of SCH9 promotes storage of energy reserves
To determine whether acetic acid may contribute to other cellular functions not related to energy production, we measured stored nutrients. Storage carbohydrates, mainly glycogen and trehalose, serve as energy sources during stationary phase in yeast. Mutants unable to store or utilize the storage carbohydrates have significantly shortened CLS (Favre et al., 2008). We measured the glycogen and trehalose contents of cells aging chronologically. The levels of trehalose and glycogen decreased with age and reached very low levels in wild type cells but were not depleted, even in very old organisms (Figure 6). The sch9Δ mutants stored more than 2-fold higher glycogen and trehalose levels compared to wild type cells on day 1 (Figure 6A, B). A positive correlation between carbohydrate storage and cell survival has been shown previously (Ocampo et al., 2012). Glycogen does not appear to be as important since by day 5 wild type cells and sch9Δ reached similar levels of this reserve nutrient (Figure 6B). This suggests that the high level of trehalose may contribute to cellular protection in tor1Δ and sch9Δ mutants. We then treated cells with acetic acid or ethanol to determine if these carbon sources can be used to increase the accumulation of reserve carbohydrates. Interestingly, ethanol and acetic acid had different effects on the storage of carbon reserves. In sch9Δ mutants, acetic acid increased the accumulation of trehalose while ethanol promoted its utilization. In contrast, ethanol but not acetic acid increased glycogen content (Figure 6C, D). Therefore, ethanol and acetic acid trigger different metabolic pathways leading, respectively, to respiration and glycogen or trehalose storage.
Figure 6. Acetic acid and reserve carbon sources.

(A, B) Trehalose and glycogen contents were measured during chronological aging. (C, D) The sch9Δ mutant cells were switched to MES buffer (pH 3.7) containing 25mM acetate or 0.8% ethanol on day 3. Trehalose and glycogen were measured. Measurements were normalized to cell pellet weight. (E) Trehalose was measured during chronological aging.
Since Ach1 seems to be required for the gluconeogenetic conversion of acetic acid to trehalose, we evaluated intracellular concentration of trehalose in the sch9Δ, ach1Δ double knockout cells and as predicted the levels are significantly reduced in comparison to sch9Δ mutants (Figure 6E). To further strengthen our observations we evaluated trehalose concentration in chronologically aged wild type cells that are limited in leucine, as well as bat1Δ bat2Δ double mutant cells in standard SDC. As hypothesized, wild type cells cultured in 1X leucine have a lower accumulation of trehalose than that measured in wild type cells in SDC media (Figure 6E). Evaluation of chronologically aged bat1Δ bat2Δ mutant cells indicated that the intracellular accumulation of trehalose is not significantly different from that of the wild type strain. We postulate that this could be in part due to pathway(s) that are activated in the Bat1, Bat2 deficient cells (Figure 6E).
Discussion
The effect of energy intake on lifespan is well documented in organisms ranging from bacteria to mice and other mammals. In fact, a 20–40 percent restriction in calories intake extends lifespan and reduces the incidence of a variety of diseases (Fontana et al., 2010; Wei et al., 2008). Because high levels of acetic acid have been shown to cause apoptosis in yeast (Ludovico et al., 2001) the observation that acetic acid accumulates in cultures of non-dividing yeast led to the hypothesis that acetic acid plays a key role in yeast chronological aging (Burtner et al., 2009; Kaeberlein, 2010). Here we show that under the high aeration conditions, ethanol is depleted and acetic acid accumulates reaching the toxic range associated with acute cell death, whereas under the standard aeration conditions used in our laboratory, ethanol and acetic acid represent the major carbon sources in the medium with ethanol being the major pro-aging macronutrient. We also show that, analogously to the ketone bodies in mammals, acetic acid accumulates during the early periods of glucose depletion and can be generated from leucine catabolism in yeast cultures. Whereas wild type cells and long-lived Ras pathway-deficient strains accumulate high levels of acetic acid, Tor/Sch9 deficient mutants rapidly catabolize it by an ACH1- and electron transport-dependent process that is required for lifespan extension and result in the storage of the protective reserve carbohydrate trehalose.
Relatively small differences in the methods used to measure lifespan may have pronounced effects on the rate of aging and cell death as well as the interpretation of the results (Gems and Partridge, 2012). We have shown that glucose and ethanol promoted aging and that medium acidification accelerated this process (Fabrizio et al., 2005). Furthermore, the calorie-restricted condition achieved by removing ethanol was sufficient to extend CLS (Fabrizio et al., 2005; Wei et al., 2009), analogously to the effect of reduction of glucose levels on both RLS and CLS. Burtner et al., on the contrary, proposed that it was the accumulation of acetic acid and not ethanol that limited yeast longevity and proposed that acetic acid may limit CLS not by promoting aging but by causing acute toxicity (Burtner et al., 2009; Kaeberlein, 2010). This difference, which appears to arise from the high aeration generated by experimental conditions adopted by Burtner et al, causes an early depletion of ethanol and the accumulation of levels of acetic acid associated with cytotoxicity. Thus, to identify genes and pathways that are in fact affecting aging, it is important to use multiple experimental approaches (Longo et al., 2012).
Ketone bodies are the by-products of fatty acid catabolism in the liver and serve as a major source of energy during periods of food deprivation. The level of ketone bodies, normally very low in the plasma, increase when the glycogen becomes depleted and blood glucose level is low (Cahill, 2006). In yeast, acetate is produced by glucose metabolism, converted from acetaldehyde and acetyl-CoA. Here we describe a number of parallels between yeast acetic acid and mammalian ketone bodies: 1) they are generated at high levels during periods of external glucose and glycogen depletion, 2) leucine catabolism promotes the accumulation of ketone bodies in mammals and acetate in yeast (Bixel and Hamprecht, 1995), 3) as for ketone bodies, yeast acetate can be transformed into Acetyl-CoA which enters the TCA cycle for energy generation. The leucine metabolism pathway in yeast remains elusive. One previous study of leucine catabolism in yeast did not find acetate as a byproduct, possibly because the experiments were not performed under glucose-limited conditions (Dickinson, 2000).
Sch9 and Tor1 deficiencies have been shown to extend lifespan, increase stress resistance, and promote genomic stability in S. cerevisiae (Fabrizio et al., 2001; Wei et al., 2009). Here we report that deletion of SCH9 causes acetate utilization in an ACH1 and electron transport chain-dependent manner. However, in sch9Δ mutants acetic acid did not increase respiration as ethanol did, suggesting that Tor-S6K deficiency leads to a metabolic switch in which cells are able to utilize a ketone body-like metabolite for a respiration-independent purpose. Although it is not clear whether acetic acid utilization can result in ATP generation, we show that it promotes the accumulation of the stress resistance-related reserve carbon source trehalose, probably by a mechanism that requires an intact electron transport, as indicated by others (Filipak et al., 1992). In fact, it has been shown that petite cells lacking mitochondrial DNA stopped synthesizing trehalose as soon as exogenous glucose was consumed while wild type cells continued to accumulate the disaccharide (Enjalbert et al., 2000). A recent study suggests that the respiration thresholds are crucial for the extended CLS caused by CR and that trehalose was sufficient to restore normal CLS in respiration deficient cells (Ocampo et al., 2012). Consistent with findings by others (Bonawitz et al., 2007; Pan et al., 2011), we demonstrate that down-regulation of the Tor1-Sch9 signaling pathway induces an early increase in respiration rates during CLS and show that this is accompanied by early depletion of ethanol and acetic acid (Figure 1A, B) as well as storage of trehalose (Figure 6). These findings are in agreement with the possibility that the enhanced mitochondria ROS signaling by reduced TORC1 activity during growth phase (Pan et al., 2011) may also contribute to the metabolic shift observed in sch9Δ cells. Thus, deficiency in Tor/Sch9 signaling may promote trehalose accumulation as part of a metabolic change that allows cells to catabolize acetic acid and survive under hypoxia or anoxia.
In agreement with our results, an early increase in respiration has been shown for Tor deficient mutants and has been proposed to be required for lifespan extension (Bonawitz et al., 2007; Pan et al., 2011). Here, we show that this early increase in respiration in Tor/Sch9 deficient cells is followed by a decrease in respiration after ethanol and acetic acid are largely depleted, indicating that the increased metabolism is reflecting the need to rapidly deplete extracellular carbon sources. However, carbon source depletion and the following hypometabolism may contribute to but do not explain the effects of Tor/Sch9 deficiency on lifespan, since tor1Δ and sch9Δ mutants display extended lifespan when carbon sources and respiration are maintained high and constant (Figure 5E)(Wei et al., 2008). Similar to our findings, it has been reported that CR results in a 30% higher respiration rate in the growth phase and a decrease of respiration in the post diauxic shift/stationary phase (Ocampo et al., 2012). This finding suggest that CR and reduced Tor/Sch9 signaling may regulate common genes, which first promote respiration and depletion of non fermentable carbon sources and then cause a hypometabolic mode associated with lifespan extension (Wei et al., 2009).
In summary, our study suggests that acetic acid may represent a ketone body like carbon source generated during periods of starvation and utilized by Tor/Sch9 deficient cells through an Ach1-and electron transport-dependent pathway which promotes the accumulation of the protective carbohydrate trehalose and lifespan extension.
Experimental Procedures
Yeast strains
Most of the Saccharomyces cerevisiae strains used in this study were derived from DBY746 (MATα, leu2–3, 112, his3Δ1, trp1–289, ura3–52, GAL+). Some experiments were also confirmed in the BY4741 (MATa, his3Δ1, leu2Δ0, met15Δ0, ura3Δ0) genetic background. Knockout strains were generated by one-step gene replacement (Longtine et al., 1998). The sch9Δ, cyr1∷mTn and ras2Δ mutants have been described previously (Fabrizio et al., 2001; Wei et al., 2008). Strains with STRE-lacZ reporter gene were generated by integrating into the URA3 locus the pMM2 plasmid which contains four tandem repeats of STRE motif from the HSP12 sequence (−221 to −241) fused with the LacZ coding sequence (Boy-Marcotte et al., 1998). The plasmid pCDV454 containing LacZ reporter under the control of a 37bp SSA3-PDS region (−206 to −170) (Pedruzzi et al., 2000) was integrated into the URA3 locus of wild-type cells to generate PDS-lacZ gene reporter strain. The protocol of reporter gene activity measurement has been described elsewhere (Wei et al., 2008).
Growth conditions
Yeast cells were grown in SDC containing 2% or 0.5% glucose supplemented with a 4-fold excess of tryptophan, leucine, histidine and uracil to avoid possible lifespan modification due to auxotrophic deficiencies of the strains. Standard SDC medium without excess of essential amino acids were used for comparison. Day 3 wild type cultures were centrifuged and filtered supernatants were used to perform medium switch experiments.
Chronological lifespan assay
Yeast chronological lifespan was measured as previously described (Fabrizio and Longo, 2003). Overnight SDC culture was diluted (OD 0.1) into fresh SDC medium (with 5:1 flask to culture volume) and incubated at 30°C with shaking (200rpm). 24 hours later was considered as day 1. Every 48 hours, properly diluted culture was plated onto YPD plates and then incubated at 30°C for 2–3 days. Chronological lifespan was assessed by colony-forming units (CFUs) measurement. Day 3 CFUs were considered as the initial survival (100%) and used to determine the age-dependent mortality. Mean lifespan was calculated from curve fitting of the survival data with the statistical software Prism (GraphPad Software). For medium switch experiments, cells were grown in SDC for 3 days, washed twice with sterile distilled water, and suspended in MES buffer (40mM, pH 3.7 or pH 6.0) with different carbon sources or other media as stated.
Stress resistance assay
Heat shock resistance was measured by spotting serial dilutions (5-fold or 10-fold dilution) of cells removed from cell cultures onto YPD plates and incubating at 55°C (heat-shocked) and at 30°C (control) for 60–150 min. After the heat shock, plates were transferred to 30°C and incubated for 2 days. For oxidative stress-resistance assays, cells were diluted 10 fold in K-phosphate buffer (pH 6.0) and treated with 70–300mM H2O2 for 30 min. Serial dilutions (5 fold or 10 fold) of untreated control and H2O2-treated cells were spotted onto YPD plates and incubated at 30°C for 2–3 days.
LacZ reporter gene assay
1mL culture was collected, washed once with water, pelleted and then stored at −80°C. 100μL of low-salt lysis buffer (50mM Tris, pH 7.5, 0.1% (v/v) Triton X-100, 1X protease inhibitor, 100mM NaCl, 2mM EDTA, 2mM EGTA, 50mM NaF) and an equal volume of glass beads were added to the cell pellets. The mixture was vortexed at max speed for 45s, and then chilled on ice for 45s. This was repeated 5 times. The mix was centrifuged at 14,000 rpm at 4°C for 5 min and the supernatant was transferred to a clean tube. Protein concentration of the lysate was assayed with a BCA kit (Pierce). 55μL of lysate (or appropriately diluted samples) were mixed with 85μl of substrate solution (1.1 mg/ml ONPG in Z Buffer: 60mM Na2HPO4, 40mM NaH2PO4, 10mM KCl, 1mM MgSO4, 50mM 2-mercaptoethanol, pH7.0). Absorbance at 420 nm was read every 5 min until 30 min after the reaction was started. LacZ activities were determined by fitting the A420/time data to that of serial diluted recombinant β-galactosidase (Promega) and were further normalized with total protein.
Acetic acid and ethanol measurements
Yeast chronological aging cultures were centrifuged and supernatants were collected and frozen at −80°C. Acetic acid and ethanol concentrations of the conditioned medium were determined by acetic acid and ethanol assay kits (R-biophamCat. 10148261035 and 10176290035) following the manufacturer's recommended protocol.
Oxygen consumption measurement
Oxygen consumption of 2ml culture was measured in a glass container magnetically stirred to avoid cell precipitation at 30°C in a water bath using a Clark-type electrode. According to the manufacturer, the liquid culture was assumed to contain the same amount of oxygen as water equilibrated with 21% oxygen in 1 atmosphere pressure (5.02μl/ml). Oxygen level in the culture was automatically recorded every 5 seconds until a trace of straight line was obtained which suggested that the oxygen consumption had reached a steady state. The amount of oxygen consumed was further normalized by CFU.
Quantification of Glycogen and Trehalose
2.5–3ml cell cultures were collected from indicated cultures at indicated time points. Cells were washed with water, pelleted and stored at −80°C untill measurement. The cell pellet weights were measured at the time of collection for normalization purpose. Determination of intracellular glycogen and trehalose content was performed as previously described (Parrou and Francois, 1997). Briefly, cell pellets were resuspended in 250μL of 0.25M Na2CO3 and incubated at 95°C with occasional stirring for 4hrs. Subsequently, the suspension was buffered to pH 5.2 by adding 150μL of 1 M acetic acid and 600μL of 0.2M NaAc (pH 5.2). For the trehalose content determination, half of the mixture was incubated overnight at 37°C in the presence of 3mM trehalase (Sigma, USA) under constant agitation. For the glycogen content determination, the second half was digested overnight at 57°C with continuous shaking on a rotary shaker in the presence of 100μg α-amyloglucosidase (Sigma, USA). Finally, centrifuge the mixture and collect the supernatant. Glucose released from trehalose and glycogen digestion was quantified using the Glucose Assay Kit (R-biopham, Cayman Chemical Company) following the manufacturer's protocol.
Supplementary Material
Acknowledgments
We thank C. De Virgilio and E. Boy-Marcotte for providing plasmids. We thank Nahel Kapadia, Sarah Forgy and Wendy Fu for their assistance in lifespan assays. This study was funded, in part, by NIH/NIA grants AG20642, AG025135 and AG034906 to VDL.
Reference
- Anderson RM, Weindruch R. Metabolic reprogramming, caloric restriction and aging. Trends Endocrinol Metab. 2010;21:134–141. doi: 10.1016/j.tem.2009.11.005. [DOI] [PMC free article] [PubMed] [Google Scholar]
- Barbet NC, Schneider U, Helliwell SB, Stansfield I, Tuite MF, Hall MN. TOR controls translation initiation and early G1 progression in yeast. Mol Biol Cell. 1996;7:25–42. doi: 10.1091/mbc.7.1.25. [DOI] [PMC free article] [PubMed] [Google Scholar]
- Bixel MG, Hamprecht B. Generation of ketone bodies from leucine by cultured astroglial cells. J Neurochem. 1995;65:2450–2461. doi: 10.1046/j.1471-4159.1995.65062450.x. [DOI] [PubMed] [Google Scholar]
- Bonawitz ND, Chatenay-Lapointe M, Pan Y, Shadel GS. Reduced TOR signaling extends chronological life span via increased respiration and upregulation of mitochondrial gene expression. Cell Metab. 2007;5:265–277. doi: 10.1016/j.cmet.2007.02.009. [DOI] [PMC free article] [PubMed] [Google Scholar]
- Boy-Marcotte E, Perrot M, Bussereau F, Boucherie H, Jacquet M. Msn2p and Msn4p control a large number of genes induced at the diauxic transition which are repressed by cyclic AMP in Saccharomyces cerevisiae. J Bacteriol. 1998;180:1044–1052. doi: 10.1128/jb.180.5.1044-1052.1998. [DOI] [PMC free article] [PubMed] [Google Scholar]
- Burtner CR, Murakami CJ, Kennedy BK, Kaeberlein M. A molecular mechanism of chronological aging in yeast. Cell Cycle. 2009;8:1256–1270. doi: 10.4161/cc.8.8.8287. [DOI] [PMC free article] [PubMed] [Google Scholar]
- Cahill GF., Jr. Fuel metabolism in starvation. Annu Rev Nutr. 2006;26:1–22. doi: 10.1146/annurev.nutr.26.061505.111258. [DOI] [PubMed] [Google Scholar]
- De Virgilio C, Burckert N, Barth G, Neuhaus JM, Boller T, Wiemken A. Cloning and disruption of a gene required for growth on acetate but not on ethanol: the acetyl-coenzyme A synthetase gene of Saccharomyces cerevisiae. Yeast. 1992;8:1043–1051. doi: 10.1002/yea.320081207. [DOI] [PubMed] [Google Scholar]
- Dickinson JR. Pathways of leucine and valine catabolism in yeast. Methods Enzymol. 2000;324:80–92. doi: 10.1016/s0076-6879(00)24221-3. [DOI] [PubMed] [Google Scholar]
- Enjalbert B, Parrou JL, Vincent O, Francois J. Mitochondrial respiratory mutants of Saccharomyces cerevisiae accumulate glycogen and readily mobilize it in a glucose-depleted medium. Microbiology. 2000;146(Pt 10):2685–2694. doi: 10.1099/00221287-146-10-2685. [DOI] [PubMed] [Google Scholar]
- Fabrizio P, Gattazzo C, Battistella L, Wei M, Cheng C, McGrew K, Longo VD. Sir2 blocks extreme life-span extension. Cell. 2005;123:655–667. doi: 10.1016/j.cell.2005.08.042. [DOI] [PubMed] [Google Scholar]
- Fabrizio P, Pozza F, Pletcher SD, Gendron CM, Longo VD. Regulation of longevity and stress resistance by Sch9 in yeast. Science. 2001;292:288–290. doi: 10.1126/science.1059497. [DOI] [PubMed] [Google Scholar]
- Favre C, Aguilar PS, Carrillo MC. Oxidative stress and chronological aging in glycogen-phosphorylase-deleted yeast. Free Radic Biol Med. 2008;45:1446–1456. doi: 10.1016/j.freeradbiomed.2008.08.021. [DOI] [PubMed] [Google Scholar]
- Ferbeyre G, de Stanchina E, Lin AW, Querido E, McCurrach ME, Hannon GJ, Lowe SW. Oncogenic ras and p53 cooperate to induce cellular senescence. Mol Cell Biol. 2002;22:3497–3508. doi: 10.1128/MCB.22.10.3497-3508.2002. [DOI] [PMC free article] [PubMed] [Google Scholar]
- Filipak M, Drebot MA, Ireland LS, Singer RA, Johnston GC. Mitochondrial DNA loss by yeast reentry-mutant cells conditionally unable to proliferate from stationary phase. Curr Genet. 1992;22:471–477. doi: 10.1007/BF00326412. [DOI] [PubMed] [Google Scholar]
- Fleck CB, Brock M. Re-characterisation of Saccharomyces cerevisiae Ach1p: fungal CoA-transferases are involved in acetic acid detoxification. Fungal Genet Biol. 2009;46:473–485. doi: 10.1016/j.fgb.2009.03.004. [DOI] [PubMed] [Google Scholar]
- Fontana L, Partridge L, Longo VD. Extending healthy life span-from yeast to humans. Science. 2010;328:321–326. doi: 10.1126/science.1172539. [DOI] [PMC free article] [PubMed] [Google Scholar]
- Gems D, Partridge L. Genetics of Longevity in Model Organisms: Debates and Paradigm Shifts. Annu Rev Physiol. 2012 doi: 10.1146/annurev-physiol-030212-183712. [DOI] [PubMed] [Google Scholar]
- Granot D, Snyder M. Glucose induces cAMP-independent growth-related changes in stationary-phase cells of Saccharomyces cerevisiae. Proc Natl Acad Sci U S A. 1991;88:5724–5728. doi: 10.1073/pnas.88.13.5724. [DOI] [PMC free article] [PubMed] [Google Scholar]
- Hansen M, Taubert S, Crawford D, Libina N, Lee SJ, Kenyon C. Lifespan extension by conditions that inhibit translation in Caenorhabditis elegans. Aging Cell. 2007;6:95–110. doi: 10.1111/j.1474-9726.2006.00267.x. [DOI] [PubMed] [Google Scholar]
- Harrison DE, Strong R, Sharp ZD, Nelson JF, Astle CM, Flurkey K, Nadon NL, Wilkinson JE, Frenkel K, Carter CS, et al. Rapamycin fed late in life extends lifespan in genetically heterogeneous mice. Nature. 2009;460:392–395. doi: 10.1038/nature08221. [DOI] [PMC free article] [PubMed] [Google Scholar]
- Hawkins RA, Mans AM, Davis DW. Regional ketone body utilization by rat brain in starvation and diabetes. Am J Physiol. 1986;250:E169–178. doi: 10.1152/ajpendo.1986.250.2.E169. [DOI] [PubMed] [Google Scholar]
- Kaeberlein M. Lessons on longevity from budding yeast. Nature. 2010;464:513–519. doi: 10.1038/nature08981. [DOI] [PMC free article] [PubMed] [Google Scholar]
- Kaeberlein M, Kennedy BK. Large-scale identification in yeast of conserved ageing genes. Mech Ageing Dev. 2005;126:17–21. doi: 10.1016/j.mad.2004.09.013. [DOI] [PubMed] [Google Scholar]
- Kaeberlein M, Powers RW, 3rd, Steffen KK, Westman EA, Hu D, Dang N, Kerr EO, Kirkland KT, Fields S, Kennedy BK. Regulation of yeast replicative life span by TOR and Sch9 in response to nutrients. Science. 2005;310:1193–1196. doi: 10.1126/science.1115535. [DOI] [PubMed] [Google Scholar]
- Katewa SD, Kapahi P. Role of TOR signaling in aging and related biological processes in Drosophila melanogaster. Exp Gerontol. 2011;46:382–390. doi: 10.1016/j.exger.2010.11.036. [DOI] [PMC free article] [PubMed] [Google Scholar]
- Kennedy BK, Steffen KK, Kaeberlein M. Ruminations on dietary restriction and aging. Cell Mol Life Sci. 2007;64:1323–1328. doi: 10.1007/s00018-007-6470-y. [DOI] [PMC free article] [PubMed] [Google Scholar]
- Laplante M, Sabatini DM. mTOR signaling in growth control and disease. Cell. 2012;149:274–293. doi: 10.1016/j.cell.2012.03.017. [DOI] [PMC free article] [PubMed] [Google Scholar]
- Longo VD, Finch CE. Evolutionary medicine: from dwarf model systems to healthy centenarians? Science. 2003;299:1342–1346. doi: 10.1126/science.1077991. [DOI] [PubMed] [Google Scholar]
- Longo VD, Gralla EB, Valentine JS. Superoxide dismutase activity is essential for stationary phase survival in Saccharomyces cerevisiae. Mitochondrial production of toxic oxygen species in vivo. J Biol Chem. 1996;271:12275–12280. doi: 10.1074/jbc.271.21.12275. [DOI] [PubMed] [Google Scholar]
- Longo VD, Shadel GS, Kaeberlein M, Kennedy B. Replicative and chronological aging in Saccharomyces cerevisiae. Cell Metab. 2012;16:18–31. doi: 10.1016/j.cmet.2012.06.002. [DOI] [PMC free article] [PubMed] [Google Scholar]
- Longtine MS, McKenzie A, 3rd, Demarini DJ, Shah NG, Wach A, Brachat A, Philippsen P, Pringle JR. Additional modules for versatile and economical PCR-based gene deletion and modification in Saccharomyces cerevisiae. Yeast. 1998;14:953–961. doi: 10.1002/(SICI)1097-0061(199807)14:10<953::AID-YEA293>3.0.CO;2-U. [DOI] [PubMed] [Google Scholar]
- Ludovico P, Sousa MJ, Silva MT, Leao C, Corte-Real M. Saccharomyces cerevisiae commits to a programmed cell death process in response to acetic acid. Microbiology. 2001;147:2409–2415. doi: 10.1099/00221287-147-9-2409. [DOI] [PubMed] [Google Scholar]
- Madeo F, Herker E, Wissing S, Jungwirth H, Eisenberg T, Frohlich KU. Apoptosis in yeast. Curr Opin Microbiol. 2004;7:655–660. doi: 10.1016/j.mib.2004.10.012. [DOI] [PubMed] [Google Scholar]
- Madia F, Wei M, Yuan V, Hu J, Gattazzo C, Pham P, Goodman MF, Longo VD. Oncogene homologue Sch9 promotes age-dependent mutations by a superoxide and Rev1/Polzeta-dependent mechanism. J Cell Biol. 2009;186:509–523. doi: 10.1083/jcb.200906011. [DOI] [PMC free article] [PubMed] [Google Scholar]
- McCormick MA, Tsai SY, Kennedy BK. TOR and ageing: a complex pathway for a complex process. Philos Trans R Soc Lond B Biol Sci. 2011;366:17–27. doi: 10.1098/rstb.2010.0198. [DOI] [PMC free article] [PubMed] [Google Scholar]
- McMurray MA, Gottschling DE. Aging and genetic instability in yeast. Curr Opin Microbiol. 2004;7:673–679. doi: 10.1016/j.mib.2004.10.008. [DOI] [PubMed] [Google Scholar]
- Medvedik O, Lamming DW, Kim KD, Sinclair DA. MSN2 and MSN4 link calorie restriction and TOR to sirtuin-mediated lifespan extension in Saccharomyces cerevisiae. PLoS Biol. 2007;5:e261. doi: 10.1371/journal.pbio.0050261. [DOI] [PMC free article] [PubMed] [Google Scholar]
- Ocampo A, Liu J, Schroeder EA, Shadel GS, Barrientos A. Mitochondrial respiratory thresholds regulate yeast chronological life span and its extension by caloric restriction. Cell Metab. 2012;16:55–67. doi: 10.1016/j.cmet.2012.05.013. [DOI] [PMC free article] [PubMed] [Google Scholar]
- Paiva S, Devaux F, Barbosa S, Jacq C, Casal M. Ady2p is essential for the acetate permease activity in the yeast Saccharomyces cerevisiae. Yeast. 2004;21:201–210. doi: 10.1002/yea.1056. [DOI] [PubMed] [Google Scholar]
- Pan Y, Schroeder EA, Ocampo A, Barrientos A, Shadel GS. Regulation of yeast chronological life span by TORC1 via adaptive mitochondrial ROS signaling. Cell Metab. 2011;13:668–678. doi: 10.1016/j.cmet.2011.03.018. [DOI] [PMC free article] [PubMed] [Google Scholar]
- Pan Y, Shadel GS. Extension of chronological life span by reduced TOR signaling requires down-regulation of Sch9p and involves increased mitochondrial OXPHOS complex density. Aging (Albany NY) 2009;1:131–145. doi: 10.18632/aging.100016. [DOI] [PMC free article] [PubMed] [Google Scholar]
- Parrou JL, Francois J. A simplified procedure for a rapid and reliable assay of both glycogen and trehalose in whole yeast cells. Anal Biochem. 1997;248:186–188. doi: 10.1006/abio.1997.2138. [DOI] [PubMed] [Google Scholar]
- Pedruzzi I, Burckert N, Egger P, De Virgilio C. Saccharomyces cerevisiae Ras/cAMP pathway controls post-diauxic shift element-dependent transcription through the zinc finger protein Gis1. EMBO J. 2000;19:2569–2579. doi: 10.1093/emboj/19.11.2569. [DOI] [PMC free article] [PubMed] [Google Scholar]
- Pedruzzi I, Dubouloz F, Cameroni E, Wanke V, Roosen J, Winderickx J, De Virgilio C. TOR and PKA signaling pathways converge on the protein kinase Rim15 to control entry into G0. Mol Cell. 2003;12:1607–1613. doi: 10.1016/s1097-2765(03)00485-4. [DOI] [PubMed] [Google Scholar]
- Pronk JT, Yde Steensma H, Van Dijken JP. Pyruvate metabolism in Saccharomyces cerevisiae. Yeast. 1996;12:1607–1633. doi: 10.1002/(sici)1097-0061(199612)12:16<1607::aid-yea70>3.0.co;2-4. [DOI] [PubMed] [Google Scholar]
- Steffen KK, Kennedy BK, Kaeberlein M. Measuring replicative life span in the budding yeast. J Vis Exp. 2009 doi: 10.3791/1209. [DOI] [PMC free article] [PubMed] [Google Scholar]
- Toda T, Uno I, Ishikawa T, Powers S, Kataoka T, Broek D, Cameron S, Broach J, Matsumoto K, Wigler M. In yeast, RAS proteins are controlling elements of adenylate cyclase. Cell. 1985;40:27–36. doi: 10.1016/0092-8674(85)90305-8. [DOI] [PubMed] [Google Scholar]
- Wei M, Fabrizio P, Hu J, Ge H, Cheng C, Li L, Longo VD. Life span extension by calorie restriction depends on Rim15 and transcription factors downstream of Ras/PKA, Tor, and Sch9. Plos Genet. 2008;4:e13. doi: 10.1371/journal.pgen.0040013. [DOI] [PMC free article] [PubMed] [Google Scholar]
- Wei M, Fabrizio P, Madia F, Hu J, Ge HY, Li LM, Longo VD. Tor1/Sch9-Regulated Carbon Source Substitution Is as Effective as Calorie Restriction in Life Span Extension. Plos Genet. 2009;5 doi: 10.1371/journal.pgen.1000467. [DOI] [PMC free article] [PubMed] [Google Scholar]
- Yan L, Vatner DE, O'Connor JP, Ivessa A, Ge H, Chen W, Hirotani S, Ishikawa Y, Sadoshima J, Vatner SF. Type 5 adenylyl cyclase disruption increases longevity and protects against stress. Cell. 2007;130:247–258. doi: 10.1016/j.cell.2007.05.038. [DOI] [PubMed] [Google Scholar]
Associated Data
This section collects any data citations, data availability statements, or supplementary materials included in this article.