Abstract
We studied the impact of administering XPro1595, a novel antagonist of soluble tumor necrosis factor-α (TNFα), on the regulation of hepatic cytochrome P450 enzymes in the C. rodentium model of infectious colitis. XPro1595 was administered subcutaneously every three days throughout the infection, or as a single injection near the peak of infection. When given throughout the infection, XPro1595 selectively blocked the down-regulation of Cyp3a11 and 3a25 mRNAs, as well as the induction of Cyp2a4/5, without affecting the down-regulation of Cyp4a10, Cyp4a14, Cyp2b10 or flavin-mooxygenase-3. Induction of Cyp3a11, Cyp3a25, Cyp2c29 and Cyp3a13 mRNAs were observed only in XPro1595-treated mice. Administration of a single dose of XPro1595 was relatively ineffective. These results a) confirm the role of soluble TNFα in hepatic Cyp3a regulation during infectious colitis deduced from studies in TNFα receptor-1 knockout mice; b) indicate the potential for soluble TNFα-specific antagonists to cause disease-dependent drug-drug interactions; and, c) suggest a novel mechanism by which an anti-inflammatory therapeutic protein can produce an opposite effect to that of the disease by selectively neutralizing one of multiple signals regulating drug-metabolizing enzyme expression. More research is needed to determine whether or not this is applicable to other diseases or disease models.
Keywords: Drug Metabolism, Cytochrome P450, Biologics, Therapeutic Proteins, Drug-Drug Interactions, Inflammation
INTRODUCTION
Infections and inflammation cause changes in the activity and expression of many drug-metabolizing enzymes including members of the cytochrome P450 (P450) superfamily (Aitken et al., 2006). In most cases this results in reduced drug clearance and increased exposure to drugs that are substrates for these enzymes. Cytokines such as interleukin (IL)-6, interferon (IFN)α or γ, and tumor necrosis factor (TNF)α are thought to mediate the effects of inflammation on P450 regulation. While it has been shown that such cytokines can regulate P450 expression in hepatocyte cultures (Abdel-Razzak et al., 1993; Chen et al., 1995; Tapner et al., 1996; Aitken and Morgan, 2007; Dickmann et al., 2012) and in vivo (Renton et al., 1984; Ghezzi et al., 1986a; Ghezzi et al., 1986b; Morgan et al., 1994) the roles of individual cytokines on regulation of drug metabolism in different diseases are not well understood.
The need to understand which cytokines are involved in P450 regulation in vivo is sharpened by the recently-discovered phenomenon of disease-dependent drug-drug interactions (DDDI), in which therapeutic proteins (biologic drugs) targeted towards cytokines or their receptors can affect the metabolism of small molecule drugs by reversing the down-regulation of P450 enzymes caused by the inflammatory disease, as reviewed in (Morgan, 2009). This was first demonstrated by the attenuation of Cyp3a down-regulation in mice by a polyclonal antibody to IL-6 in a genetic model of arthritis (Ashino et al., 2007). Cyp3a down-regulation in a different, pre-adjuvant model of arthritis was inhibited by the anti-TNFα biologic infliximab (Ling and Jamali, 2009). Subsequently, the anti-IL-6 receptor antibody tocilizumab was shown to increase clearance of the CYP3A substrate simvastatin in humans with rheumatoid arthritis (Schmitt et al., 2011). A recent white paper on the subject illustrates both the clinical and regulatory concerns for DDDIs and the need for more information on cytokine regulation of P450s during inflammatory disease (Evers et al., 2013).
In addition to the study using infliximab described above, four other studies have directly tested the in vivo role of TNFα in P450 regulation in a disease model. The down-regulations of Cyp1a, 2b, 3a and 4a following bacterial lipopolysaccharide (LPS) injection were not attenuated in mice deficient in both TNFα receptor-1 (TNFR1) and TNFR2, (Warren et al., 1999), whereas the responses of Cyp2d and Cyp2e1 enzymes were attenuated. In agreement with this finding, Cyp3a11 and 2c29 down-regulations by LPS were unaffected in TNFα-null mice (Ashino et al., 2004) (Miyoshi et al., 2005). In contrast, down-regulation of Cyp3a11 and Cyp2c29 by injection of tuberculosis vaccine was somewhat attenuated in TNFα-deficient animals (Ashino et al., 2004). Previous studies by our laboratory (Kinloch et al., 2011) have demonstrated that TNFα is an important factor in selectively regulating the expression of P450s of the Cyp3a subfamily in Citrobacter rodentium-induced colitis. C. rodentium is a non-invasive rodent pathogen equivalent to human enteropathogenic Escherichia coli, a serotype of E. coli that causes colitis in humans (Higgins et al., 1999). The colitis caused by the bacteria is characteristic of inflammatory bowel disease (Higgins et al., 1999). Cyp3a11 and Cyp3a25 were significantly down-regulated in C. rodentium-infected C57BL/6 mice, while the down regulation was inhibited in TNFR1 knockout mice (Kinloch et al., 2011). Hepatocyte experiments found that TNFα was the most potent and efficacious cytokine tested in the down-regulation of Cyp3a enzymes and other P450s in mouse hepatocyte cultures (Nyagode et al., 2010; Kinloch et al., 2011). Together, these results suggest a role for TNFα in the regulation of Cyp3a enzymes in vivo, which is dependent on the specific disease or disease model.
However, the lack of Cyp3a down-regulation observed in TNFα- or TNFR-null mice could be due to adaptive changes in the mouse due to the long-term absence of the cytokine or its receptors TNFR1, rather than to blockade of TNFα effects. This possibility can be addressed using a pharmacological approach to block TNFα action in wild type mice. The biologic drugs currently in clinical use do not discriminate between soluble or membrane-bound forms of TNFα, which signal through different receptors (Holtmann and Neurath, 2004). We therefore conducted a study using a biologic drug that selectively neutralizes soluble TNFα to eliminate the potential influence of these adaptive changes. We used XPro1595, a dominant-negative form of TNFα (Y87H, A145R) that forms hetero-trimers with native soluble TNFα to give complexes that neither bind to nor stimulate signaling through TNFα receptors (Steed et al., 2003; Zalevsky et al., 2007). This experiment was designed to test XPro1595’s ability to block or reverse the effects of C. rodentium infection on hepatic cytochrome P450 enzymes, with a focus on the Cyp3a subfamily. The results confirmed the role of TNFα in Cyp3a down-regulation in C. rodentium infection, and demonstrated the potential of a dominant-negative biologic to produce disease-dependent interactions with small molecule drugs via Cyp3a regulation.
MATERIALS AND METHODS
Bacteria
C. rodentium wild-type strain (51116) was received from the American Type Culture Collection (Manassas, VA), and grown overnight in Luria broth at 37°C without shaking. Bacterial growth was monitored by spectrometry at 600 nm and the optical density was used to calculate a nominal bacterial dose of 2.5 ×10⁸ cfu (colony forming units) per mouse, assuming intake of 8 ml/day/mouse. Actual concentrations of bacteria were determined by retrospective plating on MacConkey agar. After bacterial administration, the remaining drinking water volume was recorded to allow calculation of the actual bacterial dose.
Chemicals, animals and treatments
All reagents and chemicals were obtained from Sigma-Aldrich (St Louis, MO) unless otherwise specified. Thirty-six female C57BL/6J mice were obtained from Jackson Laboratory (Bar Harbor, ME), of which 18 were controls and 18 were experimentally infected. The mice were housed in 6 separate groups of 6 to a cage and acclimatized to the animal facility for 1 week before the beginning of the experiment. The mice were 9 weeks of age when injections started.
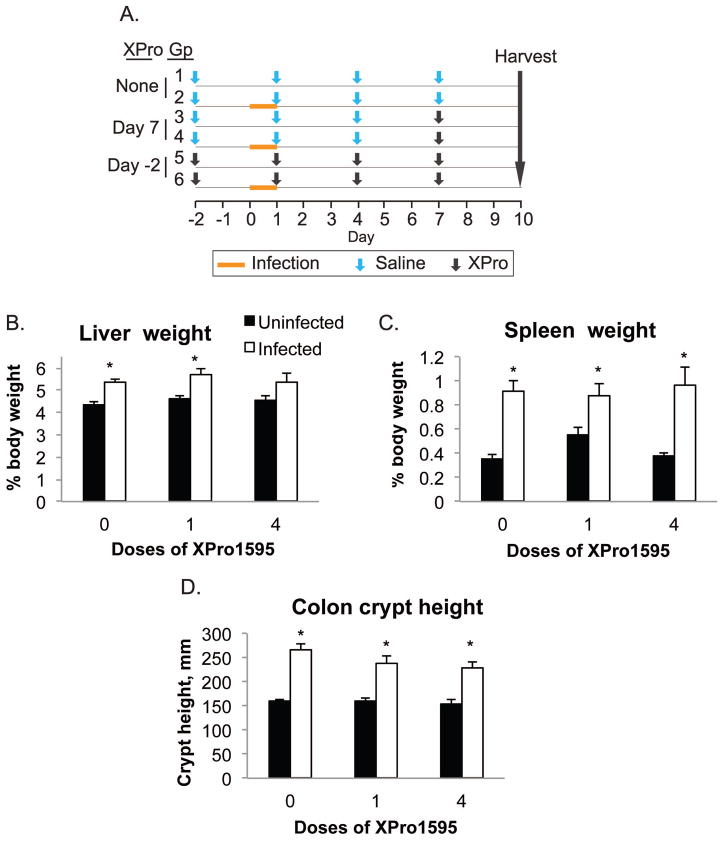
A diagrammatic view of the treatment protocol is presented in Fig 1A. Infection started on day 0 when groups 2, 4 and 6 were orally administered C. rodentium in their drinking water (containing 20% sucrose) for 24 h at a nominal dose of 2.5 × 10⁸ cfu per mouse drinking 8 ml/day. Control animals received 20% sucrose in water without bacteria during the same time period. Infected mice were housed in a biosafety level 2 facility to prevent transmission. Food was withheld during the 24 h infection period. TNFα antagonist XPro1595 (Xencor Inc., Monrovia CA) was injected subcutaneously at a dose of 10mg/kg in saline. Groups 1 and 2 (No XPro1595) received saline injections on days −2, 1, 4, and 7. Groups 3 and 4 (1 XPro1595 dose) were injected with saline on days −2, 1, and 4, and received a single injection of XPro1595 on day 7, three days prior to sacrifice. Groups 5 and 6 (4 XPro1595 doses) received injections on days −2, 1, 4, and 7. This experimental design is depicted graphically in Fig. 1A. Animals were sacrificed by decapitation under isoflurane anesthesia on day 10. The Institutional Animal Care and Use Committee of Emory University approved all animal procedures.
Fig. 1.
Experimental design, organ weights and colon crypt heights. Animals were treated as described in Materials and Methods, and euthanized 10 days after infection. A, Schematic representation of the experimental design. B, Liver weights. C, Spleen weights. D. Colon crypt heights. Values are the mean tissue weight after normalization to body weight ± S.E.M (n=6). *, significantly different from uninfected animals in same XPro1595 treatment group, P<0.05, Student’s t test (or U-test if variances were not equivalent).
Tissue collection
Livers were collected and rinsed in cold 1.15% potassium chloride. They were then weighed, portioned, flash-frozen in liquid nitrogen and stored at −80°C for later RNA preparation. Blood was collected after decapitation and allowed to clot. Serum was separated by centrifugation for 10 min at 7500 × g and stored at −80°C for later analysis. Spleen was collected and rinsed in 1.15% potassium chloride and weight was recorded. Colon was removed and washed of fecal matter with cold 1.15% potassium chloride. The distal quarter of the colon was dissected and kept on ice for later detection of viable bacteria. The next most distal portion was used for histological analysis.
Determination of tissue bacterial loads
Liver and colon samples were weighed and homogenized (Ultra Turrax T25, IKA Wilmington, NC) in 1 ml of phosphate buffered saline. The colon homogenates were diluted 104- or 105-fold and 50 μl was plated onto separate MacConkey agar plates. Liver homogenates (100 μl) and blood (50 μl) were plated directly. The plates were incubated for 16 h at 37°C and colonies were counted.
Colon crypt length measurement
Distal colon sections were fixed in 10% formalin and embedded in paraffin. Five μm sections were cut and stained with hematoxylin and eosin. The heights of three well-oriented crypts were measured in the distal colon for each mouse, using a Zeiss 200M microscope (Thornwood, NY) with a 20X NA1.4 lens, and Slidebook (Intelligent Imaging Innovations, Denver CO). The measurements were made in a blinded fashion
RNA extraction, cDNA synthesis and real-time PCR
Total liver RNA was prepared using RNA-Bee isolation reagent (Tel-Test Inc., Friendswood TX), as directed by the manufacturer. The extracted RNA was analyzed on an agarose gel in order to determine RNA purity and integrity following visualization with ethidium bromide. RNA concentration was determined spectrophotometrically by measuring absorbance at 260nm.
Relative expression of liver mRNAs was measured using reverse transcriptase - real time PCR (RT-qPCR). Purified total RNA was reverse-transcribed with a SuperScript First-Strand Synthesis System Kit (Invitrogen/Life technologies, Carlsbad, CA) according to the manufacturer’s protocol. Primers (Supplemental Table 1) were custom-synthesized by MWG Biotech, Inc. (High Point, NC) or Operon Biotechnologies Inc. (Huntsville, AL). Real-time PCR was performed using Power SYBR Green Master Mix reagent (Applied Biosystems/Life Technologies, Carlsbad, CA) and an Applied Biosystems PRISM 7000 sequence detection system. Duplicate reactions were performed using a total volume of 25 μl with Power SYBR Green Master Mix reagent (Applied Biosystems) along with forward and reverse primers of choice. The thermal cycling program included 2 min at 50°C, 10 min at 95°C, followed by 40 cycles of 95°C for 15 s, and 1 min at the primer’s own annealing temperature. Results were expressed as relative levels of target mRNA. The housekeeping gene GAPDH was used to normalize the expressed mRNA levels by the ΔΔCt method (Livak and Schmittgen, 2001), after verifying that GAPDH levels were not affected under the experimental conditions. The expression levels in the uninfected, untreated controls were arbitrarily set at 1.
Microsomal Preparation and Western Blotting
All procedures were done at 4°C. Livers were homogenized in 4 volumes of Tris acetate buffer, pH 7.4 containing 1 mM EDTA and 0.1 M KCl. Homogenates were centrifuged at 7500 × g for 25min, and the supernatant was then centrifuged for 35 min at 250,000 × g. The microsomal pellet was re-suspended in 10 mM Tris acetate buffer, pH 7.4, containing 0.1 mM EDTA and 23% glycerol, and the final microsomal solution was stored at −80°C. Protein concentrations were determined with a bicinchoninic acid protein assay kit (Thermo Fisher Scientific, Waltham, MA) with bovine serum albumin as the protein standard.
Western blotting was used to measure relative levels of P450 protein levels in mouse hepatic microsomes as described previously (Chaluvadi et al., 2009; Kinloch et al., 2011). Antibodies to rat CYP3A and to NADPH-cytochrome P450 reductase (Cpr) were generously provided by Dr. James Halpert (University of California, San Diego) and Dr. Bettie Sue Masters (University of Texas, San Antonio). Antibody to CYP4A (ab140635) was purchased from Abcam (Cambridge, MA). All antibodies above were diluted 1:5000 for detection, and the assays were performed within a linear range of protein loaded. Proteins were detected using a SuperSignal West Pico chemiluminescent substrate kit (Thermo Fisher Scientific) where the bands were visualized by fluorography on X-ray film and then digitized. The bands were quantified by densitometry using Kodak Molecular Imaging software (Eastman Kodak Co., Rochester, NY).
Cytokine Analysis
Serum samples were subjected to multiplexed immunoassays by the Emory Multiplexed Immunoassay Core (EMIC), using a mouse pro-inflammatory 7-PLEX kit (Meso-Scale, Rockville, MD) and the Discovery Sector 2400 instrument (Meso-Scale). Samples were analyzed for cytokines IFNγ, TNFα, chemokine (C-X-C motif) ligand 1 (CXCL1, mKC), IL1, IL6, IL10 and IL12.
Statistical analysis
One-way ANOVA was used to determine if significant differences existed among infected groups in tissue bacterial colonization. For all other parameters, two-tailed independent Student’s t-test was used to determine the difference between uninfected and infected groups, where the level of significance was set at P<0.05. Log transformation was performed in cases where the variances were not equivalent. If the variances of the transformed data were still not equivalent, the Mann-Whitney U-test was used.
RESULTS
Experimental Design
This experiment was designed to test whether a single XPro1595 injection administered when down-regulation is already established could reverse (Single injection groups), and whether TNFα inhibition by XPro1595 throughout the experiment (4 injections groups) could block, the down-regulation of CYP3a family members. A summary of the experimental protocol is shown in Fig. 1A. We determined previously that the down-regulation of P450 enzymes is optimal between 7 and 10 days after infection (Chaluvadi et al., 2009). The dose and dose interval for XPro1595 were chosen because they were demonstrated to promote functional recovery in a model of experimental autoimmune encephalitis (Brambilla et al., 2011).
Tissue weights, colon crypt heights and tissue bacteria in C. rodentium-infected mice
Throughout the experiment, none of the mice showed obvious clinical signs of illness. However, infected mice had slightly looser feces compared to control mice. All animals survived the duration of the C. rodentium infection and no significant changes in body weight were found (data not shown). There were no significant differences in bacterial counts in the colon, liver or blood (Supplemental Fig. 1). Infected mice had a 21% increase in liver weight and this was slightly reduced in the animals receiving XPro1595 throughout the experiment (4 injections, Fig. 1B). As expected, spleen weights were dramatically increased by infection (2.5-fold) and this was the same with or without XPro1595 treatment (Fig. 1C). Colon crypt heights, a measure of mucosal hyperplasia, were significantly increased by 67%, 47% and 47%, respectively in the 0, 1 and 4 dose groups (Fig. 1D).
Effects of TNF-α antagonist on regulation of hepatic P450 mRNAs and proteins during infection
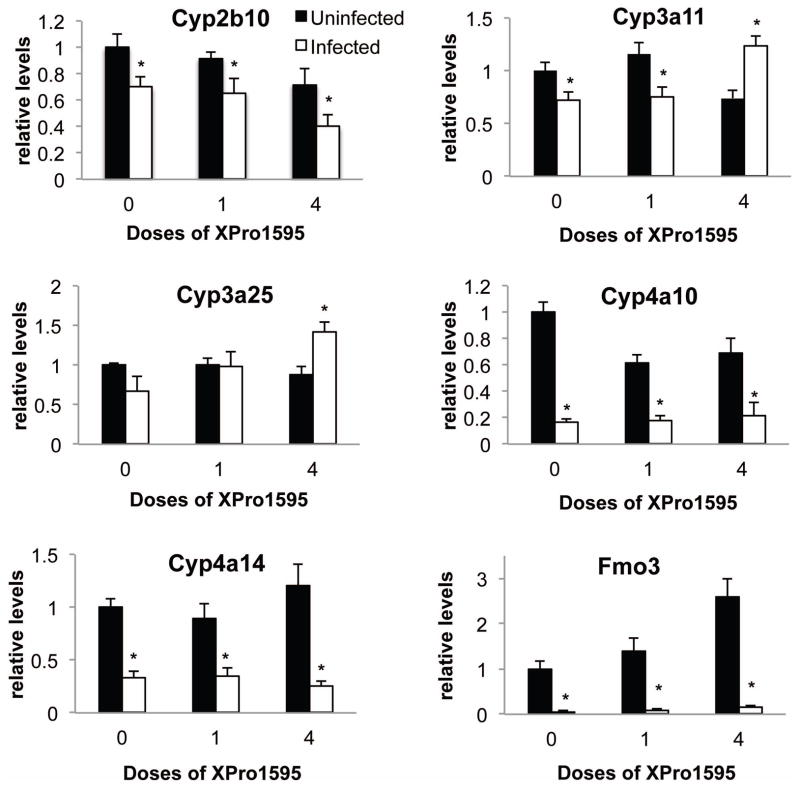
We chose to study a panel of P450 enzymes that we have characterized extensively in this infection model (Chaluvadi et al., 2009; Nyagode et al (2010); Kinloch et al., 2011). They represent the major subfamilies of drug-metabolizing P450s, as well as Cyp4 family enzymes that have roles in metabolism of fatty acids and eicosanoids. C. rodentium infection alone caused significant down regulation in the following hepatic P450 mRNAs: Cyp4a10 (to 14% of control), Cyp4a14 (34%), Cyp3a11 (72%), Cyp2b10 (70%) and Fmo3 (6%) (Fig. 2). Whilst decreases in the mean values for mRNA expression of Cyp3a25 (67%, p=0.10, Fig. 2) and Cyp2d22 (not shown) were observed they did not achieve statistical significance. Treatment with 4 doses of XPro1595 beginning on Day −2 (groups 5 and 6), but not with a single dose on Day 7 (groups 3 and 4), not only blocked Cyp3a11 down-regulation, but actually reversed it so that an increase was observed (Fig. 2). The same pattern was seen with Cyp3a25. In contrast, the down-regulation of other P450s and Fmo3 were unaffected by any XPro1595 treatment (Fig. 2).
Fig. 2.
Effect of TNF-α antagonist on down-regulated P450 and Fmo3 mRNAs following C. rodentium infection. Relative levels of mRNA were measured by RT-qPCR with normalization to GAPDH mRNA, and are expressed relative to the levels in uninfected mice without XPro1595 treatment, which was arbitrarily set at 1. Values represent mean ± S.E.M. (n=6). *, significantly different from uninfected animals in same XPro1595 treatment group, P<0.05.
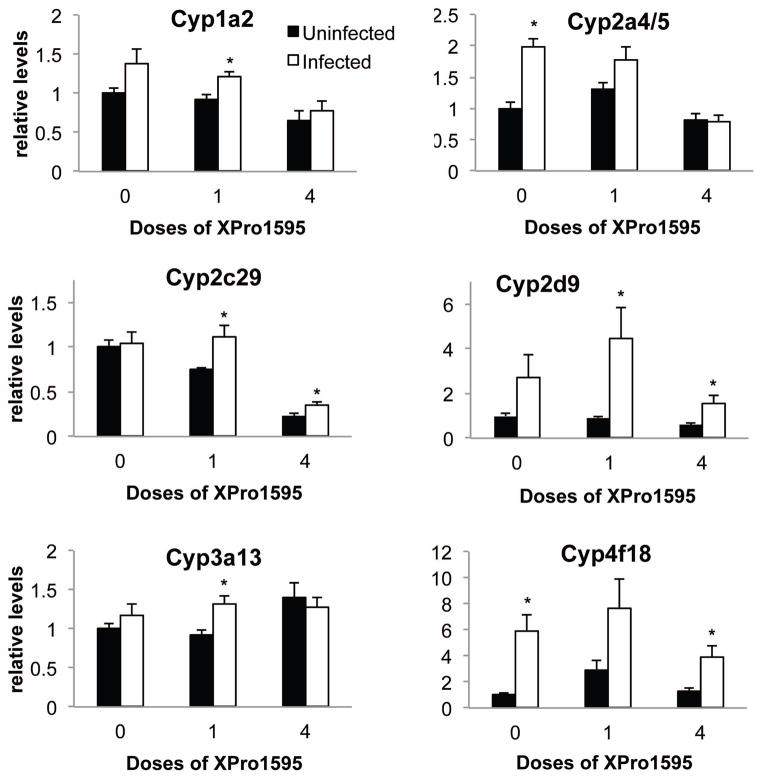
C. rodentium infection tended to induce several other P450 mRNAs (Fig. 3). Cyp2a4/5 (2.0-fold), Cyp4a12 (8.2-fold) and Cyp4f18 (5.9-fold) were significantly induced by infection (Fig. 4). Cyp2d9 (Fig. 3, p=.06) and Cyp1a2 (p=0.11, not shown) showed trends towards induction that were not statistically significant. The increase in Cyp2a4/5 was attenuated when XPro1595 was injected during ongoing infection (one dose), and blocked when XPro1595 was administered throughout the infection (4 doses) (Fig. 3). Cyp2d9, although significantly induced by infection in the single dose group, was less induced in the group receiving 4 doses, suggesting a dose-dependent effect of XPro1595 (Fig. 3). The induction of Cyp4f18 (Fig. 3) and Cyp4a12 (not shown) was minimally affected by XPro1595. Cyp1a2, Cyp3a13 and Cyp2c29 were each induced significantly in the group that received 1 dose of XPro1595 group, whereas only trends towards induction were observed in the group without XPro1595 (Fig. 3).
Fig. 3.
Effect of TNF-α antagonist on up-regulated P450 mRNAs following C. rodentium infection. Relative levels of mRNA were measured by RT-qPCR with normalization to GAPDH mRNA, and are expressed relative to the levels in uninfected mice without XPro1595 treatment, which was arbitrarily set at 1. Values represent mean ± S.E.M. (n=6). *, significantly different from uninfected animals in same XPro1595 treatment group P<0.05.
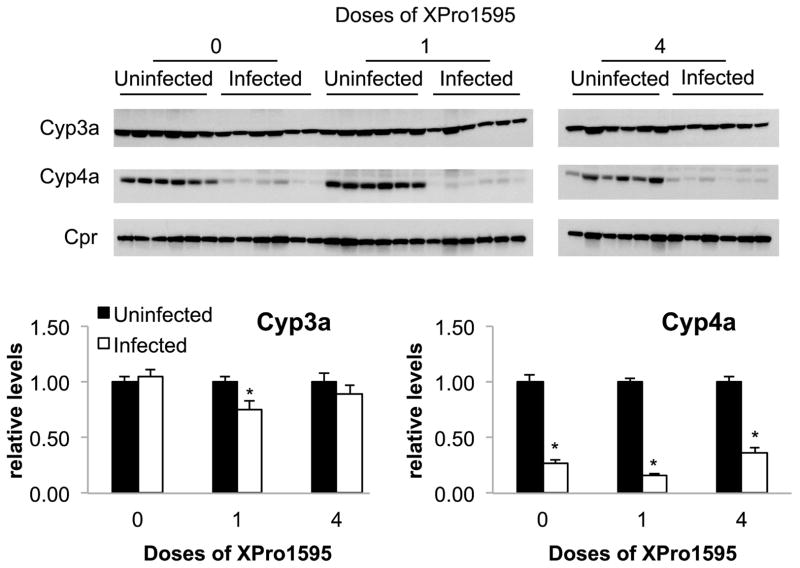
Fig. 4.
Effect of TNF-α antagonist on P450 protein expression following C. rodentium infection. Upper panels: Representative Western blots for Cyp3a, Cyp4a and Cpr. Equal amounts of protein were loaded in each lane. Lower panels: Quantitative analyses of the data. Cyp3a and Cyp4a protein band intensities were normalized to the intensity of Cpr, used here as a loading control. Protein levels are expressed relative to the levels in uninfected mice without XPro1595 treatment, which was arbitrarily set at 1. Values represent mean ± S.E.M. *, significantly different from uninfected animals in same XPro1595 treatment group, P<0.05, n=6.
Western blotting was used to determine whether the changes in mRNA expression also manifested in changes in protein levels. Cpr protein levels were not affected by infection, and were used as a loading control. As seen in Fig. 4, the effect of XPro1595 treatment on Cyp4a proteins was consistent with the effects observed on Cyp4a10 and and 4a14 mRNAs (Fig. 2). That is, Cyp4a proteins were down-regulated to 14% of control during infection, and this was unaffected by XPro1595 treatment. However, infection failed to affect steady-state levels of Cyp3a proteins detected by this antibody.
Effects of TNF-α antagonism on hepatic cytokine and acute phase protein (APP) mRNA expression, and serum cytokine levels during C. rodentium infection
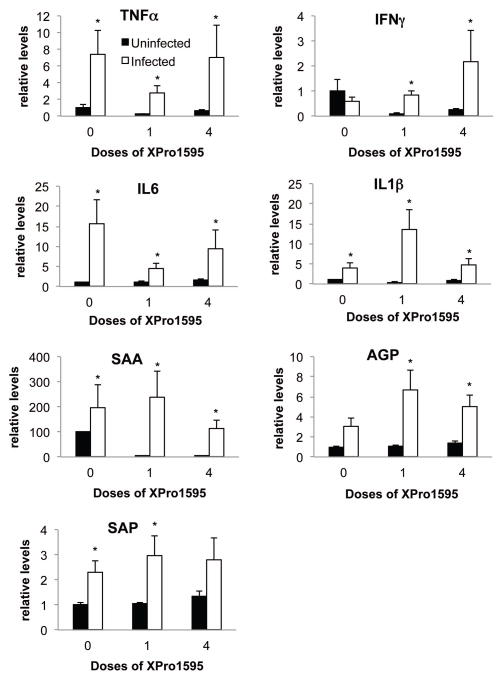
Infection with C. rodentium produced significant increases in the hepatic mRNA expression of TNFα, IL6, IL1β, serum amyloid A (SAA) and serum amyloid P (SAP), indicative of a hepatic inflammatory response (Fig. 5). IFNγ and α1-acid glycoprotein (AGP) were not significantly affected, although AGP showed a trend towards induction. A single XPro1595 treatment on Day 7 attenuated the induction of TNFα and IL6, but had little effect on the induction of the acute phase proteins SAA, AGP and SAP. Interestingly, with the exception of IFNγ, these effects of XPro1595 were smaller or absent when 4 doses were administered beginning on Day −2 (Fig. 5).
Fig. 5.
Hepatic cytokine and acute phase protein mRNAs in mice treated with XPro1595. Relative levels of mRNA were measured by RT-qPCR with normalization to GAPDH mRNA, and are expressed relative to the levels in uninfected mice without XPro1595 treatment, which was arbitrarily set at 1. Values represent mean ± S.E.M. (n=6). *, significantly different from uninfected animals in same XPro1595 treatment group, P<0.05.
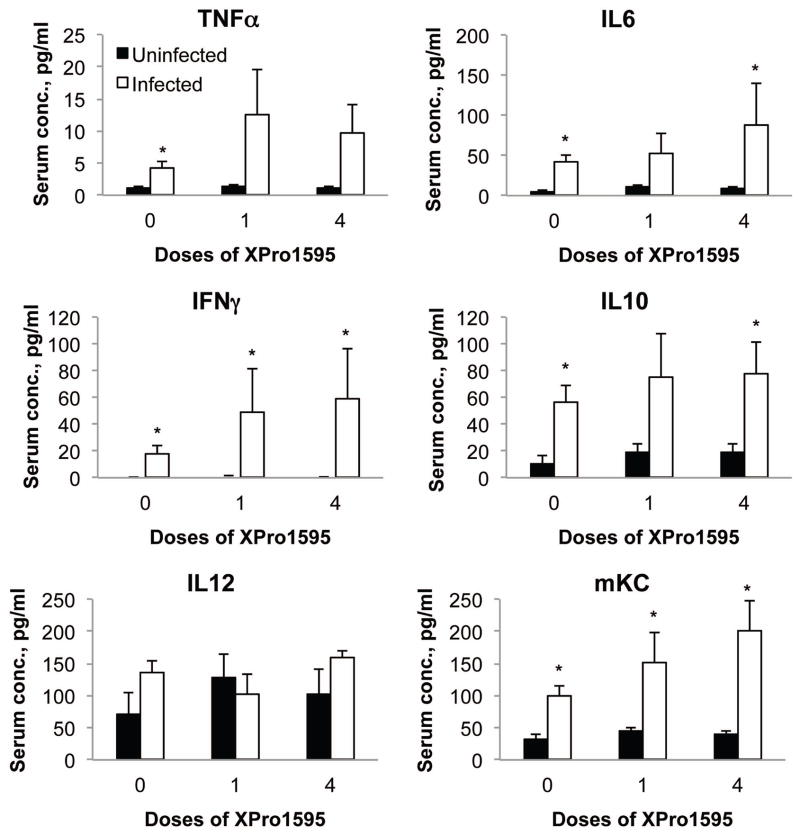
Serum cytokines (Fig. 6) showed a different pattern of regulation than hepatic cytokine mRNAs, indicating that the liver is not the major source of circulating cytokines during C. rodentium infection. XPro1595 treatment did not attenuate any of the observed increases in serum cytokines (Fig. 6). The increases in circulating IL10 and TNFα did not appear to be affected by XPro1595 (Fig. 6). Serum IL1 was unaffected by infection in any of the groups (not shown)
Fig. 6.
Effect of the TNF-α antagonist XPro1595 on serum cytokine levels. Blood was harvested at sacrifice and serum was prepared and analyzed by multiplexed immunoassays. Values represent mean ± S.E.M. (n=6). *, significantly different from uninfected animals in same XPro1595 treatment group, P<0.05.
DISCUSSION
In this study, the soluble TNFα antagonist XPro1595 selectively antagonized the down-regulation of Cyp3a11 and 3a25, as well as the up-regulation of Cyp2a4/5 during C. rodentium infection, an acute inflammatory disease. Other down-regulated transcripts including Cyp2b10, Cyp4a10, Cyp4a14 and Fmo3 were unaffected by XPro1595 treatment. These data implicate an in vivo role for soluble TNFα in down-regulating certain Cyp3a genes in this inflammatory disease model. It also suggests that XPro1595 is in principle capable of causing DDDI via Cyp3a modulation in this particular model. Ling and Jamali (2009) first demonstrated the potential for TNFα DDDI using infliximab in a rat pre-adjuvant arthritis model. However, no such DDDI has yet been reported for TNFα in humans. It remains to be determined whether or not TNFα antagonism will reverse Cyp3a down-regulation in models of chronic inflammatory disease, for which biologic drugs are prescribed in humans.
The selective blockade of Cyp3a down-regulation by XPro1595 is in excellent agreement with the findings in TNFR1 knockout mice and in cultured hepatocytes (Kinloch et al., 2011). These mice show increased pathologic responses to C. rodentium infection (Goncalves et al., 2001), and accordingly they had increased hepatic expression of TNFα, IL6, IL1β and AGP indicative of an increased inflammatory response (Kinloch et al., 2011). As a result they actually had potentiated down-regulation of Cyp4a10, Cyp4a14 and Fmo3 as well as potentiated induction of Cyp2d9 and Cyp4f18 (Kinloch et al., 2011). XPro1595 did not attenuate the hepatic or serum cytokine responses to infection (Fig. 5 and 6) and there was no significant impact of XPro1595 on spleen weight or on tissue levels of bacteria. Thus, a generalized decrease in inflammation is not responsible for XPro1595’s reversal of Cyp3a down-regulation nor its blockade of Cyp2a4/5 induction. Because XPro1595 neutralizes only the soluble, circulating form of TNFα (Zalevsky et al., 2007) which signals primarily through TNFR1 (Holtmann and Neurath, 2004), we can conclude that soluble TNFα regulates Cyp3a expression in this disease model, and not the membrane bound form of TNFα which signals primarily through TNFR2 (Grell et al., 1995). Future studies should compare and contrast the effects of XPro1595 in this model with those of biologics that target TNFα nonselectively (e.g. etanercept).
In this study, infection by C. rodentium failed to significantly affect Cyp 3a protein expression as measured by Western blotting. We have previously observed that changes in Cyp3a proteins during infection are smaller in magnitude than changes in Cyp3a mRNAs (Nyagode et al., 2010). This could be explained by kinetic considerations, post-transcriptional regulation, by the unknown specificity of the antibodies (raised against rat CYP3A) for mouse enzymes, or by a combination of these factors.
Our qPCR primers could not distinguish Cyp2a4 and 2a5 mRNAs, which have 96% sequence identity (Lindberg et al., 1989). It seems most likely that our observations represent an increase in Cyp2a5 mRNA, which is known to be induced under several pathophysiological conditions (Su and Ding, 2004). Cyp2a4/5 mRNA expression was increased by infection, and this effect was abolished by XPro1595 given from Day-2 indicating a role for TNFα in the induction of Cyp2a4/5 during C. rodentium infection. There was a tendency towards the same phenomenon for Cyp1a2, but this could not be determined because the “effect” in the XPro1595 controls was not significant.
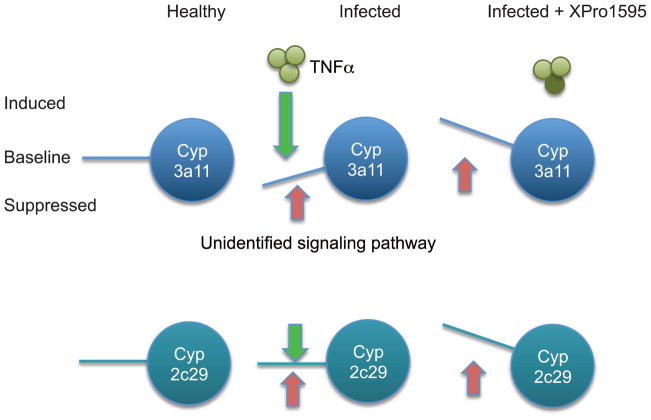
Why were Cyp3a11 and Cyp3a25 mRNAs actually increased by infection in the animals treated with 4 doses of XPro1595? Similarly, Cyp2c29 and 3a13 mRNAs were only significantly increased in one or both of the XPro1595-treated groups (Fig. 4). It is well documented that different P450s have different sensitivities to different inflammatory cytokines (reviewed in (Morgan, 1997)). We can speculate that for Cyp3a11 and 3a25, there could be two opposing signals due to infection, of which the suppressive effect of TNFα is dominant (Fig. 7). For 2c29 and 3a13 the two signals cancel each other out. When the suppression by TNFα is removed, induction can occur. For other P450s, TNFα may not have an important in vivo role. It is possible that the increase in Cyp3a11 mRNA in mice that received 4 doses of XPro1595 is partly due to the apparent decrease in the corresponding uninfected group. However, this is not the case for Cyp3a25.
Fig. 7.
Proposed mechanism for disease-dependent up-regulation of P450 enzymes by XPro1595 treatment.
In the clear cases where XPro1595 had an effect on P450 regulation, the effect was greatest in the animals that received 4 doses, and less clear in the animals treated only once on day 7. This could be due to the need for an accumulation of XPro1595 with successive injections, or it could mean that TNFα begins to affect P450 expression before Day 7, and those effects persist even when the effect of soluble TNFα is neutralized. Since the single injection on Day 7 had clear effects on hepatic IL6, TNF and IL1β expression, there is again not a good correlation between overall effect on inflammation and on P450 regulation.
This study was designed to test the effect of XPro1595 on down-regulation of P450s by infection, and therefore was not powered for multiple comparisons that would allow us to test the effect of XPro1595 alone on drug metabolizing enzyme expression. Nevertheless, examination of the data (Figs. 3 and 4) suggests that the expression of Cyp2b10, Cyp4a10 and Cyp2c29 may be reduced by XPro1595 treatment; whereas Fmo3 expression may be increased. Additional studies will be needed to determine whether there are any significant effects on these enzymes in the absence of disease.
In conclusion, our results support previous work indicating a selective in vivo role for TNFα in the suppression of Cyp3a11 and Cyp3a25 in a model of acute infectious colitis. The ability of XPro1595 to abolish Cyp3a11 and Cyp3a25 suppression, and to uncover inductive effects of infection on Cyp3a11, 3a25, 2c29 and 3a13 in this model of inflammation suggests in principle that the propensities of biologic drugs to cause DDDI in humans may not be limited to just a normalization of decreased drug clearance due to inflammation. We speculate that DDDI could actually cause clearance of Cyp3a (CYP3A in humans) substrates such as statins, HIV protease inhibitors, cyclosporine etc. to increase above that found in the healthy state, with consequent decreases in efficacy of co-treated drugs in affected individuals. However, studies are needed in other disease models and with approved biologic drugs to determine whether or not this observation is generally applicable.
Supplementary Material
Acknowledgments
We are grateful to Xencor, Inc, for supplying the XPro1595, and to David Szymkowsk of Xencor, Inc., for insightful comments on the manuscript.
MG Tansey is co-inventor of the dominant negative TNF inhibitors and an ex-employee of Xencor Inc. She does not hold significant financial stake in the company and is not a consultant.
This work was supported by a grant from the National Institutes of Health to ETM [Grant R01 DK072372]
Abbreviations
- AGP
α1-acid glycoprotein
- Cpr
NADPH-cytochrome P450 reductase
- DDDI
disease-dependent drug-drug interaction
- Fmo
flavin monooxygenase
- GAPDH
glyceraldehyde-3-phosphate dehydrogenase
- IFNγ
interferon-γ
- IL
interleukin
- LPS
lipopolysaccharide
- mKC
chemokine (C-X-C motif) ligand 1
- P450
cytochrome P450
- RT-qPCR
reverse transcriptase-quantitative real-time polymerase chain reaction
- SAA
serum amyloid A
- SAP
serum amyloid P
- TNFα
tumor necrosis factor-α
- TNFR1
TNFα receptor-1
References Cited
- Abdel-Razzak Z, Loyer P, Fautrel A, Gautier JC, Corcos L, Turlin B, Beaune P, Guillouzo A. Cytokines down-regulate expression of major cytochrome P-450 enzymes in adult human hepatocytes in primary culture. Molecular Pharmacology. 1993;44 (4):707–715. [PubMed] [Google Scholar]
- Aitken AE, Morgan ET. Gene-specific effects of inflammatory cytokines on cytochrome P450 2C, 2B6 and 3A4 mRNA levels in human hepatocytes. Drug Metabolism and Disposition. 2007;35 (9):1687–1693. doi: 10.1124/dmd.107.015511. [DOI] [PMC free article] [PubMed] [Google Scholar]
- Aitken AE, Richardson TA, Morgan ET. Regulation of drug-metabolizing enzymes and transporters in inflammation. Annual Reviews of Pharmacology and Toxicology. 2006;46:123–149. doi: 10.1146/annurev.pharmtox.46.120604.141059. [DOI] [PubMed] [Google Scholar]
- Ashino T, Arima Y, Shioda S, Iwakura Y, Numazawa S, Yoshida T. Effect of interleukin-6 neutralization on CYP3A11 and metallothionein-1/2 expressions in arthritic mouse liver. European Journal of Pharmacology. 2007;558 (1–3):199–207. doi: 10.1016/j.ejphar.2006.11.072. [DOI] [PubMed] [Google Scholar]
- Ashino T, Oguro T, Shioda S, Horai R, Asano M, Sekikawa K, Iwakura Y, Numazawa S, Yoshida T. Involvement of interleukin-6 and tumor necrosis factor alpha in CYP3A11 and 2C29 down-regulation by Bacillus Calmette-Guerin and lipopolysaccharide in mouse liver. Drug Metabolism and Disposition. 2004;32 (7):707–714. doi: 10.1124/dmd.32.7.707. [DOI] [PubMed] [Google Scholar]
- Brambilla R, Ashbaugh JJ, Magliozzi R, Dellarole A, Karmally S, Szymkowski DE, Bethea JR. Inhibition of soluble tumour necrosis factor is therapeutic in experimental autoimmune encephalomyelitis and promotes axon preservation and remyelination. Brain. 2011;134 (Pt 9):2736–2754. doi: 10.1093/brain/awr199. [DOI] [PMC free article] [PubMed] [Google Scholar]
- Caro AA, Evans KL, Cederbaum AI. CYP2E1 overexpression inhibits microsomal Ca2+-ATPase activity in HepG2 cells. Toxicology. 2009;255 (3):171–176. doi: 10.1016/j.tox.2008.10.020. [DOI] [PMC free article] [PubMed] [Google Scholar]
- Chaluvadi MR, Kinloch RD, Nyagode BA, Richardson TA, Raynor MJ, Sherman M, Antonovic L, Strobel HW, Dillehay DL, Morgan ET. Regulation of hepatic cytochrome P450 expression in mice with intestinal or systemic infections of citrobacter rodentium. Drug Metabolism and Disposition. 2009;37 (2):366–374. doi: 10.1124/dmd.108.024240. [DOI] [PMC free article] [PubMed] [Google Scholar]
- Chen JQ, Strom A, Gustafsson JA, Morgan ET. Suppression of the constitutive expression of cytochrome P-450 2C11 by cytokines and interferons in primary cultures of rat hepatocytes: comparison with induction of acute-phase genes and demonstration that CYP2C11 promoter sequences are involved in the suppressive response to interleukins 1 and 6. Molecular Pharmacology. 1995;47 (5):940–947. [PubMed] [Google Scholar]
- Dickmann LJ, Patel SK, Wienkers LC, Slatter JG. Effects of interleukin 1beta (IL-1beta) and IL-1beta/interleukin 6 (IL-6) combinations on drug metabolizing enzymes in human hepatocyte culture. Current Drug Metabolism. 2012;13 (7):930–937. doi: 10.2174/138920012802138642. [DOI] [PubMed] [Google Scholar]
- Evers R, Dallas S, Dickmann LJ, Fahmi OA, Kenny JR, Kraynov E, Nguyen T, Patel AH, Slatter JG, Zhang LK. Critical Review of Preclinical Approaches to Investigate Cytochrome P450-mediated Therapeutic Protein Drug-Drug Interactions and Recommendations for Best Practices: A White Paper. Drug Metabolism and Disposition. 2013;41(9):1598–1609. doi: 10.1124/dmd.113.052225. [DOI] [PubMed] [Google Scholar]
- Ghezzi P, Saccardo B, Bianchi M. Recombinant tumor necrosis factor depresses cytochrome P450-dependent microsomal drug metabolism in mice. Biochemical and Biophysical Research Communications. 1986a;136(1):316–321. doi: 10.1016/0006-291x(86)90912-5. [DOI] [PubMed] [Google Scholar]
- Ghezzi P, Saccardo B, Villa P, Rossi V, Bianchi M, Dinarello CA. Role of interleukin-1 in the depression of liver drug metabolism by endotoxin. Infection and Immunity. 1986b;54 (3):837–840. doi: 10.1128/iai.54.3.837-840.1986. [DOI] [PMC free article] [PubMed] [Google Scholar]
- Goncalves NS, Ghaem-Maghami M, Monteleone G, Frankel G, Dougan G, Lewis DJ, Simmons CP, MacDonald TT. Critical role for tumor necrosis factor alpha in controlling the number of lumenal pathogenic bacteria and immunopathology in infectious colitis. Infection and Immunity. 2001;69 (11):6651–6659. doi: 10.1128/IAI.69.11.6651-6659.2001. [DOI] [PMC free article] [PubMed] [Google Scholar]
- Grell M, Douni E, Wajant H, Lohden M, Clauss M, Maxeiner B, Georgopoulos S, Lesslauer W, Kollias G, Pfizenmaier K, Scheurich P. The transmembrane form of tumor necrosis factor is the prime activating ligand of the 80 kDa tumor necrosis factor receptor. Cell. 1995;83 (5):793–802. doi: 10.1016/0092-8674(95)90192-2. [DOI] [PubMed] [Google Scholar]
- Higgins LM, Frankel G, Douce G, Dougan G, MacDonald TT. Citrobacter rodentium infection in mice elicits a mucosal Th1 cytokine response and lesions similar to those in murine inflammatory bowel disease. Infection and Immunity. 1999;67 (6):3031–3039. doi: 10.1128/iai.67.6.3031-3039.1999. [DOI] [PMC free article] [PubMed] [Google Scholar]
- Holtmann MH, Neurath MF. Differential TNF-signaling in chronic inflammatory disorders. Current Molecular Medicine. 2004;4 (4):439–444. doi: 10.2174/1566524043360636. [DOI] [PubMed] [Google Scholar]
- Kinloch RD, Lee C-M, van Rooijen N, Morgan ET. Selective role for tumor necrosis factor-α, but not interleukin-1 or Kupffer cells, in down-regulation of CYP3A11 and CYP3A25 in livers of mice infected with a noninvasive intestinal pathogen. Biochemical Pharmacology. 2011;82 (3):312–321. doi: 10.1016/j.bcp.2011.04.016. [DOI] [PMC free article] [PubMed] [Google Scholar]
- Lindberg R, Burkhart B, Ichikawa T, Negishi M. The structure and characterization of type I P-450(15) alpha gene as major steroid 15 alpha-hydroxylase and its comparison with type II P-450(15) alpha gene. Journal of Biological Chemistry. 1989;264 (11):6465–6471. [PubMed] [Google Scholar]
- Ling S, Jamali F. The effect of infliximab on hepatic cytochrome P450 and pharmacokinetics of verapamil in rats with pre-adjuvant arthritis: a drug-disease and drug-drug interaction. Basic and Clinical Pharmacology and Toxicology. 2009;105 (1):24–29. doi: 10.1111/j.1742-7843.2009.00405.x. [DOI] [PubMed] [Google Scholar]
- Livak KJ, Schmittgen TD. Analysis of relative gene expression data using real-time quantitative PCR and the 2(−Delta Delta C(T)) Method. Methods. 2001;25 (4):402–408. doi: 10.1006/meth.2001.1262. [DOI] [PubMed] [Google Scholar]
- Miyoshi M, Nadai M, Nitta A, Ueyama J, Shimizu A, Takagi K, Nabeshima T, Takagi K, Saito K, Hasegawa T. Role of tumor necrosis factor-alpha in down-regulation of hepatic cytochrome P450 and P-glycoprotein by endotoxin. European Journal of Pharmacology. 2005;507 (1–3):229–237. doi: 10.1016/j.ejphar.2004.11.035. [DOI] [PubMed] [Google Scholar]
- Morgan ET. Regulation of cytochromes P450 during inflammation and infection. Drug Metabolism Reviews. 1997;29 (4):1129–1188. doi: 10.3109/03602539709002246. [DOI] [PubMed] [Google Scholar]
- Morgan ET. Impact of infectious and inflammatory disease on cytochrome P450-mediated drug metabolism and pharmacokinetics. Clinical Pharmacology and Therapeutics. 2009;85 (4):434–438. doi: 10.1038/clpt.2008.302. [DOI] [PMC free article] [PubMed] [Google Scholar]
- Morgan ET, Thomas KB, Swanson R, Vales T, Hwang J, Wright K. Selective suppression of cytochrome P-450 gene expression by interleukins 1 and 6 in rat liver. Biochimica et Biophysica Acta. 1994;1219 (2):475–483. doi: 10.1016/0167-4781(94)90074-4. [DOI] [PubMed] [Google Scholar]
- Nyagode BA, Lee CM, Morgan ET. Modulation of hepatic cytochrome P450s by Citrobacter rodentium infection in interleukin-6- and interferon-{gamma}-null mice. Journal of Pharmacology and Experimental Therapeutics. 2010;335 (2):480–488. doi: 10.1124/jpet.110.171488. [DOI] [PMC free article] [PubMed] [Google Scholar]
- Renton KW, Singh G, Stebbing N. Relationship between the antiviral effects of interferons and their abilities to depress cytochrome P-450. Biochemical Pharmacology. 1984;33 (23):3899–3902. doi: 10.1016/0006-2952(84)90058-3. [DOI] [PubMed] [Google Scholar]
- Schmitt C, Kuhn B, Zhang X, Kivitz AJ, Grange S. Disease-drug-drug interaction involving tocilizumab and simvastatin in patients with rheumatoid arthritis. Clinical Pharmacology and Therapeutics. 2011;89 (5):735–740. doi: 10.1038/clpt.2011.35. [DOI] [PubMed] [Google Scholar]
- Steed PM, Tansey MG, Zalevsky J, Zhukovsky EA, Desjarlais JR, Szymkowski DE, Abbott C, Carmichael D, Chan C, Cherry L, Cheung P, Chirino AJ, Chung HH, Doberstein SK, Eivazi A, Filikov AV, Gao SX, Hubert RS, Hwang M, Hyun L, Kashi S, Kim A, Kim E, Kung J, Martinez SP, Muchhal US, Nguyen DH, O’Brien C, O’Keefe D, Singer K, Vafa O, Vielmetter J, Yoder SC, Dahiyat BI. Inactivation of TNF signaling by rationally designed dominant-negative TNF variants. Science. 2003;301 (5641):1895–1898. doi: 10.1126/science.1081297. [DOI] [PubMed] [Google Scholar]
- Su T, Ding X. Regulation of the cytochrome P450 2A genes. Toxicology and Applied Pharmacology. 2004;199 (3):285–294. doi: 10.1016/j.taap.2003.11.029. [DOI] [PubMed] [Google Scholar]
- Tapner M, Liddle C, Goodwin B, George J, Farrell GC. Interferon gamma down-regulates cytochrome P450 3A genes in primary cultures of well-differentiated rat hepatocytes. Hepatology. 1996;24 (2):367–373. doi: 10.1002/hep.510240213. [DOI] [PubMed] [Google Scholar]
- Warren GW, Poloyac SM, Gary DS, Mattson MP, Blouin RA. Hepatic cytochrome P-450 expression in tumor necrosis factor-alpha receptor (p55/p75) knockout mice after endotoxin administration. Journal of Pharmacology and Experimental Therapeutics. 1999;288 (3):945–950. [PubMed] [Google Scholar]
- Zalevsky J, Secher T, Ezhevsky SA, Janot L, Steed PM, O’Brien C, Eivazi A, Kung J, Nguyen DH, Doberstein SK, Erard F, Ryffel B, Szymkowski DE. Dominant-negative inhibitors of soluble TNF attenuate experimental arthritis without suppressing innate immunity to infection. Journal of Immunology. 2007;179 (3):1872–1883. doi: 10.4049/jimmunol.179.3.1872. [DOI] [PubMed] [Google Scholar]
Associated Data
This section collects any data citations, data availability statements, or supplementary materials included in this article.


