

Abstract
Although dermal collagens appear increased in hypertrophic scars, this was not tested in tissue samples using objective methods. We compared the expression of types I and III collagen in hypertrophic and non-hypertrophic scars, at 6–12 and 18–24 months after burn using a quantitative method. Among 17 patients with extensive burns, 3 patients had acute scars, 8 had hypertrophic or non-hypertrophic scars at 6–12 months after burn, and 6 had hypertrophic or non-hypertrophic scars at 18–24 months after burn. After clinical assessment of scars using the Vancouver Scale, immunohistochemistry for types I and III collagens was performed. Images were captured with a laser scanning confocal microscope and the relative amounts of types I and III collagens were determined in superficial and deep dermis. The effects of time and scar type were assessed using two way ANOVA and Tukey’s test. Collagen III scar/normal ratios were higher in hypertrophic scars at both time points (p=0.05). There were no differences in collagen I scar/normal ratios. Large variation was observed in scars during the acute phase regarding the expression of collagens. Easily accessed by immunohistochemistry and confocal microscopy, type III collagen deposition may help in determining scar phenotype, differentiating hypertrophic and non-hypertrophic scars.
Keywords: Confocal microscopy, immunohistochemistry, hypertrophic scar, type I collagen, type III collagen
INTRODUCTION
Keloids and hypertrophic scars are abnormal wound responses that occur in predisposed individuals (1). Although scars frequently result in significant cosmetic and functional sequel, they are usually evaluated using subjective clinical assessment (2, 3, 4). Our aim in this study was to analyze relative amounts of collagens type I and III in scars at various phases after burn, comparing them to their paired normal skin, by using immunohistochemistry and laser confocal microscopy.
Clinical features seen in abnormal scars comprise changes in skin pigmentation, vascularity, pliability, and height (5). The Vancouver scale was the first attempt to standardize scar assessment by different observers, and has become a generally accepted clinical scar assessment tool in most centers that specialize in scar treatment (6). In this scale, pigmentation, pliability, height and vascularity are scored, and the sum of the scores results in a number that is greater in scars that are more hypertrophic (5). The original Vancouver Scale did not include assessment of “mixed pigmentation”, “pain” and “itching”. In order to address those issues, modifications of the scale have been proposed (5, 6, 7, 8).
While enlargement of hypertrophic scars is clinically characterized by increases in pigmentation, pliability, height and vascularity, the molecular changes taking place in a hypertrophic scar are not well understood. Collagen deposition is known to increase during scar formation, and collagen types I and III are thought to account for such increase (9). However, investigations of collagen formation in scars have been somewhat contradictory. Some have shown increases in types I or III collagen in both hypertrophic scars and keloids (10), while others have found hypertrophic scars to have decreases in the expression of these same collagens (11). There have also been reports of increases in the relative amounts of type III collagen in hypertrophic scars (12–17). The conflicting results on the evaluation of scar collagen among several authors may occur partially due to technical limitations of the methods that have been used to evaluate scars (11). The in vitro environment may be particularly limited in its ability to reproduce the in vivo complex system that affects of extracellular matrix production, deposition, turnover and degradation.
Therefore, we designed this study to specifically investigate the expression of types I and III collagen in tissue samples from hypertrophic and non-hypertrophic scars, in various phases after burn. We used immunohistochemistry and confocal laser microscopy to assess the expression of collagens in paired samples of scars and normal skin, all from the same anatomical region, in age-matched male patients.
METHODS
This study was designed to assess the development of burn scars in male patients with ages ranging from 2–17 years. Our aim was to determine the pattern of expression for types I and III collagen in acute scars, hypertrophic scars and non-hypertrophic scars after burn, by using immunohistochemistry and a laser scanning confocal microscope. The study was approved by the UTMB Institutional Review Board (IRB) and was conducted according to the Helsinki principles.
Patients
They were enrolled who had burns over 40% of the total body surface area (TBSA), whose legal guardians provided informed consent, and who came for evaluation during the period from discharge to twenty four months after the injury. Patients underwent clinical evaluations in the acute phase (with recently healed scars) while still in the hospital recovering from the burn, and the findings were compared to patients who came for clinical evaluation between 6–12 months after burn or between 18–24 months after burn. Only one scar per patient was included in the study, corresponding to the most representative scar on the anterior thigh after a deep second or third degree burn. The scar was classified in “hypertrophic or non-hypertrophic” and rated using the modified Vancouver Scar Scale. Hypertrophic scars corresponded to Vancouver ≥ 7 and non-hypertrophic scars corresponded to Vancouver ≤ 6.
Scar classification
Scars on the thighs of 17 patients were clinically classified as acute, when they were recently healed scars observed less than 1.5 months after burn, and as hypertrophic and non-hypertrophic when they were between 6–12 and 18–24 months after burn, and rated using the modified Vancouver Scale (Figure 1).
Figure 1.
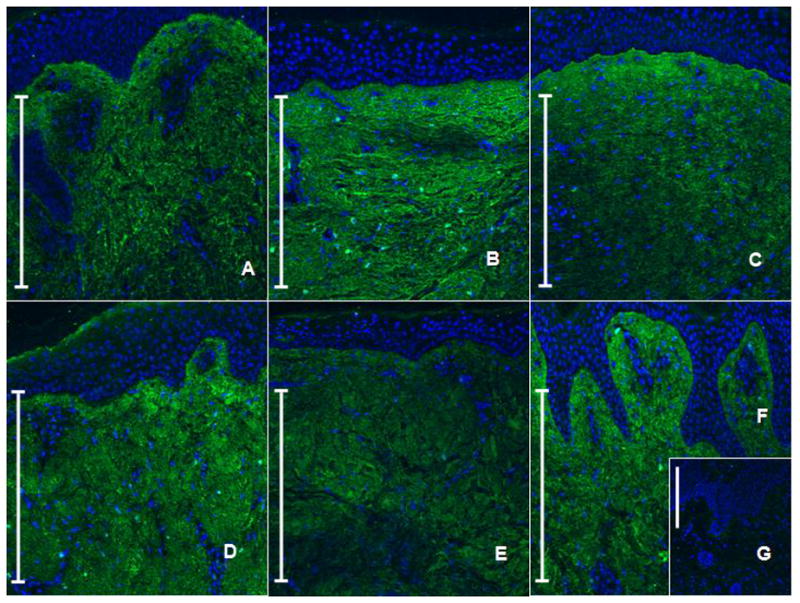
Type I collagen immunohistochemistry. Type I collagen is labeled with a FITC-secondary antibody (green), while nuclei is labeled with DAPI (blue). Acute scar (A), Hypertrophic scars (B: 6–12 months; D: 18–24 months), Non-hypertrophic scars (C: 6–12 months; E: 18–24 months), normal skin (F), negative control (G). We observe that, in hypertrophic scars, collagen fibers display a parallel pattern (B, D), while non-hypertrophic scars collagen fibers tend to form more delicate waves, randomly distributed (C, E), closely to what occurs in normal skin (F).
Skin samples
Punch biopsies 3 mm in diameter were taken from scars and paired normal skin in 17 patients. Three acute scars, four hypertrophic and four non-hypertrophic scars at 6–12 months after burn, and three hypertrophic and three non-hypertrophic scars at 18–24 months after burn were immediately immersed in a mixture of 80% methanol/20% dimethyl sulfoxide (DMSO) at −20°C, freeze-substituted and embedded in paraffin (Table 1).
Table 1.
Demographic characteristics and Vancouver scores of the patients of the various groups.
| Patient | Pigmentation | Pliability | Height | Vascularity | Pain | Itching | Vancouver | Age | Gender |
|---|---|---|---|---|---|---|---|---|---|
| Acute phase | |||||||||
| 1 | 2 | 0 | 0 | 3 | ? | ? | 5 | 12 | male |
| 2 | 3 | 3 | 1 | 3 | ? | ? | 10 | 3 | male |
| 3 | 1 | 1 | 0 | 3 | 2 | 0 | 7 | 10 | male |
| Hypertrophic scars 6–12 months | |||||||||
| 4 | 2 | 4 | 3 | 2 | 0 | 1 | 12 | 4 | male |
| 5 | 3 | 3 | 2 | 0 | 2 | 0 | 10 | 9 | male |
| 6 | 3 | 2 | 2 | 0 | 0 | 0 | 7 | 11 | male |
| 7 | 3 | 3 | 2 | 2 | 1 | 1 | 12 | 15 | male |
| Hypertrophic scars 18–24 months | |||||||||
| 8 | 3 | 3 | 2 | 0 | 0 | 0 | 8 | 16 | male |
| 9 | 3 | 2 | 2 | 3 | 1 | 1 | 12 | 6 | male |
| 10 | 3 | 3 | 3 | 2 | 0 | 1 | 12 | 12 | male |
| Non-hypertrophic scars 6–12 months | |||||||||
| 11 | 2 | 1 | 1 | 0 | 0 | 2 | 6 | 10 | male |
| 12 | 3 | 0 | 0 | 0 | 0 | 0 | 3 | 11 | male |
| 13 | 3 | 1 | 1 | 0 | 0 | 0 | 5 | 17 | male |
| 14 | 2 | 1 | 1 | 0 | 0 | 0 | 4 | 6 | male |
| Non-hypertrophic scars 18–24 months | |||||||||
| 15 | 2 | 1 | 0 | 0 | 0 | 1 | 4 | 16 | male |
| 16 | 2 | 1 | 0 | 0 | 0 | 0 | 3 | 6 | male |
| 17 | 2 | 1 | 0 | 0 | 0 | 0 | 3 | 6 | male |
Immunofluorescence and confocal microscopy for collagen types I and III
After deparaffinization and rehydration, three consecutive sections 4 micrometers thick were treated for one hour with 1% bovine serum albumin (Vector Laboratories, Burlingame, CA) in phosphate buffered saline containing 0.1% Tween 20, to decrease nonspecific binding of IgG, and incubated overnight at 4°C with a polyclonal primary antibody for collagen I or collagen III at a dilution of 1:200 (Research Diagnostics Inc., Flanders, NJ). On the next day, FITC-conjugated goat anti-rabbit IgG was used as secondary antibody (Neomarkers®, Fremont, CA) and cell nuclei were stained with 4,6-diamidino-2-phenylindole (DAPI) (Vector Mounting Medium®, Burlingame, CA). Images were captured using a confocal laser scanning microscope (Zeiss LSM 510®, Jena, Germany), with a 20X objective, and analyzed using Image Tool® Software. The connective tissue was divided into two distinct regions: Region 1 included superficial connective tissue, corresponding to papillary dermis. Region 2 included deep connective tissue corresponding to the upper 100 μm of the reticular dermis. In order to perform a quantitative analysis of collagen content, the instrument was calibrated and the intensity of fluorescence was measured in standardized 20 μm squares in these regions and compared with the matched normal skin. A scar index was defined as the ratio of the measurement in scar divided by that in normal skin (index = scar/normal skin). The images were analyzed in 8-bit gray scale mode. The intensity of fluorescence is given by the unit “gray level”, varying from zero (black) to 255 (white). Three images were captured from each dermal region and then intensity measurements were obtained from three different areas within each image. The resulting intensity of fluorescence value represented the mean value from 9 measurements taken under standard conditions after the background was subtracted.
Statistical analysis
The effects of time (6–12 months versus 18–24 months) and scar type (non-hypertrophic versus hypertrophic) were assessed using a two way ANOVA followed by Tukey’s test, with p<0.05 accepted as indicating significance.
RESULTS
Scar classification during clinic appointments
Due to the small number of patients in each of the 5 study groups, patients with “hypertrophic scars” were combined and compared to patients with “non-hypertrophic scars”. No differences were seen regarding age in these two groups. The Vancouver Scores varied from 3–6 in non-hypertrophic scars, and from 7–12 in hypertrophic scars. In order to meet the inclusion criteria of this study, all patients were male. Table 1 summarizes the demographic characteristics of the study patients.
Evaluation of dermal collagens in tissue samples
The acute phase group of scars and paired normal skin samples displayed a large variation regarding the expression of types I and III collagen. Therefore, this group was excluded from the analysis, and a two-way ANOVA with factors time and treatment was performed comparing the other 4 groups, considering the index scars/normal skin. When the groups of scars between 6–12 months were compared to scars between 18–24 months, no differences were seen regarding collagen I expression (Figures 1 and 2). For collagen III, the ratio of scar collagen to that of normal skin was higher in hypertrophic scars than in non-hypertrophic scars at both time points (p = 0.05) (Figures 3 and 4).
Figure 2.

Type I collagen expression in the study groups.
Figure 3.
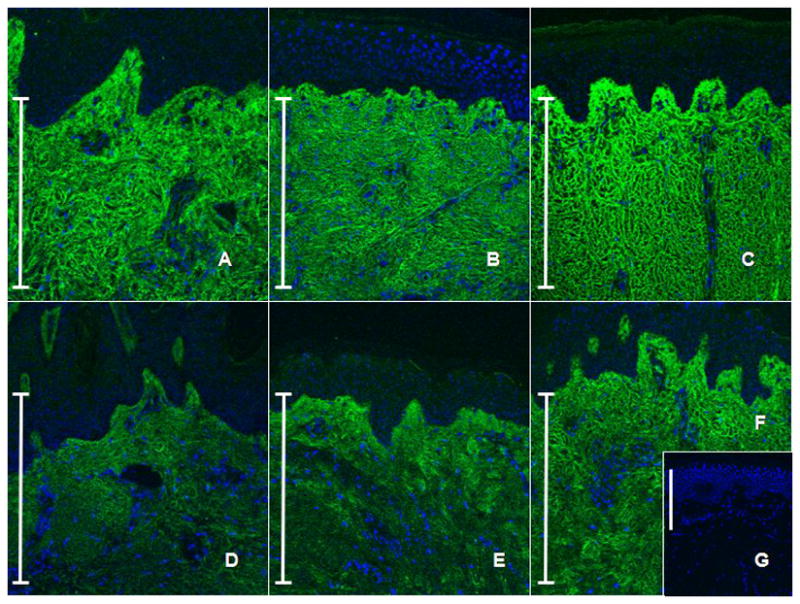
Type III collagen immunohistochemistry. Type III collagen is labeled with a FITC-secondary antibody (green), while nuclei are labeled with DAPI (blue). Acute scar (A), Hypertrophic scars (B: 6–12 months; C: 18–24 months), Non-hypertrophic scars (D: 6–12 months; E: 18–24 months), normal skin (F), negative control (G). Collagen type III is expressed all along the papillary and reticular dermis already in the acute scars (A). Hypertrophic scars have increased expression of type III collagen in deeper layers of dermis (reticular dermis) (D, E), while a “degree” of type III collagen expression is observed in non-hypertrophic scars, with increased expression in the superficial papillary dermis, decreasing in the reticular dermis, similar to the observed in normal skin (F).
Figure 4.

Type III collagen expression in the study groups.
DISCUSSION
This study was developed in order to establish an objective methodology to assess hypertrophic and non-hypertrophic burn scars. In a previous investigation, we found that hypertrophic scars usually develop between discharge (around 1.5 months after burn, when the patients have acute recently healed scars) and the 6 months visit (18). Since we observed that scars reach maximum scores of hypertrophy between 6 to 12 months (18), scars in this interval were combined. Also, we found that scars have a tendency to regress in the mature phase, from 18 to 24 months after trauma, and we also combined the scars from this interval, as they behaved in a similar manner (18).
Studies on scar formation are usually complicated by a number of variables, such as differences between human and experimental animal skin, objective methods for evaluation and influence of anatomical site on scar formation (4). In this study, evaluation of scars from the same anatomical site, caused by similar mechanism of injury, may have increased the consistency of our results.
Hypertrophic scars (HS) occur frequently after deep dermal injury, such as deep partial-thickness burns and abrasions, and they have been characterized by overproduction of collagen (19). This is in agreement with our results, but we further determined that this increase is due to accumulation of type III collagen in the deep dermal layer of hypertrophic scars. Non-hypertrophic scars were shown to have significantly less type III collagen when compared to hypertrophic scars at the same time points. No differences have been found regarding type I collagen expression in hypertrophic scars. Increased type III collagen in hypertrophic scars has been reported long ago (20, 21). The collagen produced in response to an injury of human skin has been considered to show characteristics of embryonic or fetal skin. In nonhypertrophic healing, maturation of scars occurred over time, including changes in the degree of cross-linking, while hypertrophic scars were thought to retain the characteristics of embryonic collagen (20). During wound repair, collagen type III is known to first enter the wound around day 2 to 3, followed by collagen type I around day 6 to 7 (22, 23). Indeed, in this study we observed that collagen type III, as well as collagen type I, are present in acute scars. Collagen synthesis reaches its peak at about 6 months after injury, starting to decline to a normal turnover rate 2 to 3 years after wounding (24–27). We have not found, in this investigation, a decrease in the amount of collagen protein in scars at 18–24 months after burn when compared to scars at earlier time points. Although synthesis and catabolism may be in balance, an excess of collagen remains.
An increased need for objective data has been noted in studies that aim to quantify scar response to different treatments, as opposed to the customary rating by clinical observers (4). Since the Vancouver Scale was created in 1990 (6), many attempts have been made to improve the scoring system, adding objectivity to scale parameters (5, 7, 8, 18, 28, 29). Investigations on the cellular and molecular aspects of scars have tried to establish criteria that would help to differentiate hypertrophic and non-hypertrophic scars, but the findings of these studies have been somewhat contradictory. While K ZHANG et al., 1995, found increased types I or III collagens in hypertrophic scars and keloids (10), LQ ZHANG et al., 1995, showed hypertrophic scars to have a decrease in the expression of these same collagens (11). This apparent disparity may occur due to technical limitations regarding the methods that have been used to evaluate extracellular matrix proteins, particularly collagen (11). Gene expression has been usually evaluated by means of Polymerase Chain Reaction (PCR) or more recently, using Microarrays (30, 31). However, increased gene expression has often been presumed to be associated with increased deposition of protein/growth factors in a particular tissue, what may not always be true (30). Tissue regulatory mechanisms may also account for decreased or increased gene expression in scars, depending upon the phase of scar evolution and phenotype (32). The turnover of collagen may be increased in excessive scar tissue (13, 25) and posttranscriptional mechanisms may operate to decrease the effects of elevated levels of mRNA or to reduce collagen synthesis (33, 34, 35). Techniques that allow protein localization, such as immunoperoxidase histochemistry, are not considered reliable methods regarding protein quantification. This problem arises in part from the nonlinear relation between the amount of reaction product and the amount of antigen. Although conventional immunofluorescence does allow protein quantification by using specific software programs for fluorescence analysis, changes in tissue thickness among samples can cause errors in the resulting fluorescence measurement (37, 38). In this case, the final fluorescence image results from light reflected throughout the whole thickness of the labeled tissue, with light coming from above and beneath the focal plane being collected by the objective lens and contributing to a blurry image (37, 38). However, recent improvement in this area has been achieved with the use of confocal microscopes, which have been designed with a pinhole that rejects the out of focus information of fluorescence samples (37, 38). Because this advantage allows for an accurate quantification of the relative amounts of protein via immunofluorescence in small samples of tissue, we have chosen this technique to evaluate collagen expression in this investigation. In addition to describing the time related changes in two major dermal collagens in hypertrophic and non-hypertrophic scars, we believe that this study contributes a novel technique to help evaluate extracellular matrix protein expression using small cutaneous samples of limited availability.
Acknowledgments
This study was supported by The National Institute on Disability and Rehabilitation Research (NIDRR) Grant #H133A970019 and by the National Institutes of Health (NIH) Grant #60338. Images were captured using the Confocal Laser Scanning Microscope at the Optical Imaging Core Facility at UTMB, with the invaluable help of Eugene Knutson, under the supervision of Dr. Thomas Albrecht.
Footnotes
This study was performed at the Shriners Burns Hospital and the University of Texas Medical Branch, Galveston, Texas 77550, USA
References
- 1.English RS, Shenefelt PD. Keloids and hypertrophic scars. Dermatol Surg. 1999;25(8):631–8. doi: 10.1046/j.1524-4725.1999.98257.x. [DOI] [PubMed] [Google Scholar]
- 2.Berman B, Bieley HC. Adjunct therapies to surgical management of keloids. Dermatol Surg. 1996;22(2):126–30. doi: 10.1111/j.1524-4725.1996.tb00493.x. [DOI] [PubMed] [Google Scholar]
- 3.Sawada Y, Sone K. Hydration and occlusion treatment for hypertrophic scars and keloids. Br J Plast Surg. 1992;45(8):599–603. doi: 10.1016/0007-1226(92)90027-u. [DOI] [PubMed] [Google Scholar]
- 4.Oliveira GV, Nunes TA, Magna LA, Cintra ML, Kitten GT, Zarpellon S, Raposo Do Amaral CM. Silicone versus nonsilicone gel dressings: a controlled trial. Dermatol Surg. 2001;27(8):721–6. doi: 10.1046/j.1524-4725.2001.00345.x. [DOI] [PubMed] [Google Scholar]
- 5.Sullivan T, Smith J, McIver E, et al. Rating the burn scar. J Burn Care Rehabil. 1990;11(3):256–60. doi: 10.1097/00004630-199005000-00014. [DOI] [PubMed] [Google Scholar]
- 6.Baryza MJ, Baryza GA. The Vancouver Scar Scale: an administration tool and its interrater reliability. J Burn Care Rehabil. 1995;16:535–8. doi: 10.1097/00004630-199509000-00013. [DOI] [PubMed] [Google Scholar]
- 7.Yeong EK, Mann R, Engrav LH, Goldberg M, Cain V, Costa B, Moore M, Nakamura D, Lee J. Improved burn scar assessment with use of a new scarrating scale. J Burn Care Rehabil. 1997;18(4):353–5. doi: 10.1097/00004630-199707000-00014. [DOI] [PubMed] [Google Scholar]
- 8.Crowe JM, Simpson K, Johnson W, Allen J. Reliability of photographic analysis in determining change in scar appearance. J Burn Care Rehabil. 1998;19(2):183–6. doi: 10.1097/00004630-199803000-00019. [DOI] [PubMed] [Google Scholar]
- 9.Niessen FB, Spauwen PHM, Schalkwijk J, Kon M. On the Nature of Hypertrophic Scars and Keloids: A Review. Plast Reconstr Surg. 1999;104(5):1435–58. doi: 10.1097/00006534-199910000-00031. [DOI] [PubMed] [Google Scholar]
- 10.Zhang K, Garner W, Cohen L, Rodriguez J, Phan S. Increased types I and III collagen and transforming growth factor-beta 1 mRNA and protein in hypertrophic burn scar. J Invest Dermatol. 1995 May;104(5):750–4. doi: 10.1111/1523-1747.ep12606979. [DOI] [PubMed] [Google Scholar]
- 11.Zhang LQ, Laato M, Muona P, Penttinen R, Oikarinen A, Peltonen J. A fibroblast cell line cultured from a hypertrophic scar displays selective downregulation of collagen gene expression: barely detectable messenger RNA levels of the pro alpha 1(III) chain of type III collagen. Arch Dermatol Res. 1995;287(6):534–8. doi: 10.1007/BF00374072. [DOI] [PubMed] [Google Scholar]
- 12.Friedman DW, Boyd CD, Mackenzie JW, Norton P, Olson RM, Deak SB. Regulation of collagen gene expression in keloids and hypertrophic scars. J Surg Res. 1993;55:214. doi: 10.1006/jsre.1993.1132. [DOI] [PubMed] [Google Scholar]
- 13.Lee KS, Song JY, Suh MH. Collagen mRNA expression detected by in situ hybridization in keloid tissue. J Dermatol Sci. 1991;2:316. doi: 10.1016/0923-1811(91)90056-4. [DOI] [PubMed] [Google Scholar]
- 14.Uitto J, Perejda AJ, Abergel RP, Chu ML, Ramirez F. Altered steady-state ratio of type I/III procollagen mRNAs correlates with selectively increased type I procollagen biosynthesis in cultured keloid fibroblasts. Proc Natl Acad Sci USA. 1985;82:5935. doi: 10.1073/pnas.82.17.5935. [DOI] [PMC free article] [PubMed] [Google Scholar]
- 15.Bailey AJ, Bazin S, Sims TJ, Le Lous M, Nicoletis C, Delaunay A. Characterization of the collagen of human hypertrophic and normal scars. Biochim Biophys Acta. 1975;405:412. doi: 10.1016/0005-2795(75)90106-3. [DOI] [PubMed] [Google Scholar]
- 16.Weber L, Meigel WN, Spier W. Collagen polymorphism in pathologic human scars. Arch Dermatol Res. 1978;261:63. doi: 10.1007/BF00455376. [DOI] [PubMed] [Google Scholar]
- 17.Di Cesare PE, Cheung DT, Perelman N, Libaw E, Peng L, Nimni ME. Alteration of collagen composition and cross-linking in keloid tissues. Matrix. 1990;10:172. doi: 10.1016/s0934-8832(11)80166-6. [DOI] [PubMed] [Google Scholar]
- 18.Oliveira GV, Chinkes D, Mitchell C, Oliveras G, Hawkins HK, Herndon DN. Objective assessment of burn scar vascularity, erythema, pliability, thickness, and planimetry. Dermatol Surg. 2005 Jan;31(1):48–58. doi: 10.1111/j.1524-4725.2005.31004. [DOI] [PubMed] [Google Scholar]
- 19.Kitzis V, Engrav LH, Quinn LS. Transient exposure to tumor necrosis factor alpha inhibits collagen accumulation by cultured hypertrophic scar fibroblasts. J Surg Res. 1999 Nov;87(1):134–41. doi: 10.1006/jsre.1999.5747. [DOI] [PubMed] [Google Scholar]
- 20.Bailey AJ, Bazin S, Sims TJ, Le Lous M, Nicoletis C, Delaunay A. Characterization of the collagen of human hypertrophic and normal scars. Biochim Biophys Acta. 1975 Oct 20;405(2):412–21. doi: 10.1016/0005-2795(75)90106-3. [DOI] [PubMed] [Google Scholar]
- 21.Kischer CW, Shetlar MR, Chvapil M. Hypertrophic scars and keloids: a review and new concept concerning their origin. Scan Electron Microsc. 1982;(Pt 4):1699–713. [PubMed] [Google Scholar]
- 22.Diegelmann RF, Rothkopf LC, Cohen IK. Measurement of collagen biosynthesis during wound healing. J Surg Res. 1975;19:239. doi: 10.1016/0022-4804(75)90087-6. [DOI] [PubMed] [Google Scholar]
- 23.Betz P, Nerlich A, Wilske J, et al. The time-dependent rearrangement of the epithelial basement membrane in human skin wounds-immunohistochemical localization of collagen IV and VII. Int J Legal Med. 1992;105:93. doi: 10.1007/BF02340831. [DOI] [PubMed] [Google Scholar]
- 24.Muir IF. On the nature of keloid and hypertrophic scars. Br J Plast Surg. 1990;43:61. doi: 10.1016/0007-1226(90)90046-3. [DOI] [PubMed] [Google Scholar]
- 25.Abergel RP, Pizzurro D, Meeker CA, et al. Biochemical composition of the connective tissue in keloids and analysis of collagen metabolism in keloid fibroblast cultures. J Invest Dermatol. 1985;84:384. doi: 10.1111/1523-1747.ep12265471. [DOI] [PubMed] [Google Scholar]
- 26.Craig RD, Schofield JD, Jackson DS. Collagen biosynthesis in normal and hypertrophic scars and keloid as a function of the duration of the scar. Br J Surg. 1975;62:741. doi: 10.1002/bjs.1800620917. [DOI] [PubMed] [Google Scholar]
- 27.Craig RD. Collagen biosynthesis in normal human skin, normal and hypertrophic scar and keloid. Eur J Clin Invest. 1975;5:69. doi: 10.1111/j.1365-2362.1975.tb00430.x. [DOI] [PubMed] [Google Scholar]
- 28.Oliveira GV, Sanford AP, Murphy KD, de Oliveira HM, Wilkins JP, Wu X, Hawkins HH, Chinkes DL, Barrow RE, Herndon DN. Growth hormone effects on hypertrophic scar formation: A randomized controlled trial of 62 burned children. Wound Repair Regen. 2004;12(4):404–11. doi: 10.1111/j.1067-1927.2004.012407.x. [DOI] [PubMed] [Google Scholar]
- 29.Brown NJ, Smyth EAE, Cross SS, Read MW. Angiogenesis induction and regression in human surgical wounds. Wound Repair Regen. 2002;10(4):245–51. doi: 10.1046/j.1524-475x.2002.10408.x. [DOI] [PubMed] [Google Scholar]
- 30.Vannay A, Fekete A, Adori C, Toth T, Losonczy G, Laszlo L, Vasarhelyi B, Tulassay T, Szabo A. Divergence of renal vascular endothelial growth factor mRNA expression and protein level in post-ischaemic rat kidneys. Exp Physiol. 2004;89(4):435–44. doi: 10.1113/expphysiol.2004.027516. Epub 2004 May 06. [DOI] [PubMed] [Google Scholar]
- 31.Tsou R, Cole JK, Nathens AB, Isik FF, Heimbach DM, Engrav LH, Gibran NS. Analysis of hypertrophic and normal scar gene expression with cDNA microarrays. J Burn Care Rehabil. 2000;21(6):541–50. doi: 10.1097/00004630-200021060-00012. [DOI] [PubMed] [Google Scholar]
- 32.Gallant CL, Olson ME, Hart DA. Molecular histologic and gross phenotype of skin wound healing in red Duroc pigs reveals an abnormal healing phenotype of hypercontracted hyperpigmented scarring. Wound Repair Regen. 2004;12(3):305–19. doi: 10.1111/j.1067-1927.2004.012311.x. [DOI] [PubMed] [Google Scholar]
- 33.Lee KS, Song JY, Suh MH. Collagen mRNA expression detected by in situ hybridization in keloid tissue. J Dermatol Sci. 1991;2:316. doi: 10.1016/0923-1811(91)90056-4. [DOI] [PubMed] [Google Scholar]
- 34.Friedman DW, Boyd CD, Mackenzie JW, Norton P, Olson RM, Deak SB. Regulation of collagen gene expression in keloids and hypertrophic scars. J Surg Res. 1993;55:214. doi: 10.1006/jsre.1993.1132. [DOI] [PubMed] [Google Scholar]
- 35.Sollberg S, Peltonen J, Uitto J. Combined use of in situ hybridization and unlabeled antibody peroxidase anti-peroxidase methods: Simultaneous detection of type I procollagen mRNAs and factor VIII-related antigen epitopes in keloid tissue. Lab Invest. 1991;64:125. [PubMed] [Google Scholar]
- 36.Lim IJ, Phan TT, Tan EK, Nguyen TT, Tran E, Longaker MT, Song C, Lee ST, Huynh HT. Synchronous activation of ERK and phosphatidylinositol 3-kinase pathways is required for collagen extracellular matrix production in keloids. J Biol Chem. 2003;17;278(42):40851–8. doi: 10.1074/jbc.M305759200. Epub 2003 Aug 07. [DOI] [PubMed] [Google Scholar]
- 37.Buttino I, Ianora A, Carotenuto Y, Zupo V, Miralto A. Use of the confocal laser scanning microscope in studies on the developmental biology of marine crustaceans. Microsc Res Tech. 2003;1;60(4):458–64. doi: 10.1002/jemt.10284. [DOI] [PubMed] [Google Scholar]
- 38.Diaspro A, Federici F, Robello M. Influence of refractive-index mismatch in high resolution three-dimensional confocal microscopy. Appl Opt. 2002;1;41(4):685–90. doi: 10.1364/ao.41.000685. [DOI] [PubMed] [Google Scholar]