Abstract
The functional interactions between neurons and glial cells that are important for nervous system function are presumably established during development from the activity of progenitor cells. In this study we examined proliferation of progenitor cells in the medial nucleus of the trapezoid body (MNTB) located in the rat auditory brainstem. We performed DNA synthesis labeling experiments to demonstrate changes in cell proliferation activity during postnatal stages of development. An increase in cell proliferation correlated with MNTB growth and the presence of S100β-positive astrocytes among MNTB neurons. In additional experiments we analyzed the fate of newly born cells. At perinatal ages, newly born cells colabeled with the astrocyte marker S100β in higher numbers than when cells were generated at postnatal day 6. Furthermore, we identified newly born cells that were colabeled with caspase-3 immunohistochemistry and performed comparative experiments to demonstrate that there is a natural decrease in cell proliferation activity during postnatal development in rats, mice, gerbils, and ferrets. Lastly, we found that there is a stronger decrease in MNTB cell proliferation after performing bilateral lesions of the auditory periphery in rats. Altogether, these results identify important stages in the development of astrocytes in the MNTB and provide evidence that the proliferative activity of the progenitor cells is developmentally regulated. We propose that the developmental reduction in cell proliferation may reflect coordinated signaling between the auditory brainstem and the auditory periphery.
INDEXING TERMS: auditory brainstem, apoptosis, glia, hearing onset, S100β
In the central nervous system (CNS), bidirectional communication between neurons and glial cells is involved in normal and pathological function (Murai and van Meyel, 2007; Rosi and Volterra, 2009). Presumably, neuron–glial cell interactions are established during development, most likely during the late embryonic and early postnatal stages when neural progenitor cells begin their transition to neurons and glial cells, neurons form synaptic circuits, and glial cells establish functional links with neurons (Bayer, 1989; Morest and Silver, 2003). The main goal of this study was to analyze proliferation of progenitor cells in the medial nucleus of the trapezoid body (MNTB) in the mammalian auditory brainstem during postnatal development.
The MNTB has been used as a system to study the mechanisms of synaptic transmission during development and sensory processing (Hoffpauir et al., 2010; Nakamura and Cramer, 2011; Borst and Soria van Hoeve, 2012). In rodents, the MNTB is predominately composed of principal neurons that receive giant glutamatergic connections known as the calyx of Held synapses from bushy cells in the contralateral anteroventral cochlear nucleus (von Gersdorff and Borst, 2002; Schneggenburger and Forsythe, 2006). However, very little is known about the origin, development, and diversity of different glial cell populations in the MNTB.
In this study we analyzed cell proliferation in the MNTB of Wistar rat pups during postnatal development, including how it relates to gliogenesis, apoptosis, and hearing development. To test the hypothesis that changes in auditory brainstem cell proliferation are linked to hearing development, we compared the pattern of postnatal cell proliferation in the rat MNTB with mice, gerbils, and ferrets. In these species, opening of the ear canal and hearing onset occur postnatally at different ages (postnatal day [P]13 for Wistar rats, Crins et al., 2011; our unpublished results; P12 for CBA/CaJ mice, Sonntag et al., 2009; P12 for gerbils, Woolf and Ryan, 1984; McGuirt et al., 1995; McFadden et al., 1996; P28 for ferrets, Moore and Hine, 1992). We performed further lesion experiments in rats with the goal to disrupt activity related signals in the auditory system and to examine their effects on cell proliferation in the MNTB.
MATERIALS AND METHODS
Animals
All experimental procedures regarding the use of animals were reviewed and approved by the Institutional Animal Care and Use Committee of the City College of New York, which conform to National Institutes of Health guidelines for the use of animals in research. Timed-pregnant Wistar or Mongolian gerbil dams (Charles River, Wilmington, MA) were received at the animal care facility at gestation day (E) 12 or E15. The day of birth was defined as P0. Breeding pairs of CBA/CaJ mice were obtained from the Jackson Laboratory (Bar Harbor, ME) and bred at the animal facility of City College. A pregnant ferret dam (Mustela putorius furo) was obtained from Marshal Farms (North Rose, NY) and maintained at the animal facility until pups were born. After birth, pups were reared with their mother with free access to food and water.
EdU staining
Thymidine analog 5-ethynyl-2′-deoxyuridine (EdU; Invitrogen, Eugene, OR) was used as a marker of cell proliferation. This method was chosen over other methods such as bromodeoxyuridine (BrdU) or H3-thymidine because EdU can be directly labeled with a fluorescent azide. This reduces false-positive labeling and facilitates multilabeling experiments in combination with immunohistochemistry (Breunig et al., 2007; Salic and Mitchison, 2008). Pregnant dams or individual pups received a single intraperitoneal injection of EdU at 160 μg per gram of body weight. As described below, labeling was examined at different times after EdU injection.
Animals were overdosed with an anesthetic and perfused acutely after 2 hours, or at 3 or 7 days after EdU injection with a fixative solution containing 4% paraformaldehyde in 0.1 M phosphate buffer (PB). Whole brains were postfixed for 24 hours and placed in 30% sucrose in PB prior to slicing. Brainstem slices were obtained using a freezing stage microtome (American Optical, Buffalo, NY) at 35 μm thickness. All slices containing the MNTB were identified by visual inspection using a Primos Star microscope (Carl Zeiss, North America). A slice series containing the MNTB was separated into three or four sets containing an equal number of sections and stored in PB for up to 24 hours at 4°C. EdU staining was conducted using the Click-iT EdU imaging kit (Invitrogen) according to manufacturer’s instructions. In some experiments, brain slices were immediately mounted with 0.3% gelatin onto glass slides and dried before adding Prolong GOLD mounting medium with DAPI (to counterstain cell nuclei; Invitrogen). In other experiments, brain slices were used for immunohistochemistry.
Immunohistochemistry
The protocol for immunohistochemistry has been described previously (Rodríguez-Contreras et al., 2006, 2008). As in other regions of the CNS, astrocytes can be identified by the expression of specific cell markers such as the calcium-binding protein S100β and the cytoskeletal protein glial fibrillary acidic protein (GFAP; Ford et al., 2009; Reyes-Haro et al., 2010). Therefore, the following primary antibodies were used (see Table 1): rabbit anti-S100β (Immunostar, Hudson, WI); chicken anti-GFAP (Abcam, Cambridge, MA); mouse anti-NeuN, mouse anti-myelin basic protein (MBP; Millipore, Temecula, CA); and rabbit anti-cleaved caspase-3 (Cell Signaling Technology, Beverly, MA). EdU-stained brain slices were incubated for at least 48 hours at 4°C with the primary antibodies, rinsed twice for 5 minutes in a wash solution, followed by another incubation with fluorescently labeled secondary antibodies (2 mg/ml) for 24–48 hours at 4°C. Goat antirabbit Alexa Fluor 594, and goat antimouse Alexa Fluor 647 were used as secondary antibodies (Invitrogen). Brain slices were washed four times before being mounted onto glass slides and counterstained with DAPI.
TABLE 1.
Antibodies Used as General Markers in This Study
| Antibody | Immunogen | Manufacturer |
|---|---|---|
| Caspase-3 | Synthetic peptide (KLH-coupled) corresponding to amino terminal residues adjacent to (Asp175) in human caspase-3: CRGTELDCGIETD* | Cell Signaling Technology; Cat. No. 9661; rabbit polyclonal. |
| GFAP | Full-length protein purified from cow myelin associated material. Uniprot accession P14136. | Abcam; Cat. No. ab4674; chicken polyclonal. |
| MBP | Epitope 129–138 present in human, bovine and rat sequence. | Millipore; Cat. No. MAB382; mouse monoclonal. |
| NeuN | Neuron nuclei. | Millipore; Cat. No. MAB377; mouse monoclonal. |
| S100β | Full protein from bovine brain | Immunostar; Cat. No 22520; rabbit polyclonal |
The information contained in this document is intended for the sole use of the recipient. Cell Signaling Technology, Inc. recognizes that knowledge of some proprietary information may be necessary for full understanding of the scientific question at hand. In the interest of advancement of scientific study the information is provided with the honorable stipulations listed. The recipient agrees that this information will not be published, shared with individuals outside of his or her immediate research group and will not be used for production or purification of antibodies.
Antibody characterization
All the antibodies used in this study showed an appropriate pattern of cellular morphology and distribution as general markers of neurons, glial, and apoptotic cells.
For caspase-3, a polyclonal rabbit antiserum (Cell Signaling Technology; Cat. No. 9661; 1:500) raised against a synthetic peptide (KLH-coupled) corresponding to amino terminal residues adjacent to (Asp175) in human caspase-3 was used. This antibody does not recognize full-length caspase-3 or other cleaved caspases (manufacturer’s technical information). The antiserum stains two bands at 17 and 19 kDa molecular weight on western blot of HeLa, NIH/3T3, and C6 cell extracts treated with cytochrome c to induce caspase-3 cleavage (manufacturer’s technical information; Sánchez-Gómez et al., 2003; Rodríguez-Contreras et al., 2006).
For GFAP a polyclonal chicken antiserum (Abcam, Cat. No. ab4674, 1:50) raised against full-length protein purified from cow myelin associated material was used. The antiserum stains transfected cultured cells that express GFAP and brain sections (manufacturer’s technical information).
For MBP a monoclonal mouse antiserum (Millipore, Cat. No. MAB382, 1:50) against epitope 129–138 present in human, bovine, and rat MBP was used, characterized by enzyme immunoassay (Groome et al., 1985) and evaluated with immunohistochemistry on brain tissue (Jarjour et al., 2008).
For NeuN a monoclonal mouse antiserum against a nuclear protein present in most CNS neurons was used (Millipore, Cat. No. MAB377, 1:500). Specificity was tested with western blots in which 2–3 bands in the 46–48 kDa range and possibly another band at 66 kDa were observed (manufacturer’s technical information). A similar pattern of staining was observed previously (Rodríguez-Contreras et al., 2006).
For S100β a polyclonal rabbit antiserum (Immunostar, Cat. No. 22520, 1:500) against purified bovine brain S100β was used. A similar cellular staining pattern was observed in gerbils with a different antibody (Ford et al., 2009).
Imaging, analysis of cell density, and colocalization
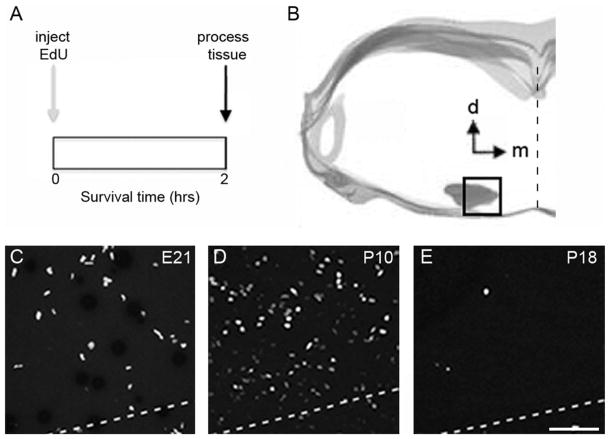
In order to avoid potential regional differences in maturation, the medial portion of the MNTB was selected for analysis (Fig. 3B; Rodríguez-Contreras et al., 2008; Ford et al., 2009). A 40×/NA1.4 oil lens attached to an LSM510 confocal microscope (Carl Zeiss) was used to acquire z-stacks of 8-bit, 512 × 512 pixel images. Image stacks (x, y, z voxel of 0.58, 0.58, 1.13 mm) were imported into Volocity (Perkin Elmer, Waltham, MA) for analysis using available image-segmentation and colocalization routines (Rodríguez-Contreras et al., 2005, 2008). Cell density estimates were corrected to exclude cells touching the borders of the image in x, y, and z planes, and to take into account differences in z-stack volume. Cell density values were reported in cells/mm3. Brightness and contrast modifications were performed in Volocity or in Adobe Photoshop (San Jose, CA) during the preparation of figures.
Figure 3.
Evidence of cell proliferation in the rat MNTB during postnatal development. A: Experiment design for acute EdU labeling experiments. Rat pups were sacrificed and their brains processed for histological analysis 2 hours after EdU injection (see Materials and Methods). B: Digital tracing outlines the brainstem area used to analyze the density of EdU-labeled cells in coronal sections containing the MNTB. C–E: Exemplar micrographs of EdU-labeled cells at different ages. The dashed line indicates the ventral border of the MNTB. EdU, 5-ethynyl-2′-deoxyuridine; d, dorsal; m, medial; E21, embryonic day 21; P, postnatal day. Scale bar = 75 μm in E (applies to C,D).
Auditory periphery lesions
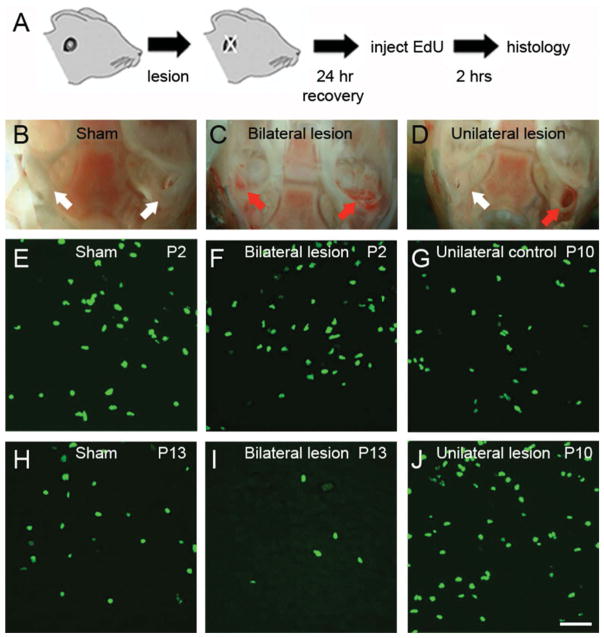
Sham and experimental animals were anesthetized with isoflurane as described above and the auditory meatus was cut to expose the middle ear cavity (bulla). For sham surgeries, the patch of skin was glued back with Vetbond (3M Health Care, St Paul, MN) while leaving the bulla intact, and covered with antibacterial ointment (3M Health Care) to prevent infections. For experimental animals receiving bilateral or unilateral lesions, a small hole was made through the bulla using an ultrasonic cleanser device with a 1-mm tip (Dental Depot, Fort Lauderdale, FL), exposing the middle turn of the cochlea in order to make a second hole through the bone. A small piece of absorbing material was used to clean the lesion site and a piece of gel foam was left in place. The skin covering the auditory meatus was placed back, glued with Vetbond, and covered with antibacterial ointment. Pups with unilateral lesions exhibited circling behavior when placed on an open field. Circling behavior was not always observed in bilateral lesioned pups, presumably because lesions affected both sets of semicircular canals. The extent of bilateral and unilateral cochlear damage was verified before processing rat brains for EdU analysis. As criteria for inclusion in the study we used direct confirmation of damage to the middle ear cavity (which between ages P0–P14 contains mesenchyme and receives vascular supply) and the presence of hemorrhaging inside the inner ear (Fig. 12). Sham animals were used as controls for bilateral lesions. The MNTB receiving input from the intact ear was used as a control for unilateral lesions.
Figure 12.
Bilateral ear lesions affect cell proliferation in the rat MNTB. A: Experiment design. Ear lesions were performed as described in Materials and Methods and proliferating cells were labeled with EdU histochemistry after a recovery period of 24 hours. B–D: Exemplar images show the extent of damage in the inner ear of sham (B), bilateral lesion (C), and unilateral lesion animals (D). White arrows indicate intact inner ear. Red arrows indicate lesioned inner ear. E–J: Exemplar images of EdU stained brainstem slices from sham (E,H), bilateral lesion (F,I), and unilateral lesion experiments (G,J). The unlesioned side was used as a control for unilateral lesions. Scale bar = 50 μm in J (applies to E–I).
Analysis and statistics
Datasets were analyzed using Igor Pro 6.04 (Wavemetrics, Lake Oswego, OR). A fit to Eq. (1) was performed for two phases of the data shown in Figure 4B: from E19 to P10 (exponential increase phase), and from P10 to P31 (exponential decrease phase):
| (1) |
where τ is the exponential time constant, y0 and A are fit coefficients, and x0 is a constant.
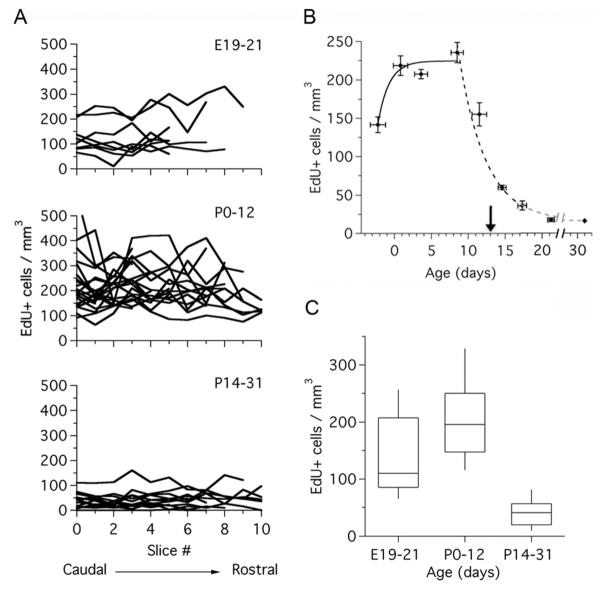
Figure 4.
Developmental changes in cell proliferation in the rat MNTB. A: Density of EdU-labeled cells in the MNTB of rats in three different age groups: E19–21 (n = 8 rats), P0–12 (n = 21 rats), and P14–31 (n = 14 rats). Black lines represent samples from individual animals. Datasets represent brain section samples from caudal to rostral MNTB. B: Density of EdU-labeled cells during postnatal development (data from A is grouped in 3-day bins; n = 43 rats). The continuous line represents the fit to an exponential function with τ = 1.5 days. The dashed line represents the fit to an exponential function with τ = 3.7 days. Arrow indicates the onset of hearing at P13. C: Boxplots of EdU-labeled cell density in three different age groups, replotted from (A) (Kruskal–Wallis test, P < 0.0001). Dataset in (B) represents mean ± SEM for cell density, and mean ± SD for age. τ, time constant.
The percent of EdU-labeled cells remaining after hearing onset shown in Figure 11D was determined with Eq. (2):
| (2) |
where B is the mean EdU cell density after hearing onset and A is the mean EdU cell density before hearing onset. Hearing onset was defined as the earliest age at which auditory responses with thresholds lower than 80 dB were recorded in each species (P13 for Wistar rats, our unpublished results; P12 for CBA/CaJ mice, Sonntag et al., 2009; P12 for gerbils, Woolf and Ryan, 1984; McGuirt et al., 1995; McFadden et al., 1996; P28 for ferrets, Moore and Hine, 1992). This functional definition is correlated with opening of the ear canal, a major milestone in auditory periphery development (Moore and Hine, 1992).
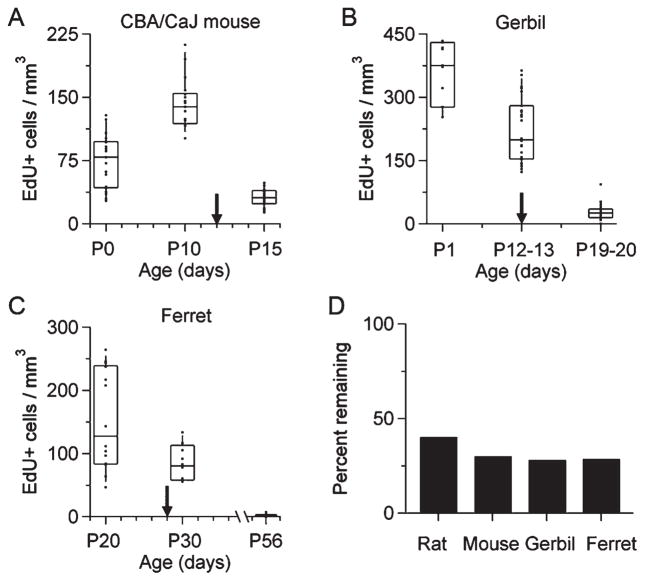
Figure 11.
Evidence of developmental regulation of cell proliferation in the MNTB of rodents and a carnivore. A: Density of EdU-labeled cells in the MNTB of the CBA/CaJ mouse at different ages (Kruskal–Wallis test, P < 0.0001). B: Density of EdU-labeled cells in the MNTB of the Mongolian gerbil at different ages (Kruskal–Wallis test, P < 0.0001). C: Density of EdU-labeled cells in the MNTB of the ferret at different ages (Kruskal–Wallis test, P < 0.0001). Arrows indicate hearing onset for each species (P12 in CBA/CaJ mice, P12 in gerbils, and P28 in ferrets). D: Bar plot of the percent of EdU-labeled cells remaining after hearing onset. Equation (2) was used for the calculations (see Materials and Methods). Data from P12–P13 was not included in the calculation for gerbils.
Statistical analysis was performed using Prism 6 (GraphPad Software, La Jolla, CA). Datasets were tested for normality using the D’Agostino and Pearson omnibus K2 test (D’Agostino, 1986). For statistical comparison in Figures 10 and 13, the unpaired two-tailed t-test with Welch’s correction was used. For multiple comparisons in Figures 4C, 8D, and 11A–C, the Kruskal–Wallis test was used. Multiple t-tests with correction using the Holm-Sidak method with alpha = 5% (without assuming a consistent SD) were applied to data in Figure 13. Significance criterion was P < 0.05.
Figure 10.
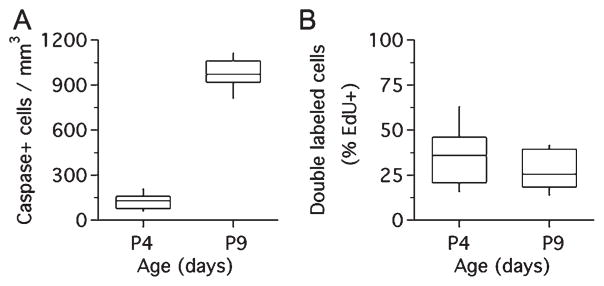
Developmental increase in the density of caspase-labeled cells does not result in an increase of double-labeled EdU/caspase cells in the rat MNTB. A: Density of caspase-3-labeled cells increased between P4 and P9 (unpaired two-tailed t-test, P < 0.0001). B: No change in double-labeled EdU/caspase-3 cells between P4 and P9 (expressed as percent of total EdU-labeled cells; unpaired two-tailed t-test, P = 0.1364).
Figure 13.
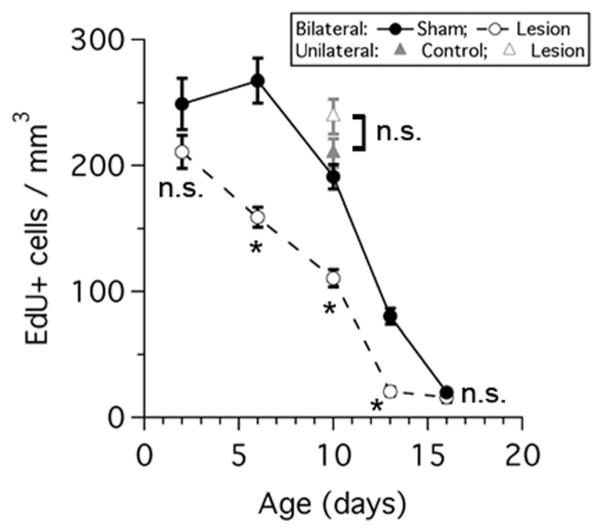
Auditory periphery lesions result in a decrease in cell proliferation in the rat MNTB. Graph shows the density of EdU-labeled cells in sham (black circles) and bilateral lesioned animals (white circles) at different postnatal ages. Note there is a reduction in cell density values between sham and lesion animals at P6, P10 and P13 (t-test with correction for multiple comparisons, *P < 0.0001). No difference between control (gray triangle) and unilateral lesion (white triangle) cell density values was detected (unpaired two-tailed t-test, P = 0.1219). n.s. = not significant.
Figure 8.
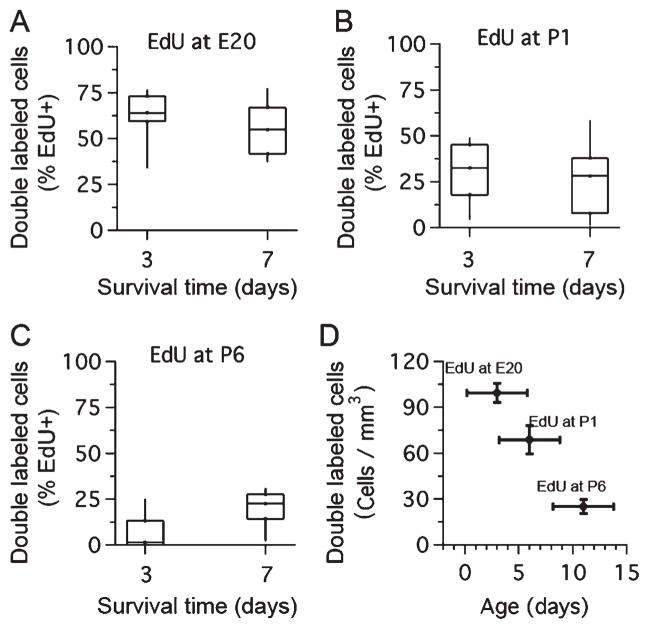
Differential S100β expression in newly born cells during development. A: Percent of EdU-labeled cells that were double-labeled with S100β immunohistochemistry at 3 and 7 days after EdU injection at E20. B: Percent of EdU-labeled cells that were double-labeled with S100β immunohistochemistry at three and seven days after EdU injection at P1. C: Percent of EdU-labeled cells that were double-labeled with S100β immunohistochemistry at 3 and 7 days after EdU injection at P6. D: Density of double-labeled EdU/S100β cells after EdU injection at different ages (EdU at E20, 6 rats, 34 brain slices; EdU at P1, 8 rats, 40 brain slices; EdU at P6, 5 rats, 61 brain slices; Kruskal–Wallis test, P < 0.0001). Dataset represents mean ± SEM for cell density and mean ± SD for age.
RESULTS
Evidence of cell proliferation activity in the rat MNTB during the stage of postnatal growth
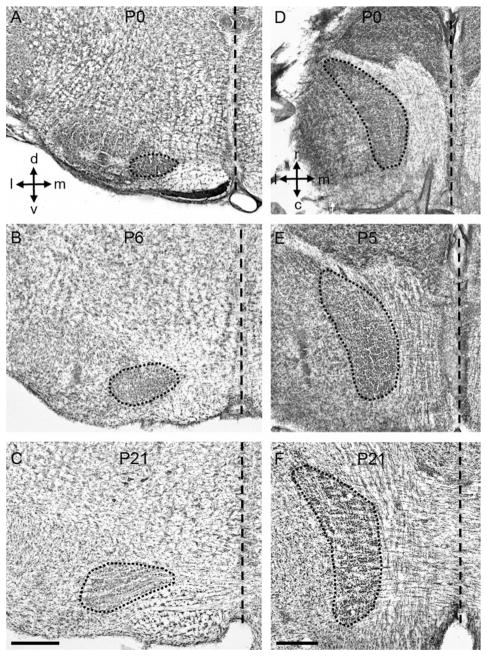
To measure the size of the MNTB we used Nissl-stained histological sections (Fig. 1; n = 47 rat pups). We found that the MNTB increased in size about 1.8-fold in both lateral to medial (LM), and dorsal to ventral (DV) dimensions, and that it increased in size around 2-fold along the rostral to caudal (RC) axis (Fig. 2). The largest size changes occurred during perinatal ages and were complete by P10, except for the RC changes, which continued past P15 (Fig. 2B). To examine cell proliferation in the MNTB, rat pups received acute injections of EdU (Fig. 3A; n = 43 rat pups). We observed systematic differences in the density of EdU-labeled cells in the MNTB of pups at different ages (Figs. 3C–E, 4). For example, at prenatal ages the density of EdU-labeled cells was low (mean, SD: 141, 78; range 10–331 cells/mm3; Fig. 4A, top), whereas between P0 and P12 the density of EdU-labeled cells increased (mean, SD: 206, 86; range 63–584 cells/mm3; Fig. 4A, middle). Between the ages of P14 and P31, there was a marked decrease in the density of EdU-labeled cells (mean, SD: 43, 31; range 0–161 cells/mm3; Fig. 4A, bottom).
Figure 1.
Anatomical changes in the rat MNTB during postnatal development. A–C: Nissl-stained coronal sections of the rat brainstem at different postnatal ages. D–F: Nissl-stained horizontal sections of the rat brainstem at different postnatal ages. The short-dashed outline represents the MNTB. The long-dashed line represents the midline. MNTB, medial nucleus of the trapezoid body; d, dorsal; v, ventral; l, lateral; m, medial; r, rostral; c, caudal. Scale bars = 500 μm in C (applies to A,B); in F (applies to D,E).
Figure 2.
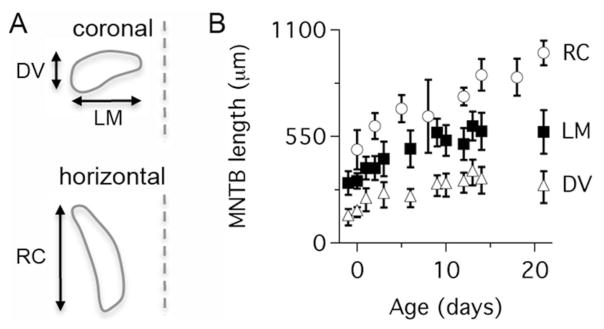
Growth of the rat MNTB during postnatal development. A: Cartoon showing the criteria used to measure the length of the MNTB in DV, LM, and RC axes. B: The length of the MNTB in DV, LM, and RC dimensions is shown as a function of postnatal age. Data represent mean ± SD (n = 47 rats). DV, dorsal to ventral; LM, lateral to medial; RC, rostral to caudal.
To further analyze changes in EdU labeling during postnatal development, we plotted data in Figure 4A in two different ways. First, we grouped cell density data into bins of 3-day duration. Using this time scale showed that the density of EdU-labeled cells increased exponentially during perinatal ages (time constant, τ = 1.4 days, continuous line in Fig. 4B), reached a plateau from about P2 until P12, and declined sharply between P12 and P15 to remain at low levels until P31 (τ = 4.9 days; dashed line in Fig. 4B). Using a second criterion, we pooled data according to three developmental stages, one embryonic and two postnatal groups defined with respect to the age of hearing onset (Fig. 4C; hearing onset in Wistar rats is indicated by an arrow in Fig. 4B). In this analysis, the density of EdU-labeled cells varied significantly between the different groups (Kruskal–Wallis test, P < 0.0001).
Putative progenitor cells are present in the rat MNTB during postnatal development
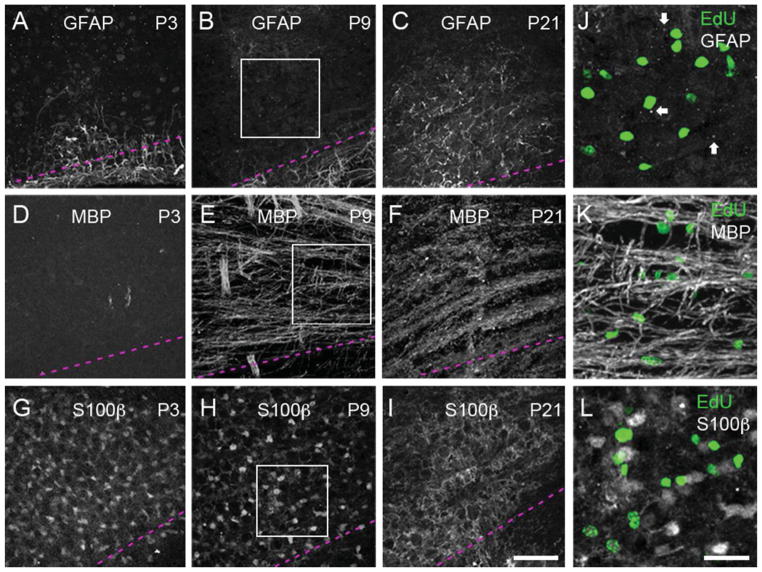
Figure 5 shows confocal micrographs of antibody-stained tissue using different neuroglial cell markers at ages P3, P9, and P21. We observed that S100β immunohistochemistry, used previously to label astrocytes in gerbil MNTB (Ford et al., 2009), stained cell bodies and processes of rat MNTB cells at P3 and P9, but only cell processes at P21 (Fig. 5G–I). Anti-GFAP and anti-MBP immunostaining revealed different labeling patterns. At P3 and P9 the anti-GFAP antibody labeled cellular processes localized on the ventral border of the brainstem (marked by dashed lines in Fig. 5A,B). In addition, there was a conspicuous staining pattern of small GFAP positive particles within the MNTB region (arrows in Fig. 5J). At P21, the small GFAP-positive particles were no longer present and labeling was observed only in cell processes throughout the MNTB (Fig. 5C). Lastly, anti-MBP immunostaining was absent at P3, but labeled a large number of putative axon fibers at P9 and P21, with qualitative differences in the staining pattern between these ages (Fig. 5D–F). As shown in Figure 5J–L, EdU-labeled cells did not show costaining with any of the neuroglial cell markers screened in these experiments.
Figure 5.
Developmental changes in glial cell marker labeling in the rat MNTB. Immunohistochemistry with anti-GFAP, -MBP, and -S100β antibodies at P3, P9, and P21 (3 pups per age, at least 4 slices per animal). The ventral side of the MNTB is outlined with dashed lines similar to Figure 3C. A,B: GFAP immunohistochemistry at P3 and P9 shows labeled cellular processes near the ventral surface of the brainstem. C: GFAP-labeled processes are present throughout the MNTB at P21. D: MBP immunohistochemistry does not show any labeling at P3. E: MBP immunohistochemistry shows labeled fibers at P9. F: The pattern of anti-MBP staining shows a more compact staining pattern compared to P9. G,H: Anti-S100β immunohistochemistry reveals a pattern of cell bodies and processes throughout the MNTB at P3 and P9. I: Anti-S100β immunohistochemistry labels only cell processes at P21. J–L: Zoom-in views of boxed areas at P9 (panels B,E,H), showing the distribution of EdU-labeled cells (green) with respect to each glial cell marker. Arrows in J indicate small GFAP-labeled particles in the MNTB. GFAP, glial acidic fibrillary protein; MBP, myelin basic protein. Scale bars = 75 μm in I (applies to A–H); 30 μm in L (applies to J,K).
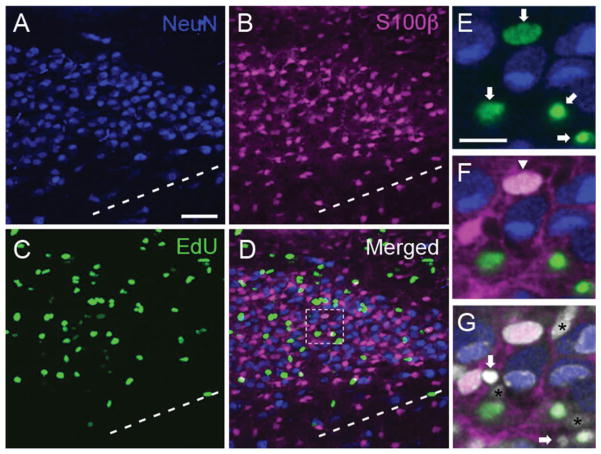
Based on the observation that S100β immunohistochemistry stained cell bodies in the MNTB during the period of postnatal growth, we performed additional multiple labeling experiments with a mix of neuronal (NeuN), astrocyte (S100β), and DNA synthesis (EdU) markers (Fig. 6). As shown in Figure 6E, EdU-labeled cells did not show colocalization with NeuN-labeled cells. There were very few examples of double-labeled EdU/S100β cells (arrowhead in Fig. 6F, 8 cells out of 843 EdU-labeled cells at P3 and 6 cells out of 1,467 EdU-labeled cells at P9), and several examples of cell nuclei that did not colocalize with the NeuN, S100β, or EdU markers (stained with DAPI and marked with asterisks in Fig. 6G), including cell nuclei with pyknotic morphology (white arrows in Fig. 6G). These data suggested that EdU-labeled cells could be glial cell progenitors.
Figure 6.
EdU labels putative cell progenitors in the MNTB. A–C: Representative z-stack projection from a P9 rat brain slice triple-stained with NeuN (blue, A), S100β (magenta, B), and EdU (green, C). D: The merged image shows little overlap between the different makers. Dashed line represents the ventral border of the MNTB. E: High-magnification view of a single optical slice from boxed region in (D) showing EdU (green, arrows) and NeuN (blue)-labeled cells. F: The same optical slice from E shows that S100β-labeled cells and their processes (magenta) intercalate between NeuN and EdU-labeled cells. There is one EdU/S100β double-labeled cell in this field of view (downward arrowhead; white shows colocalization). G: DAPI staining reveals several cell nuclei that are not stained by the NeuN, S100β or EdU markers (asterisks), including two DAPI-stained cell nuclei with pyknotic morphology (arrows). Scale bars = 50 μm in A (applies to B–D); 15 μm in E (applies to F,G).
Progenitor cells in the rat MNTB generate cells that express astrocyte and apoptosis markers
To analyze the fate of the putative progenitor cells in the MNTB, we performed 3- and 7-day survival EdU-labeling experiments. We determined the percent of EdU-labeled cells that were costained with the neuronal marker NeuN or the astrocyte marker S100β (Figs. (7 and 8); n = 19 rats). Similar to the findings in acute experiments, there was no evidence of any EdU-labeled cells costained with anti-NeuN antibody at any time-point tested, suggesting that newly born cells do not develop a neuronal phenotype. As a positive control EdU injections were administered to pregnant rats at a much earlier gestational age (E15), when neurogenesis in the rat MNTB is more prominent (Kudo et al., 2000). When double labeling was examined in rats at P15, it was confirmed that cells stained with EdU were positive for the neuronal marker NeuN (data not shown). In contrast, the experiments illustrated in Figure 7 showed several examples of double-labeled EdU/S100β cells at 3 and 7 days after EdU injection. Overall, ~59% of EdU-labeled cells were double-labeled with S100β when EdU was injected in embryos (Fig. 8A), about 30% of EdU-labeled cells were double-labeled with S100β when EdU was injected in neonates (Fig. 8B), and less than 10% of EdU-labeled cells were double-labeled with S100β when EdU was injected in older pups at P6 (Fig. 8C). Next, in a separate analysis, we grouped cell density estimates of double-labeled EdU/S100β cells from the 3- and 7-day survival experiments. This analysis showed a significant difference between the three age groups (Fig. 8D; Kruskal–Wallis test, P < 0.0001).
Figure 7.
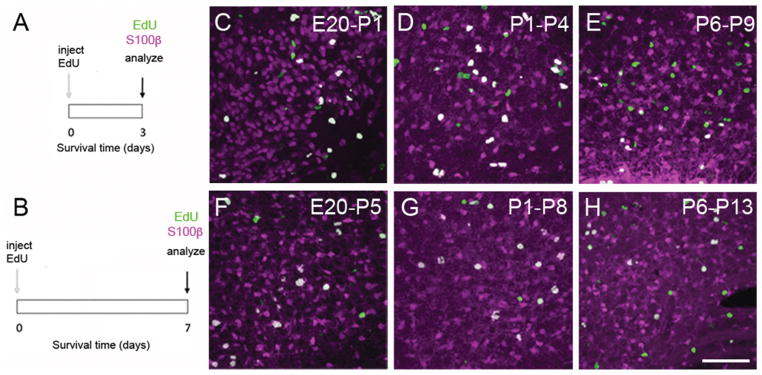
Evidence of S100β expression in EdU-labeled MNTB cells. A,B: Experiment design to examine the fate of newborn cells. EdU was injected in embryos (at E20), neonates (at P1), or infants (at P6) and animals survived for 3 or 7 days. At every endpoint brainstem slices were processed for multifluorescence labeling. C–E: Exemplar images demonstrate the presence of double-labeled EdU (green), and S100β (magenta) cells 3 days after EdU injection. F–H: Exemplar images demonstrate the presence of double-labeled EdU (green), and S100β (magenta) cells 7 days after EdU injection. White represents colocalization. Each panel indicates the age of EdU injection followed by the age of analysis. Scale bar = 80 μm in H (applies to C–G).
Based on the differences in double-stained EdU/S100β cells in the survival experiments described above, we next determined if cell proliferation was related to the expression of the apoptosis marker caspase-3 (Fig. 9). Using immunohistochemistry and a similar experiment design as in Figure 7A, we confirmed the presence of caspase-3-labeled cells in the rat MNTB (Fig. 9B–G; Rodríguez-Contreras et al., 2006). We found that the density of caspase-3-labeled cells increased from 124 (56) cells/mm3 at P4 to 973 (103) cells/mm3 at P9 (mean [SD]; Fig. 10A; unpaired two-tailed t-test, P < 0.0001), but that the percentage of EdU-labeled cells that were double-labeled with caspase-3 did not vary between those ages (Fig. 10B; unpaired two-tailed t-test, P = 0.1364).
Figure 9.
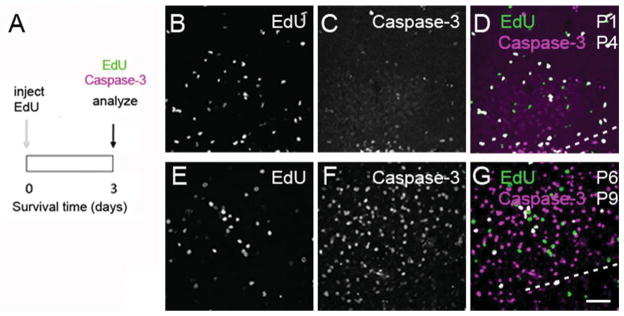
Evidence of caspase-3 expression in EdU-labeled cells in the rat MNTB. A: Experiment design to examine the fate of newborn cells. B–D: Exemplar images from double staining experiments with EdU histochemistry (green) and caspase-3 immunohistochemistry (magenta). EdU was injected at P1 and tissue analyzed at P4. E–G: Exemplar images from double staining experiments with EdU histochemistry (green) and caspase-3 immunohistochemistry (magenta). EdU was injected at P6 and tissue analyzed at P9. White indicates colocalization in (D,G). The ventral border of the MNTB is represented by dashed lines, similar to Figure 3C. Scale bar = 50 μm in G (applies to B–F).
Cell proliferation activity decreases during hearing development in different altricial mammals
We did a comparative study to analyze the density of EdU-labeled cells in the MNTB of mammals with distinct postnatal patterns of hearing development. In all cases, we found a significant difference in the density of EdU-labeled cells at different ages. For example, in CBA/CaJ mice the density of EdU-labeled cells (in cells/mm3) was 75 ± 32 at P0, 145 ± 31 at P10, and 31 ± 65 at P15 (mean ± SD; Fig. 11A, n = 2 pups per age; Kruskal–Wallis test, P < 0.0001); the density of EdU-labeled cells in gerbils was 362 ± 73 at P1, 260 ± 78 at P12, 192 ± 65 at P13, 23 ± 12 at P19, and 31 ± 19 at P20 (Fig. 11B, n = 2 pups per age; note that data from P12–13, and P19–20 are plotted together; Kruskal–Wallis test, P < 0.0001). Lastly the density of EdU-labeled cells in ferrets was 154 ± 78 at P20, 85 ± 28 at P30, and 3 ± 2 at P56 (Fig. 11C, n = 2 pups per age; Kruskal–Wallis test, P < 0.0001). Further comparison of the percent of EdU-labeled cells remaining after hearing onset showed a decrease in cell proliferation of more than 50% in rodents and ferrets (Fig. 11D).
Bilateral auditory periphery lesions reduce cell proliferation in the rat MNTB
Lastly, we determined whether lesions to the auditory periphery had any effect on cell proliferation in the MNTB of rats (Figs. (12 and 13); n = 20 rats). We found that bilateral ear lesions had a significant effect on EdU labeling compared to sham controls at P6, P10, and P13 (Fig. 13; multiple t-tests with correction, P < 0.0001) but not at P2 or P16 (Fig. 13; multiple t-tests with correction, n.s. = non significant). Next, we performed unilateral lesions at P9. The density of EdU-labeled cells was compared in the contralateral (lesion) versus ipsilateral (control) MNTB (n = 2 rats). There was a very modest, but not significant increase in the mean density of EdU-labeled cells in the contralateral lesion side (239 ± 14 cells/mm3) versus the ipsilateral control side (210 ± 12 cells/mm3, open square in Fig. 13; unpaired two-tailed t-test, P = 0.1219).
DISCUSSION
To our knowledge, this is the first demonstration of cell proliferation associated with gliogenesis in the rat MNTB. This study also provides three novel results that are relevant to understand neuron–glial cell interactions in the developing MNTB. First, in this study we showed that there is an increase in cell proliferation activity during perinatal stages of development. This increase in cell proliferation concurs with the period of MNTB growth (Fig. 2), and the presence of S100β positive astrocytes among MNTB neurons (Figs. (5 and 6)). The demonstration that newly born cells colabeled with the astrocyte marker S100β in higher numbers when cells were generated at perinatal ages than when cells were born at P6 (Fig. 8) identifies the first postnatal week as an important stage for the development of MNTB astrocytes. Second, in this study we identified proliferating cells that were colabeled with caspase-3 immunohistochemistry (Fig. 9). This observation provides new evidence about the nature of apoptotic nonneuronal cells described in a previous study (Rodríguez-Contreras et al., 2006). Third, in this study we showed that a decrease in the density of proliferating cells is correlated with the age of hearing onset in rats, mice, gerbils, and ferrets (Figs. (4 and 11)), and that bilateral lesions of the auditory periphery in rat pups cause a stronger decrease in the density of EdU-labeled cells in the MNTB (Figs. (12 and 13)).
EdU labels glial cell progenitors in the MNTB
By using EdU to label cells undergoing DNA synthesis in rodent and ferret pups, we showed changes in the density of proliferating cells during postnatal development (Figs. (3 and 4), 11). It is important to acknowledge that DNA synthesis can also reflect other processes such as DNA duplication, DNA repair, or apoptosis (Breunig et al., 2007). Our experiments showed that there is an increase in the density of caspase-3-positive cells between P4 and P9 (Figs. (9 and 10)), but this was not correlated with an increase in the density of EdU-labeled cells in acute experiments at comparable ages (Fig. 4B). Therefore, we think that our measurements may only slightly overestimate the density of proliferating cells in the MNTB.
We previously showed that the number of cells in the rat MNTB increases during the first 2 weeks of postnatal development (Rodríguez-Contreras et al., 2006). Other studies showed there is a marked increase in brain growth after the first postnatal week, which involves addition of nonneuronal cells and is complete by P21 (Bandeira et al., 2006). Our results differ from those findings since growth-related changes in the MNTB occurred predominately during the first postnatal week (Fig. 2). One possible way to explain these results aside from methodological differences is to consider the contribution of diverse mechanisms of tissue growth such as cell migration and angiogenesis, which could act in combination with changes in cell proliferation of nonneuronal cells.
A limitation of this study is that we did not identify molecular markers for the putative glial cell progenitors. Instead, we relied on S100β immunohistochemistry to demonstrate that these putative progenitors generate cells with an astrocyte-like phenotype. The increase in anti-MBP staining between P3 and P9 suggests that oligodendrocyte development proceeds in parallel with astrocyte maturation. Therefore, it is likely that cell proliferation activity in the MNTB might involve a mixed population of progenitor cells which could be involved in generating astrocytes (Zhu et al., 2011, 2012) and oligodendrocytes (NG2 cells; Müller et al., 2009; Nishiyama et al., 2009). Microglial cells originate during embryonic stages (Kierdorf et al., 2013). Our current experimental approach cannot address this hypothesis directly, but using mouse lines expressing genetically encoded fluorescent reporters could be useful in future studies (Kang et al., 2010; Ge et al., 2012; Kierdorf et al., 2013).
Significance of the relationship between cell proliferation activity and apoptosis in the MNTB
The presence of caspase-3 labeling in newly generated cells (Fig. 9) provides new clues about previously described nonneuronal apoptotic cells in the MNTB (Rodríguez-Contreras et al., 2006) and opens new questions concerning developmental changes in the cellular composition of the MNTB. As mentioned above, we observed an increase in the density of caspase-3-labeled cells between P4 and P9 (Fig. 10A). This increase was correlated with a decrease in the density of double-labeled EdU/S100β cells during development (Fig. 8D), suggesting that newly generated astrocytes are susceptible to cell death during postnatal development. In a previous study, we determined that the total number of cells in the MNTB increases from 3,000 cells at P3 to about 5,000 cells at P15 (Rodríguez-Contreras et al., 2006), which is in agreement with the study by Kulesza et al. (2002), who determined that there are about 6,000 neurons in the MNTB of adult Wistar rats. Although the previous studies only used morphological criteria to count cells (cresyl violet-stained nuclei and nucleoli), future studies could use different morphological and molecular markers to determine how the number of neurons and glial cells in the MNTB change during development.
Although our experiments do not point to the mechanisms that trigger apoptosis in MNTB cells, we propose that cell death might be part of a more complex process of tissue remodeling during postnatal development. There are three lines of evidence in support of this idea. First, previous studies showed evidence of functional interactions between MNTB neurons and glial cells (Elezgarai et al., 2001; Sätzler et al., 2002; Renden et al., 2005; Ford et al., 2009; Müller et al., 2009; Reyes-Haro et al., 2010), which we hypothesize begin during development. Second, during the developmental period between birth and P4 the main afferent synaptic input to the MNTB undergoes dramatic changes, including dynamic changes in the morphology of afferent axons; multi-innervation of principal cells; and elimination of synaptic inputs (Hoffpauir et al., 2006; Rodríguez-Contreras et al., 2006, 2008). Third, recent studies showed that astrocytes produce molecular signals that are crucially involved in synaptic and neuronal maturation during postnatal development of different brain regions, including the auditory brainstem (Eroglu and Barres, 2010; Korn et al., 2011, 2012). Thus, glial cell development may play important roles in the maturation of neuronal auditory circuits (Korn and Cramer, 2008).
Coordinated changes in cell proliferation during development and after lesions to the auditory periphery
Ear canal and eye opening occur during the second postnatal week in rodents and at the end of the first month of postnatal age in the ferret (Clancy et al., 2001). In this study we found a correlated decrease in the density of proliferating cells during this critical period in the development of sensory systems (Figs. (4 and 11)). Our comparative results suggest that cell proliferation in the MNTB of altricial mammals is under developmental regulation. We further hypothesized that there is a link between development of the auditory periphery and a reduction in cell proliferation in the MNTB. To test this hypothesis, we performed auditory periphery lesions in rats and found a further reduction in MNTB cell proliferation only when bilateral lesions were done. This result was surprising because the comparative data suggested that developmental changes in the sensory periphery correlated with a decrease in cell proliferation, while the lesion experiments suggest that the physical integrity of both ears is important to maintain levels of cell proliferation in the auditory brainstem of rats.
To reconcile these different interpretations and explain the effects of lesions on cell proliferation, we postulate two alternative models, a direct effect model and an indirect effect model. In the direct effect model, a signal or set of signals are produced in the auditory periphery to maintain the proliferative activity of progenitor cells in the auditory brainstem. To account for the lesion effects, the direct effect model requires that the efficacy or availability of the signal(s) produced in the auditory periphery change developmentally. For example, if the production of the putative signals(s) increased perinatally to reach a steady level and then decreased during the onset of hearing, one could explain: 1) the increase and maintenance of cell proliferation between P0 and P10, 2) the decline in cell proliferation around hearing onset, and 3) the further decreasing effect of bilateral lesions on cell proliferation between P2 and P16 (Figs. (4 and 11)). In the indirect effect model, auditory periphery development and changes in cell proliferation in the brainstem could be regulated by different signals that are correlated, but not causally linked, during postnatal life. In this alternative model the effects of lesions could be explained as side effects, caused for example by systemic inflammation. It is important to note that bilateral lesions performed at P2 and P16 did not have a very strong effect on cell proliferation compared to sham controls (Figs. (12 and 13)), supporting the idea that the proposed link between auditory periphery development and cell proliferation in the MNTB is constrained to a specific postnatal age range and might not result only from side effects.
Unfortunately, the lesion approach did not allow us to identify the precise origin of the putative auditory periphery signals (i.e., middle or inner ear), or whether these signals acted directly or indirectly on proliferating cells. The fact that only bilateral lesions caused a decrease in cell proliferation differs from previous studies that showed activity-dependent transneuronal regulation in the MNTB upon unilateral cochlear ablation or pharmacological blockade of auditory nerve activity (Pasic et al., 1994). If patterned neuronal electrical activity was the main signal for maintaining cell proliferation in the MNTB, one would expect a decrease in cell proliferation after unilateral lesions, since the MNTB receives innervation from the contralateral ear (Pasic et al., 1994). It is plausible, however, that binaural innervation of the SOC is both sufficient and necessary to maintain cell proliferation levels in the SOC, including the MNTB. For instance, we would like to note that unilateral cochlear ablation or pharmacological blockade of auditory nerve activity with tetrodotoxin caused a reduction of neuronal soma size in the MNTB only 48 hours after experimental manipulation (Pasic et al., 1994), which differs from the 24-hour recovery period used in this study. Therefore, we would predict that monaural cochlear lesions could have an effect on cell proliferation in the contralateral MNTB if tested at 48 hours postlesion.
The presence of small GFAP-labeled particles in the MNTB between P3 and P9 (Fig. 5A,B,J) is puzzling in the context of previous findings of membrane shedding during activity-dependent pruning and synaptic remodeling (Bishop et al., 2004; Watts et al., 2004; Fuentes-Medel et al., 2009). Interestingly, the time course of changes in density of EdU-labeled cells described in this study (Fig. 4B) is similar to the time course of changes in spontaneous patterned activity described in the rodent auditory system (Sonntag et al., 2009; Tritsch and Bergles, 2010; Tritsch et al., 2010; Crins et al., 2011). Studies are under way in our laboratory to determine the origin of small GFAP-labeled particles in the MNTB and their relationship to activity-dependent synaptic maturation. Recent findings showed that rodents with altered cochlear activity have smaller auditory brainstem nuclei (Hirtz et al., 2012). In combination with auditory periphery lesions, these mice could provide a new tool to investigate the impact of decreased electrical activity on cell proliferation and gliogenesis in the auditory brainstem.
In conclusion, the results of this study contribute new information to understand the development of neuron–glial cell interactions in the MNTB during development. We suggest that the developmental reduction in cell proliferation may reflect coordinated signaling between the auditory brainstem and the auditory periphery.
Acknowledgments
We thank M. Chang-Qui, S. Saigal, T. McIntosh, and K. Ramnarine for help with histology; Dr. J.B. Levitt for sharing histology resources and ferrets; and Drs. S. García-Hernández, J.B. Levitt, and J. Wallman for providing comments on an earlier version of the article. K.K. was supported by NYCSEF; S.X. was supported by CCAP; A.S. was supported by LSAMP.
Grant sponsor: NIH/NCRR/RCMI; Grant number: G12-RR003060; Grant sponsor: Eunice Shriver National Institute of Child Health & Human Development; Grant number: SC1HD068129.
Footnotes
ROLE OF AUTHORS
All authors had full access to all the data in the study and take responsibility for the integrity of the data and the accuracy of the data analysis. Study concept and design: AS, SA, SX, KK, AR-C. Acquisition of data: AS, SA, SX, KK, AR-C. Analysis and interpretation of data: AS, SA, SX, KK, AR-C. Drafting of the article: AS, SA, AR-C. Critical revision of the article for important intellectual content: AS, SA, SX, KK, AR-C. Statistical analysis: AR-C. Obtained funding: AR-C. Administrative, technical, and material support: SA. Study supervision: AR-C.
LITERATURE CITED
- Bandeira F, Lent R, Herculano-Houzel S. Changing numbers of neuronal and non-neuronal cells underlie postnatal brain growth in the rat. Proc Natl Acad Sci U S A. 2009;106:14198–14213. doi: 10.1073/pnas.0804650106. [DOI] [PMC free article] [PubMed] [Google Scholar]
- Bayer SA. Cellular aspects of brain development. Neurotoxicol. 1989;10:307–320. [PubMed] [Google Scholar]
- Bishop DL, Misgeld T, Walsh MK, Gan WB, Lichtman JW. Axon branch removal at developing synapses by axosome shedding. Neuron. 2004;44:651–661. doi: 10.1016/j.neuron.2004.10.026. [DOI] [PubMed] [Google Scholar]
- Borst JGG, Soria van Hoeve J. The calyx of Held synapse: from model synapse to auditory relay. Annu Rev Physiol. 2012;74:199–224. doi: 10.1146/annurev-physiol-020911-153236. [DOI] [PubMed] [Google Scholar]
- Breunig JJ, Arellano JI, Macklis JD, Rakic P. Everything that glitters isn’t gold: a critical review of postnatal neural precursor analyses. Cell Stem Cell. 2007;1:612–627. doi: 10.1016/j.stem.2007.11.008. [DOI] [PubMed] [Google Scholar]
- Clancy B, Darlington RB, Finlay BL. Translating developmental time across mammalian species. Neuroscience. 2001;105:7–17. doi: 10.1016/s0306-4522(01)00171-3. [DOI] [PubMed] [Google Scholar]
- Crins TT, Rusu SI, Rodríguez-Contreras A, Borst JGG. Developmental changes in short-term plasticity at the rat calyx of Held synapse. J Neurosci. 2011;31:11706–11717. doi: 10.1523/JNEUROSCI.1995-11.2011. [DOI] [PMC free article] [PubMed] [Google Scholar]
- D’Agostino RB. Tests for normal distribution. In: D’Agostino RB, Stephens MA, editors. Goodness-of-fit techniques. New York: Marcel Dekker; 1986. [Google Scholar]
- Elezgarai I, Bilbao A, Mateos JM, Azkue JJ, Benitez R, Osorio A, Diez J, Puente N, Donate-Oliver F, Grandes P. Group II metabotropic glutamate receptors are differentially expressed in the medial nucleus of the trapezoid body in the developing and adult rat. Neuroscience. 2001;104:487–498. doi: 10.1016/s0306-4522(01)00080-x. [DOI] [PubMed] [Google Scholar]
- Eroglu C, Barres BA. Regulation of synaptic connectivity by glia. Nature. 2010;468:223–231. doi: 10.1038/nature09612. [DOI] [PMC free article] [PubMed] [Google Scholar]
- Ford MC, Grothe B, Klug A. Fenestration of the calyx of Held occurs sequentially along the tonotopic axis, is influenced by afferent activity, and facilitates glutamate clearance. J Comp Neurol. 2009;514:92–106. doi: 10.1002/cne.21998. [DOI] [PubMed] [Google Scholar]
- Fuentes-Medel Y, Logan MA, Ashley J, Ataman B, Budnki V, Freeman MR. Glia and muscle sculpt neuromuscular arbors by engulfing destabilized synaptic boutons and shed presynaptic debris. PLoS Biol. 2009;7:e1000184. doi: 10.1371/journal.pbio.1000184. [DOI] [PMC free article] [PubMed] [Google Scholar]
- Ge WP, Miyawaki A, Gage FH, Jan YN, Jan LY. Local generation of glia is a major astrocyte source in postnatal cortex. Nature. 2012;484:376–380. doi: 10.1038/nature10959. [DOI] [PMC free article] [PubMed] [Google Scholar]
- Groome N, Harland J, Dawkes A. Preparation and properties of monoclonal antibodies to myelin basic protein and its peptides. Neurochem Int. 1985;7:309–317. doi: 10.1016/0197-0186(85)90120-2. [DOI] [PubMed] [Google Scholar]
- Hirtz JJ, Braun N, Griesemer D, Hannes C, Janz K, Lohrke S, Müller B, Friauf E. Synaptic refinement of an inhibitory topographic map in the auditory brainstem requires functional Cav1.3 calcium channels. J Neurosci. 2012;32:14602–14616. doi: 10.1523/JNEUROSCI.0765-12.2012. [DOI] [PMC free article] [PubMed] [Google Scholar]
- Hoffpauir BK, Grimes JL, Mathers PH, Spirou GA. Synaptogenesis of the calyx of Held: rapid onset of function and one-to-one morphological innervation. J Neurosci. 2006;26:5511–5523. doi: 10.1523/JNEUROSCI.5525-05.2006. [DOI] [PMC free article] [PubMed] [Google Scholar]
- Hoffpauir BK, Kolson DR, Mathers PH, Spirou GA. Maturation of synaptic partners: functional phenotype and synaptic organization tuned in synchrony. J Physiol. 2010;588:4365–4385. doi: 10.1113/jphysiol.2010.198564. [DOI] [PMC free article] [PubMed] [Google Scholar]
- Jarjour AA, Bull S-J, Almasieh M, Rajasekharan S, Baker KA, Mui J, Antel JP, Di Polo A, Kennedy TE. Maintenance of axo-oligodendroglial paranodal junctions requires DCC and Netrin-1. J Neurosci. 2008;28:110033–11014. doi: 10.1523/JNEUROSCI.3285-08.2008. [DOI] [PMC free article] [PubMed] [Google Scholar]
- Kang SH, Fukaya M, Yang JK, Rothstein JD, Bergles DE. NG2+ CNS glial progenitors remain committed to the oligodendrocyte lineage in postnatal life and following neurodegeneration. Neuron. 2010;68:668–681. doi: 10.1016/j.neuron.2010.09.009. [DOI] [PMC free article] [PubMed] [Google Scholar]
- Kierdorf K, Erny D, Goldmann T, Sander V, Schulz C, Perdiguero EG, Wieghofer P, Heinrich A, Riemke P, Hölscher C, Müller DN, Luckow B, Brocker T, Debowski K, Fritz G, Opdenakker G, Dieenbach A, Biber K, Heikenwalder M, Geissmann F, Rosenbauer F, Prinz M. Microglia emerge from erythromyeloid precursors via Pu.1- and Irf8-dependent pathways. Nat Neurosci. 2013;16:273–280. doi: 10.1038/nn.3318. [DOI] [PubMed] [Google Scholar]
- Korn MJ, Cramer KS. Distribution of glial-associated proteins in the developing chick auditory brainstem. Dev Neurobiol. 2008;68:1093–1106. doi: 10.1002/dneu.20645. [DOI] [PubMed] [Google Scholar]
- Korn MJ, Koppel SJ, Cramer KS. Astrocyte-secreted factors modulate the developmental distribution of inhibitory synapses in nucleus laminaris of the avian auditory brainstem. PLoS One. 2011;6:e27383. doi: 10.1002/cne.22786. [DOI] [PMC free article] [PubMed] [Google Scholar]
- Korn MJ, Koppel SJ, Li LH, Mehta D, Mehta SB, Seidl AH, Cramer KS. Astrocyte-secreted factors modulate the developmental distribution of inhibitory synapses in nucleus laminaris of the avian auditory brainstem. J Comp Neurol. 2012;520:1262–1277. doi: 10.1002/cne.22786. [DOI] [PMC free article] [PubMed] [Google Scholar]
- Kudo M, Sakurai H, Kurokawa K, Yamada H. neurogenesis in the superior olivary complex of the rat. Hear Res. 2000;139:144–152. doi: 10.1016/s0378-5955(99)00172-0. [DOI] [PubMed] [Google Scholar]
- Kulesza RJ, Jr, Viñuela A, Saldaña E, Berrebi AS. Unbiased stereological estimates of neuron number in subcortical auditory nuclei of the rat. Hear Res. 2002;168:12–24. doi: 10.1016/s0378-5955(02)00374-x. [DOI] [PubMed] [Google Scholar]
- McFadden SL, Walsh EJ, McGee J. Onset and development of auditory brainstem responses in the Mongolian gerbil (Meriones unguiculatus) Hear Res. 1996;100:68–79. doi: 10.1016/0378-5955(96)00108-6. [DOI] [PubMed] [Google Scholar]
- McGuirt JP, Schmiedt RA, Schulte BA. Development of cochlear potentials in the neonatal gerbil. Hear Res. 1995;84:52–60. doi: 10.1016/0378-5955(95)00015-v. [DOI] [PubMed] [Google Scholar]
- Moore DR, Hine JE. Rapid development of the auditory brainstem response threshold in individual ferrets. Brain Res Dev Brain Res. 1992;66:229–235. doi: 10.1016/0165-3806(92)90084-a. [DOI] [PubMed] [Google Scholar]
- Morest DK, Silver J. Precursors of neurons, neuroglia, and ependymal cells in the CNS: what are they? Where are they from? How do they get where they are going? Glia. 2003;43:6–18. doi: 10.1002/glia.10238. [DOI] [PubMed] [Google Scholar]
- Müller J, Reyes-Haro D, Pivneva T, Nolte C, Schaette R, Lubke J, Kettenmann H. the principal neurons of the medial nucleus of the trapezoid body and NG2(+) glial cells receive coordinated excitatory synaptic input. J Gen Physiol. 2009;134:115–127. doi: 10.1085/jgp.200910194. [DOI] [PMC free article] [PubMed] [Google Scholar]
- Murai KK, van Meyel DJ. Neuron-glial communication at synapses: insights from vertebrates and invertebrates. Neuroscientist. 2007;13:657–666. doi: 10.1177/1073858407304393. [DOI] [PubMed] [Google Scholar]
- Nakamura PA, Cramer KS. Formation and maturation of the calyx of Held. Hear Res. 2011;276:70–78. doi: 10.1016/j.heares.2010.11.004. [DOI] [PMC free article] [PubMed] [Google Scholar]
- Nishiyama A, Komitova M, Suzuji R, Zhu X. Polydendrocytes (NG2 cells): multifunctional cells with lineage plasticity. Nat Rev Neurosci. 2009;10:9–22. doi: 10.1038/nrn2495. [DOI] [PubMed] [Google Scholar]
- Pasic TR, Moore DR, Rubel EW. Effect of altered neuronal activity on cell size in the medial nucleus of the trapezoid body and ventral cochlear nucleus of the gerbil. J Comp Neurol. 1994;348:111–120. doi: 10.1002/cne.903480106. [DOI] [PubMed] [Google Scholar]
- Renden R, Taschenberger H, Puente N, Rusakov DA, Duvoisin R, Wang LY, Lehre KP, von Gersdorff H. Glutamate transporter studies reveal the pruning of metabotropic glutamate receptors and absence of AMPA receptor desensitization at mature calyx of Held synapses. J Neurosci. 2005;25:8482–8497. doi: 10.1523/JNEUROSCI.1848-05.2005. [DOI] [PMC free article] [PubMed] [Google Scholar]
- Reyes-Haro D, Müller J, Boresch M, Pivneva T, Benedetti B, Scheller A, Nolte C, Kettenmann H. Neuron-astrocyte interactions in the medial nucleus of the trapezoid body. J Gen Physiol. 2010;135:583–594. doi: 10.1085/jgp.200910354. [DOI] [PMC free article] [PubMed] [Google Scholar]
- Rodríguez-Contreras A, Liu XB, DeBello WM. Axodendritic contacts onto calcium/calmodulin-dependent protein kinase type II-expressing neurons in the barn owl auditory space map. J Neurosci. 2005;25:5611–5622. doi: 10.1523/JNEUROSCI.3972-04.2005. [DOI] [PMC free article] [PubMed] [Google Scholar]
- Rodríguez-Contreras A, de Lange RP, Lucassen PJ, Borst JGG. Branching of calyceal afferents during postnatal development in the rat auditory brainstem. J Comp Neurol. 2006;496:214–228. doi: 10.1002/cne.20918. [DOI] [PubMed] [Google Scholar]
- Rodríguez-Contreras A, van Hoeve JS, Habets RL, Locher H, Borst JGG. Dynamic development of the calyx of Held synapse. Proc Natl Acad Sci U S A. 2008;105:5603–5608. doi: 10.1073/pnas.0801395105. [DOI] [PMC free article] [PubMed] [Google Scholar]
- Rosi D, Volterra A. Astrocytic dysfunction: insights on the role in neurodegeneration. Brain Res Bull. 2009;80:224–232. doi: 10.1016/j.brainresbull.2009.07.012. [DOI] [PubMed] [Google Scholar]
- Salic A, Mitchison TJ. A chemical method for fast and sensitive detection of DNA synthesis in vivo. 2008. Proc Natl Acad Sci U S A. 2008;105:2415–2420. doi: 10.1073/pnas.0712168105. [DOI] [PMC free article] [PubMed] [Google Scholar]
- Sánchez-Gómez MV, Alberdi E, Ibarretxe G, Torre I, Matute C. Caspase-dependent and caspase-independent oligodendrocyte death mediated by AMPA and kainite receptors. J Neurosci. 2003;23:9519–9528. doi: 10.1523/JNEUROSCI.23-29-09519.2003. [DOI] [PMC free article] [PubMed] [Google Scholar]
- Sätzler K, Sohl LF, Bollman JH, Borst JGG, Frotscher M, Sakmann B, Lubke JH. Three-dimensional reconstruction of a calyx of Held and its postsynaptic principal neuron in the medial nucleus of the trapezoid body. J Neurosci. 2002;22:10567–10579. doi: 10.1523/JNEUROSCI.22-24-10567.2002. [DOI] [PMC free article] [PubMed] [Google Scholar]
- Schneggenburger R, Forsythe ID. The calyx of Held. Cell Tissue Res. 2006;326:311–337. doi: 10.1007/s00441-006-0272-7. [DOI] [PubMed] [Google Scholar]
- Sonntag M, Englitz B, Kopp-Scheinpflug C, Rubsamen R. Early postnatal development of spontaneous and acoustically evoked discharge activity of principal cells of the medial nucleus of the trapezoid body: an in vivo study in mice. J Neurosci. 2009;29:9510–9520. doi: 10.1523/JNEUROSCI.1377-09.2009. [DOI] [PMC free article] [PubMed] [Google Scholar]
- Tritsch NX, Bergles DE. Developmental regulation of spontaneous activity in the mammalian cochlea. J Neurosci. 2010;30:1539–1550. doi: 10.1523/JNEUROSCI.3875-09.2010. [DOI] [PMC free article] [PubMed] [Google Scholar]
- Tritsch NX, Rodríguez-Contreras A, Crins TT, Wang HC, Borst JGG, Bergles DE. Calcium action potentials in hair cells pattern auditory neuron activity before hearing onset. Nat Neurosci. 2010;13:1050–1052. doi: 10.1038/nn.2604. [DOI] [PMC free article] [PubMed] [Google Scholar]
- von Gersdorff H, Borst JGG. Short-term plasticity at the calyx of Held. Nat Rev Neurosci. 2002;3:53–64. doi: 10.1038/nrn705. [DOI] [PubMed] [Google Scholar]
- Watts RJ, Schuldiner O, Perrino J, Larsen C, Luo L. Glia engulf degenerating axons during developmental axon pruning. Curr Biol. 2004;14:678–684. doi: 10.1016/j.cub.2004.03.035. [DOI] [PubMed] [Google Scholar]
- Woolf NK, Ryan AF. The development of auditory function in the cochlea of the Mongolian gerbil. Hear Res. 1984;13:277–283. doi: 10.1016/0378-5955(84)90081-9. [DOI] [PubMed] [Google Scholar]
- Zhu X, Hill RA, Dietrich D, Komitova M, Suzuki R, Nishiyama A. Age-dependent fate and lineage restriction of single NG2 cells. Development. 2011;138:745–753. doi: 10.1242/dev.047951. [DOI] [PMC free article] [PubMed] [Google Scholar]
- Zhu X, Zuo H, Maher BJ, Serwanski DR, LoTurco JJ, Lu QR, Nishiyama A. Olig2-dependent developmental fate switch of NG2 cells. Development. 2012;139:2299–2307. doi: 10.1242/dev.078873. [DOI] [PMC free article] [PubMed] [Google Scholar]


