Abstract
The focusing of laser-generated shock waves by a truncated ellipsoidal reflector was experimentally and numerically investigated. Pressure waveform and distribution around the first (F1) and second foci (F2) of the ellipsoidal reflector were measured. A neodymium doped yttrium aluminum garnet laser of 1046 nm wavelength and 5 ns pulse duration was used to create an optical breakdown at F1, which generates a spherically diverging shock wave with a peak pressure of 2.1–5.9 MPa at 1.1 mm stand-off distance and a pulse width at half maximum of 36–65 ns. Upon reflection, a converging shock wave is produced which, upon arriving at F2, has a leading compressive wave with a peak pressure of 26 MPa and a zero-crossing pulse duration of 0.1 µs, followed by a trailing tensile wave of −3.3 MPa peak pressure and 0.2 µs pulse duration. The −6 dB beam size of the focused shock wave field is 1.6×0.2 mm2 along and transverse to the shock wave propagation direction. Formation of elongated plasmas at high laser energy levels limits the increase in the peak pressure at F2. General features in the waveform profile of the converging shock wave are in qualitative agreement with numerical simulations based on the Hamilton model.
I. INTRODUCTION
Electrohydraulic (EH) shock wave lithotripters, including the first generation Dornier HM-3, have been widely used in clinic for the treatment of kidney stones for over two decades.1–3 In a typical EH lithotripter, an underwater spark discharge is used to produce a spherically divergent shock wave at the first focus (F1) of a truncated brass ellipsoidal reflector. Upon reflection, the shock wave is converged to the second focus (F2) of the ellipsoidal reflector where the kidney stone inside the patient is aligned under fluoroscopic or ultrasound imaging guidance. Numerous clinical studies have demonstrated that the HM-3 produces better stone comminution with higher stone-free rate compared to the second and third generation electrohydraulic (EH), electromagnetic (EM) and piezoelectric (PE) lithotripters.4–6 The underlying mechanisms, however, have not been well understood. More recently, methods to upgrade the HM-3 lithotripter, which is still widely regarded as the golden standard in shock wave lithotripsy (SWL), for improved performance and safety have been proposed and tested in vitro.7–10 The general principle and techniques developed for upgrading the HM-3 may also be applied to improve the design of EM lithotripters which have been widely used in clinical SWL.
For design optimization of a lithotripter, development of numerical models that can simulate accurately the propagation and focusing of lithotripter shock waves (LSWs) will be valuable. In recent years, several different models have been developed to describe the general characteristics of linear and nonlinear wave propagations in the original and upgraded HM-3 lithotripters. Hamilton developed a linear model which depictures the propagation of different LSW components in space and time.11 Averkiou and Cleveland used the two-dimensional Khokhlov–Zabolotskaya–Kuznetsov (KZK) equation with initial conditions at the reflector aperture determined from geometrical acoustics.12 Zhou and Zhong extended this approach with initial conditions taken from measurements near F1 and introduced the concept of an equivalent reflector.13 Tanguay and Colonius used the Euler equations to model shock wave propagation in two-phase flow.14,15 Szeri et al. implemented a density jump technique to model the reflector as an interface in the fluid media.16,17 To validate the model calculation, comparison with reliable experimental data produced by the lithotripter is critical. However, because of the inherent instability in electrical spark discharge, repeatable pressure measurements in an EH lithotripter are problematic. Therefore, for model validation it is highly desirable to develop means for generating stable focused shock waves using a reflector configuration similar to that used in an EH lithotripter.
Optical breakdown induced by a focused Q-switched laser pulse in water produces a shock wave of microsecond duration.18–22 The focused laser initially vaporizes the water, giving rise to a bubble that expands rapidly and generates concomitantly a divergent shock wave.22,21 Upon reaching maximum expansion, the bubble collapses violently emitting a secondary shock wave at its minimal volume.19 This method provides a stable source for the generation of spherical shock wave with about 3% of the incident optical energy being converted into acoustic emission.20
In this work, the focusing of laser-generated shock waves in water by a truncated ellipsoidal brass reflector was investigated. The pressure waveform and distribution at both foci of the ellipsoidal reflector were measured. Further, the Hamilton model11 was implemented to simulate qualitatively the profile of the pressure waveform and its evolution along the reflector axis toward F2. The simulation results were compared to the experimental measurements. In addition, this experimental system was used to simulate the effect of jitters in electric spark discharge on the resultant pressure distribution at the lithotripter focus, i.e., the variation in peak pressure at F2 as a result of the departure of the shock wave emitter from F1. Altogether, these experimental results may be useful for validation of three dimensional (3D) numerical models of shock wave focusing in water.
II. MATERIALS AND METHODS
A. Experimental setup
A schematic diagram of the experimental setup is shown in Fig. 1. A Q-switched neodymium doped yttrium aluminum garnet laser with a wavelength of 1064 nm and a pulse duration of ~5 ns (Tempest 10, New Wave Research, Fremont, CA) was collimated and focused by a combination of lenses (F=30 mm and NA=0.6 for the last focusing lens) in water to generate a single cavitation bubble via optical breakdown. The laser was operated at 9.3%, 21%, 33%, or 65% of its maximum output energy of 200 mJ (yet the optical attenuation in the focusing lens was unknown). For conciseness, we will omit the inclusion of the maximum energy in describing the laser output henceforth. The laser was aligned horizontally with its beam focus coinciding with F1 of a truncated ellipsoidal reflector insert described previously.7 The reflector insert has a major semiaxis a′=132.45 mm, a minor semiaxis b′=71.5 mm, and a half focal length c′=111.5 mm. The height of the reflector insert is 106 mm and the minimal distance from F1 to the plane coinciding with the lower edge of the reflector insert is 4 mm. With this geometry the reflector insert covers about 39% of the full solid angle around F1. The reflector was mounted on a (3D) translational stage (Thorlabs, Newton, NJ) and immersed in a water tank (40 cm × 31 cm × 60 cm) filled with degassed water at 20 °C.
FIG. 1.
A schematic diagram of the experimental setup, F1 is the first and F2 is the second focus of the ellipsoidal reflector.
Based on linear acoustic approximation, the beam diameter (DB) at F2 can be estimated by using the following equation [see Ref. 23 Eq. (5.51) on p. 107]:
| (1) |
where λ(=2sτ) is the wavelength, Lf is the focal length, D is the aperture diameter of the source, s=1482 m/s is the sound speed in water at 20 °C, and τ=28±8 ns is the full width at half maximum (FWHM) of the shock wave pulse measured at a stand-off distance of r=1.1 mm from F1 at 9.3% of the maximum laser output energy.24 The peak positive pressure (p+) at F2 of the reflected shock wave can be estimated from energy conservation consideration. Without attenuation, the total acoustic energy delivered by the focused wave at F2 should be equal to the energy associated with the shock wave emitted from F1, i.e.,
| (2) |
where pP=4.8±0.3 MPa is the peak pressure of the shock wave measured at a stand-off distance of r=1.1 mm from F1 at 9.3% of the maximum laser output energy.24 The coefficient of 0.39 accounts for the fact that only 39% of the original shock wave emitted from F1 will be covered by the reflector insert. From Eq. (1) and Eq. (2), one can obtain
| (3) |
B. Pressure measurement near F1
The pressure waveforms were measured by using a fiber optic probe hydrophone (FOPH-500, RP Acoustics, Leutenbach, Germany). The 100 µm probe tip of the hydrophone was aligned at a distance r from F1 using a combination of translational and rotational stages. The hydrophone signals were first recorded on a digital oscilloscope (500 MHz Wave Runner 6050A, LeCroy, Chestnut Ridge, NY), then inverted and deconvoluted to obtain calibrated pressure waveforms using a computer program supplied by the manufacturer. Signal averaging over 10–64 shots was performed to improve the signal-to-noise ratio of the measured pressure waveforms. When multiple signal averaging was not used (e.g., in reproducibility test), a moving average was calculated at each location using data points within a window of 10 ns duration, which corresponds to the temporal resolution of the hydrophone.
C. Alignment of the reflector
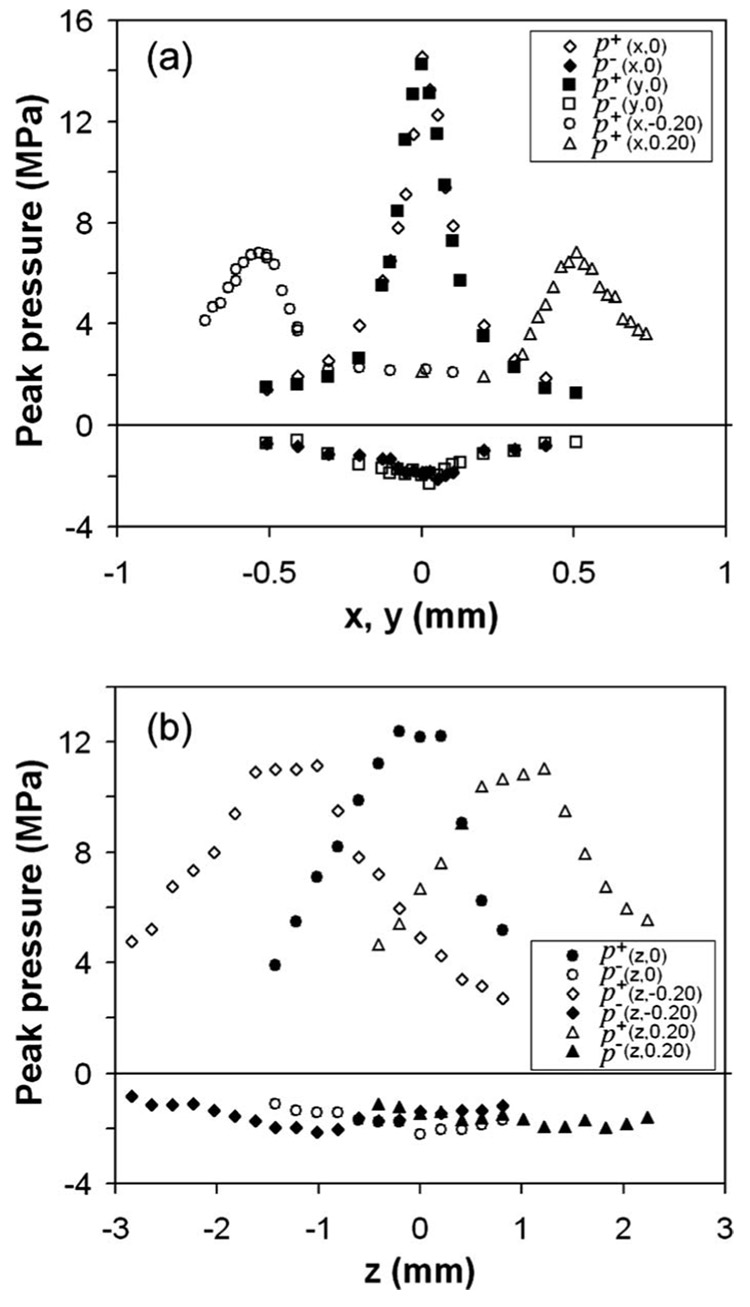
Alignment of the reflector insert and pressure measurement near F2 was carried out by scanning along each of the three orthogonal axes (x, y, and z) until the maximum peak pressure at F2 was detected. Figure 2 shows the distribution of the peak pressure along x and y axes, as well as along the z-axis at laser energy E=9.3%. It can be seen that misalignment of the reflector insert by 0.2 mm (more than the wave-length of the acoustic pulse) could result in a significant drop in the peak pressure. The −6 dB beam size at F2 was estimated to be about 0.2 × 1.6 mm2 in the lateral and axial directions of the reflector.
FIG. 2.
The distribution of peak pressures near F2 (p+ for positive and p− for negative) when reflector is displaced for +0.20, 0, and −0.20 mm (the second coordinate in the bracket) along (a) x- or y-axis and (b) z-axis. E=9.3%, PRF=5 Hz, each point represents averaged data over ten measurements.
Since the beam size in the lateral direction [0.20±0.03 mm, Fig. 2(a)] is only about twice the hydrophone probe diameter (d=0.1 mm), significant spatial averaging error could be introduced near F2.25 Assuming a Gaussian distribution for the converging LSW and an effective beam diameter ,25 integration over the probe surface gives an estimated focal pressure p*=1.4p+. Away from F2, however, the hydrophone can successfully capture the true waveform of the shock wave.
D. High-speed shadowgraph imaging
The dynamics of laser-generated shock waves and associated cavitation bubbles were captured by using a high-speed imaging system (Imacon 200, DRS Hadland, Oakland, NJ) in combination with a long-distance microscope (K2, Infinity, Boulder, CO) and a 5× objective lens. A fiber optic coupled xenon flash lamp (ML-1000, Dyna-Lite, Union, NJ) was used for illumination. A digital delay generator (DG 535, Stanford Research Systems, Sunnyvale, CA) was used to trigger the laser, flash lamp, and the high-speed camera, respectively. The laser spark measured by a photodetector (PDA50, Thorlabs, Newton, NJ) was used as the reference time for the shadowgraph images.
E. Numerical analysis
Because of the extreme high gain of the reflector insert for laser-induced shock wave (G=309 for E=21% based on the data shown in Table I and Table II) conventional nonlinear wave propagation models, such as the KZK equation, become invalid.26 For modeling shock wave focusing based on the Euler equations in combination with the Tait equation, extremely large number of grid nodes will be required because of the high frequency content of the pulse, leading to unacceptably long computation time.16 In light of these limitations, the Hamilton model of linear wave focusing in an ellipsoidal reflector11 was chosen to reveal the general features and to facilitate the interpretation of the measured pressure waveforms in terms of various contributory components (the central wave, the wake, and the edge wave). Pressure waveforms measured near F1 [Fig. 4(b)] were used as the source condition in the Hamilton model calculation.
TABLE I.
Characteristics of the pressure waveforms measured at a stand-off distance of 3 mm away from F1 at different energy levels (PRF=5 Hz).
| Laser energy E (%) | Peak pressure pP (MPa) | Peak arrival time (ns) | Rise time (ns) | Full width at half maximum (FWHM) (ns) |
|---|---|---|---|---|
| 9.3 | 2.1 ± 0.1 | 2019 ± 2 | 10 ± 3 | 36 ± 6 |
| 21 | 3.2 ± 0.1 | 2008 ± 1 | 9 ± 2 | 45 ± 3 |
| 33 | 4.0 ± 0.2 | 1997 ± 3 | 9 ± 1 | 53 ± 6 |
| 65 | 5.9 ± 0.1 | 1984 ± 2 | 10 ± 1 | 65 ± 4 |
TABLE II.
Characteristics of the pressure waveforms measured at F2 at different energy levels (PRF=5 Hz, n=30) and normalized peak positive pressure determined based on theoretical calculation at z=−0.1 mm.
| Laser energy E(%) | Peak pos. pressure (MPa) | Peak arrival time (ns) | Beam length Δz (mm) | Beam width Δx (mm) | Full width at half maximum (FWHM) (ns) | Theoretical peak pos. pressure (normalized) |
|---|---|---|---|---|---|---|
| 9.3 | 15.0 ± 1.8 | 177 769 ± 8 | 1.6 ± 0.2 | 0.20 ± 0.03 | 24.5 ± 1.6 | 1 |
| 21 | 22.4 ± 1.6 | 177 747 ± 5 | 2.0 ± 0.2 | 24.1 ± 1.6 | 1.52 | |
| 65 | 25.9 ± 3.9 | 177 696 ± 7 | 33.1 ± 5.5 | 2.81 |
FIG. 4.
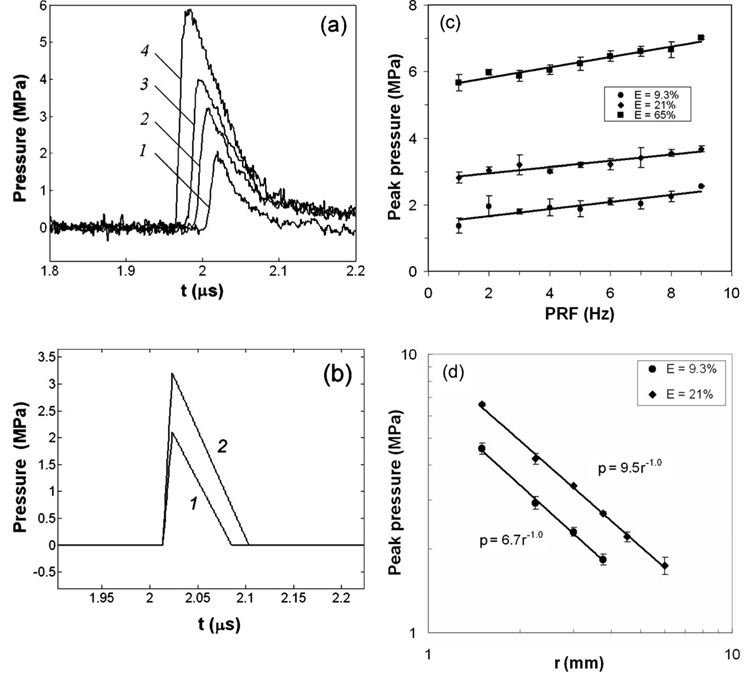
(a) The pressure waveforms measured at a stand-off distance of 3 mm from F1 produced at different laser energy levels of E=9.3% (1), 21% (2), 33% (3), and 65% (4) with PRF=5 Hz, φ=0°, and Θ=90°; (b) idealized pressure waveforms at F1 used for theoretical calculation based on the Hamilton model for E=9.3% (1) and 21% (2); (c) calibration curve for the peak pressure at different pulse repetition rates and energy levels measured at 3 mm above the laser spark (φ=90°, Θ=90°); (d) relationship between the peak pressure p and measurement distance r above the laser spark at two different energy levels (E=9.3% and 21%, PRF=5 Hz). Each pressure waveform was obtained by signal averaging over 20 shots. In (c) and (d), error bars show standard deviation from three independent experiments.
III. RESULTS
A. Laser-induced shock waves and cavitation bubble at F1
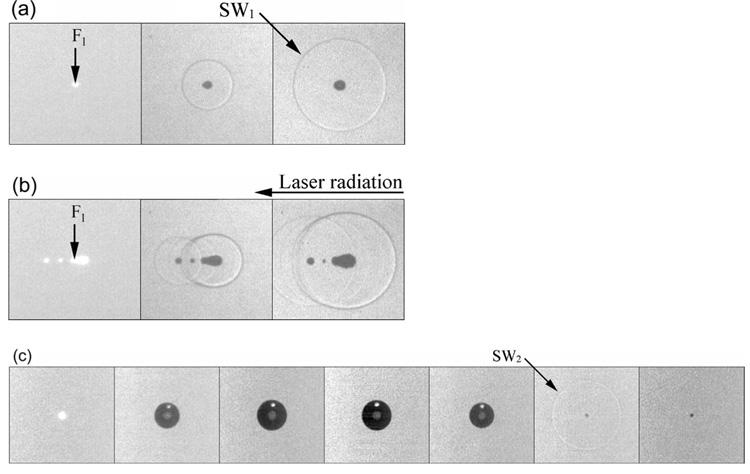
Figure 3 shows the general features of the shock wave and cavitation bubble produced by laser-induced optical breakdown at F1. Depending on the laser energy, the maximum bubble radius Rm varies in the range of 0.3–0.7 mm. At low energy settings, the shapes of the laser-induced plasma, bubble formation, and associated shock wave are all nearly spherical [Fig. 3(a)]. As the energy exceeds 65%, multiple spots of optical breakdown are observed with the location of the largest plasma and hypocenter of the strongest shock wave shifted toward the optical lens [Fig. 3(b)] due to peculiarities of laser-induced optical breakdown.27
FIG. 3.
High-speed images of laser-induced optical breakdown in water. SW1: shock wave produced by the laser spark: SW2: shock wave produced by bubble collapse. Laser energy level E=9.3% [(a) and (c)] and 65% (b), respectively; interframe time (IFT)=0.2 µs [(a) and (b)] and 10 µs (c), respectively; the height of each image frame is 1.7 mm.
The pressure profile of the shock wave, measured at a stand-off distance r=3 mm from the laser focus, shows a leading shock front followed by a tail approximated by a triangle [see Fig. 4(b)]. The pulse is essentially a compressive wave with negligible tensile component. The FWHM of the shock wave vary from 36 to 65 ns, and the rise time is about 10 ns which is close to the temporal resolution of the hydrophone [Fig. 4(a)]. As shown in Fig. 4(a) when laser energy increases the peak pressure becomes higher and pulse width widens, yet the arrival time of the shock wave is shortened as a result of nonlinear propagation. Based on the measurements, a simplified waveform at F1 was determined [Fig. 4(b)] and used for the Hamilton model calculation. In addition, the peak pressure was found to vary linearly with pulse repetition frequency (PRF) at different laser energy levels [Fig. 4(c)] since laser output energy increases with PRF. Furthermore, the peak pressure of a spherically divergent shock wave is known to vary inversely with the propagation distance,20–22 and this relationship is confirmed by the measurement data at two energy levels [Fig. 4(d)]. The peak pressure, arrival time, shock front rise time, and FWHM of the laser-generated shock waves are summarized in Table I.
At laser setting of E=9.3% the energy of the emitted shock wave from the optical breakdown and the potential energy of the resultant bubble at its maximum expansion can be determined as follows:
| (4) |
and
| (5) |
In contrast to the spark-generated bubble (between the tips of an electrode) in an EH lithotripter, laser-induced bubble expands and collapses symmetrically in a free field, leading to the generation of a strong secondary shock wave. It has been shown that the amplitude of the secondary shock wave could be as strong as the first one when the bubble collapse time is within 50–60 µs.24
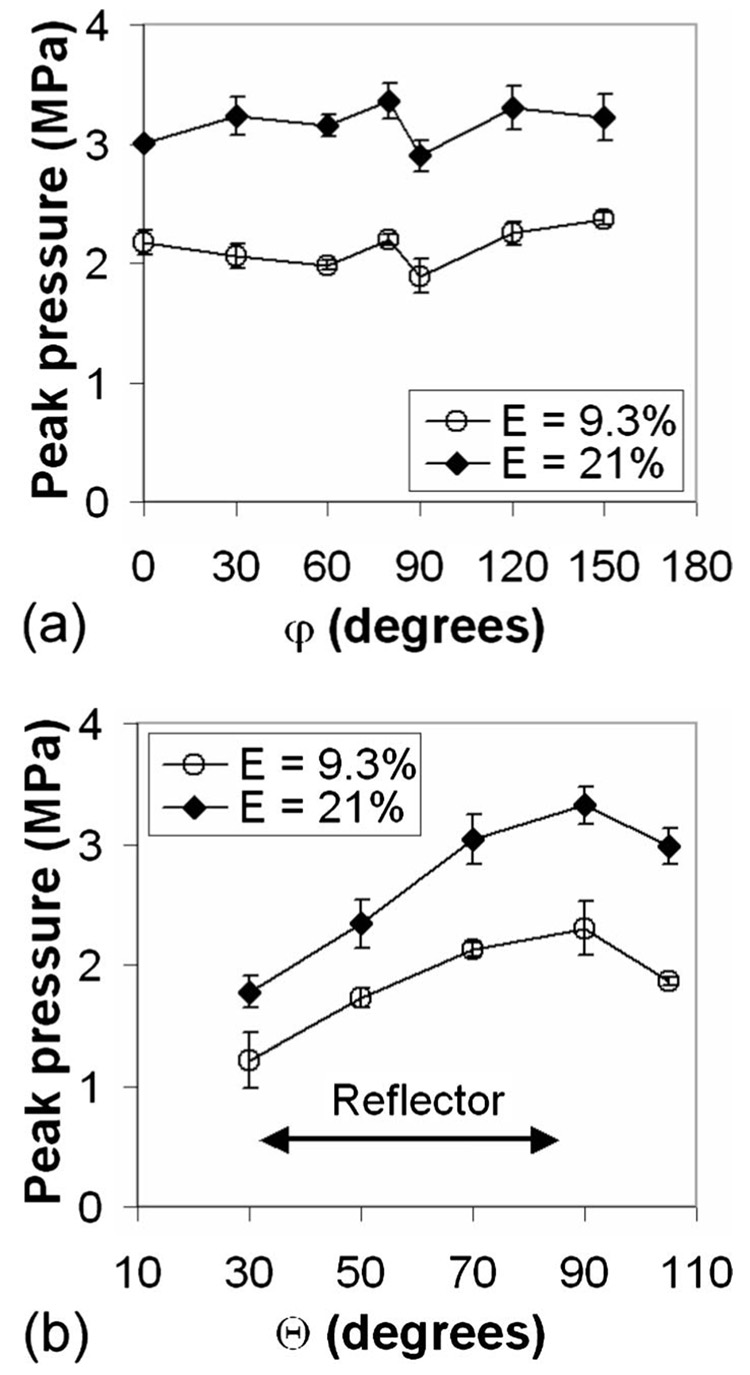
Figure 5 shows the angular variation of the peak pressure measured in two orthogonal planes (φ=90° and Θ=90°, respectively) at the same 3 mm stand-off distance from the laser focus. In the transverse plane (Θ=90°) it was found that the pressure distribution is symmetric around the optical axis [Fig. 5(a)]. However, in the axial plane (φ=90°) the pressure distribution is not uniform, and the strongest shock wave is produced in the direction perpendicular to the optical axis [Fig. 5(b)]. This is presumably because the laser plasma is elongated along the axis (see Fig. 3 and Ref. 21) forming a cylindrically elongated bubble with resultant nonuniform pressure distribution. At two different energy levels (E=9.3 and 21%), the pressure amplitudes are almost doubled when varies from 33° to 87°, which corresponds to the upper and the lower edges of the reflector [depictured by arrows in Fig. 5(b)].
FIG. 5.
Angular variation of the peak pressure of laser-generated shock waves near F1, in the plane (a) Θ=90° and (b) φ=90°. Measurements were made at a stand-off distance of 3 mm from the laser spark, PRF=5 Hz, using signal averaging over 20 shots. Error bars represent standard deviation from three independent experiments.
B. Experimental measurement of the focused shock wave near F2
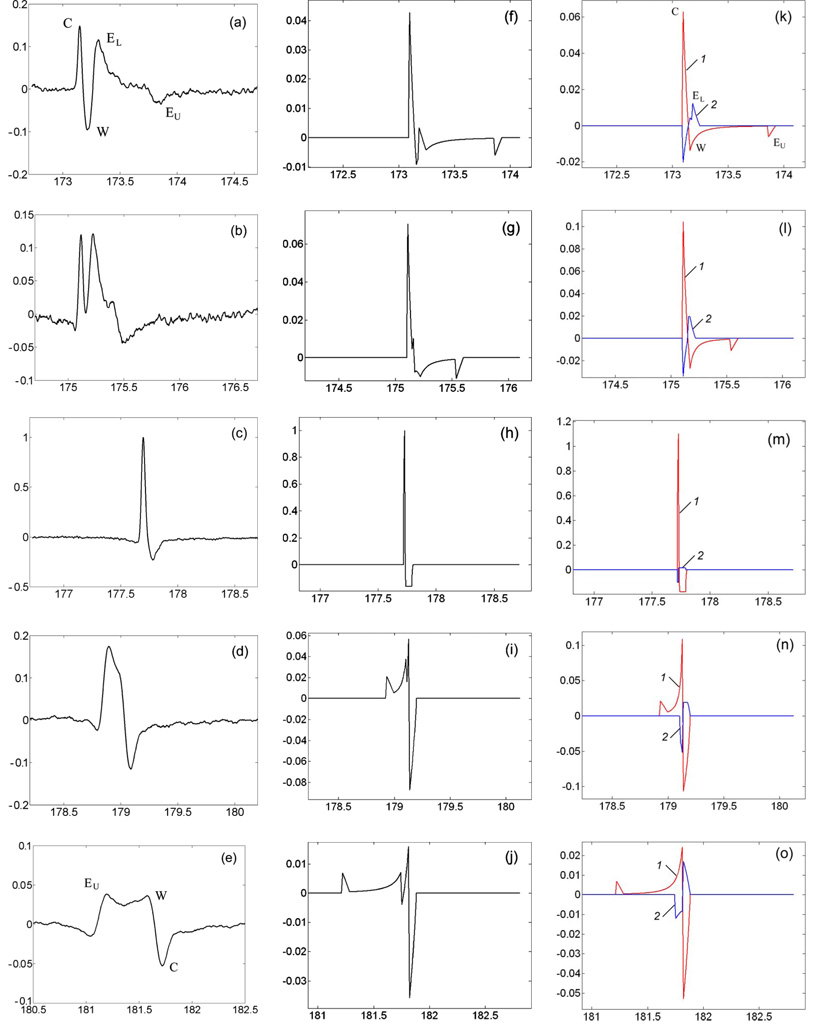
Figure 6 and Figure 7 show representative pressure profiles of the focused shock wave measured at different positions along the z-axis. At F2 a bipolar, asymmetric acoustic pulse comprising of a stronger leading compressive wave, followed by a weaker trailing tensile wave was observed [Fig. 6(c)]. The arrival time of the shock wave was Ta=177.77 µs (see Table III), which corresponds to an average wave propagation speed of 1490 m/ s. Due to focusing the FWHM of the shock wave near F2 was measured to be 24–33 ns, which was significantly reduced from the corresponding value near F1 (see Table I and Table II). At E=9.3% the focused shock wave measured at F2 (waveform is averaged over 30 shots) has a peak positive pressure of 10 MPa with a zero-crossing pulse duration of 0.1 µs and a peak negative pressure of −2.6 MPa with a pulse duration of ~0.2 µs.
FIG. 6.
(Color online) The measured (first column) and simulated (second and third columns) pressure waveforms along z-axis at z= [(a), (f), and (k)] −7, [(b), (g), and (l)] −4, (c) 0, [(h) and (m)] −0.1, [(d), (i), and (n)] 2, and [(e), (j), and (o)] 6 mm. Measurement results are normalized by the measured peak pressure at z=0, E=9.3%, and the simulated results are normalized by the simulated peak pressure at z=−0.1 mm, E=9.3%. The pressure waveform was measured at E=9.3%, PRF=5 Hz, with signal averaging over 30 [(c) and (d)] or 50 [(a), (b), and (e)] shots. The third column shows waveforms both from a complete insert reflector (1) and from the truncated part at the bottom (2).
FIG. 7.
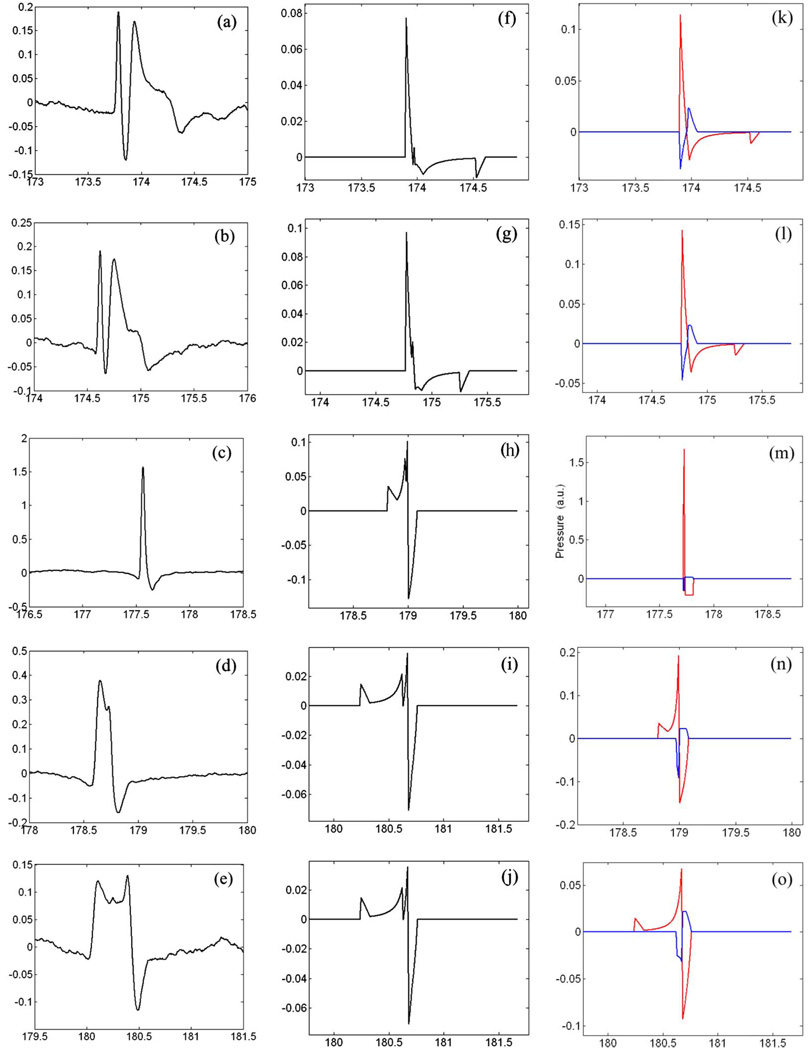
(Color online) The same as Fig. 6 for E=21% at z= [(a), (f), and (k)] −5.8, [(b), (g), and (l)] −4.5, (c) 0, [(h) and (m)] −0.1, [(d), (i), and (n)] 1.8, [(e), (j), and (o)] 4.3 mm.
TABLE III.
Characteristics of the pressure waveforms measured at F2 for different PRFs at E=9.3% (n=30).
| Pulse repetition frequency (PRF) (Hz) | Peak pos. pressure (MPa) | Peak arrival time (ns) | Full width at half maximum FWHM (ns) |
|---|---|---|---|
| 1 | 13.6 ± 1.7 | 177 773 ± 6 | 25.1 ± 2.1 |
| 5 | 15.0 ± 1.8 | 177 769 ± 8 | 24.5 ± 1.6 |
| 9 | 16.8 ± 1.4 | 177 765 ± 6 | 23.9 ± 1.5 |
Away from F2, several features in the evolution of the shock wave profile along the z-axis can be noticed. Prefocally (z<0), the waveform has multiple components corresponding to the central wave (C), the diffracted wave from the lower edge (EL), the wake (W), and the inverted diffracted wave from the upper edge (EU) of the truncated ellipsoidal reflector. A dual positive peak structure is observed [Figs. 6(a) and 6(b)]. Postfocally (z>0), the edge wave takes over both the center wave and the wake [Figs. 6(d) and 6(e)].
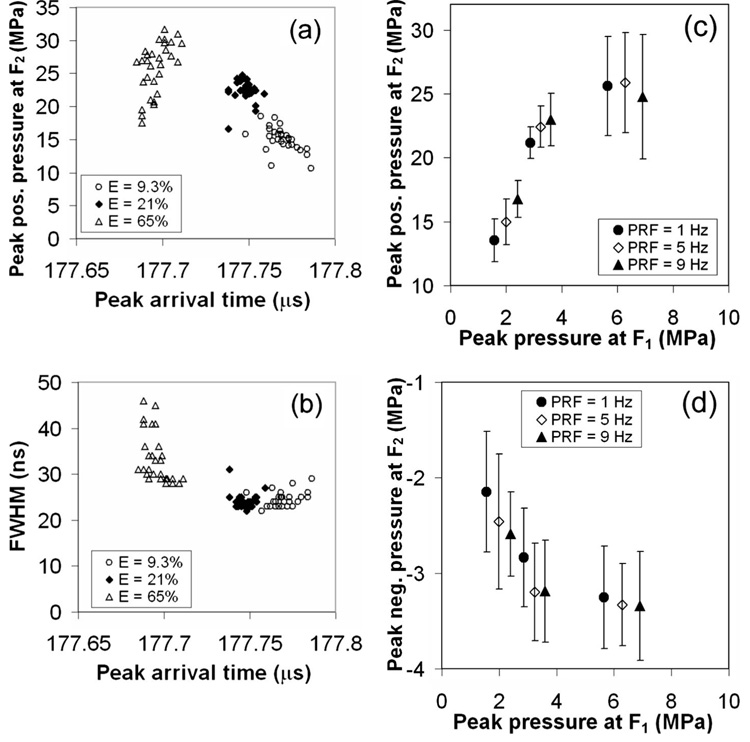
Figures 8(a) and 8(b) show the shot-to-shot variation of the peak positive pressure, FWHM, and shock front arrival time of the focused shock wave estimated using moving average at three different laser energy levels. The corresponding shock wave parameters at F2 are summarized in Table II. Similar to the observations at F1 when the laser energy increases, the peak pressure becomes significantly higher, while the shock wave arrival time reduces slightly [Fig. 8(a)]. In addition, when the laser energy increases from 21% to 65%, the variations in peak positive pressure and FWHM increase from 7.1% to 15% and from 6.6% to 17%, respectively. These results correlate to the instability and the associated random shift in the location of laser-induced optical breakdown at higher energy levels [see Fig. 3(b)]. The peak positive [Fig. 8(c)] and peak negative [Fig. 8(d) pressure at F2 initially increases with the peak pressure at F1 and PRF. However, at higher energy settings the peak pressures are saturated presumably due to the elongation in the geometry of laser-induced plasma [Fig. 3(b)]. The elongated plasma could be considered as several point sources along the major axis of the ellipsoidal reflector near F1. As shown in Fig. 2, the superposition of these displaced shock sources could lead to a focused shock wave at F2 with lower amplitude but longer pulse duration compared to that produced by a single shock wave induced at F1.
FIG. 8.
[(a) and (b)] The shot-to-shot variation (n=30) of pressure parameters measured at F2 at different laser energy levels. The mean with standard deviation of (c) peak positive and (d) peak negative pressure of shock wave at F2 at different energy levels (as represented by the different peak pressures at F1 and pulse repetition frequency (PRF) averaged over n=30 shots. Pressure at F1 was measured at a stand-off distance of 3 mm away from the laser spark.
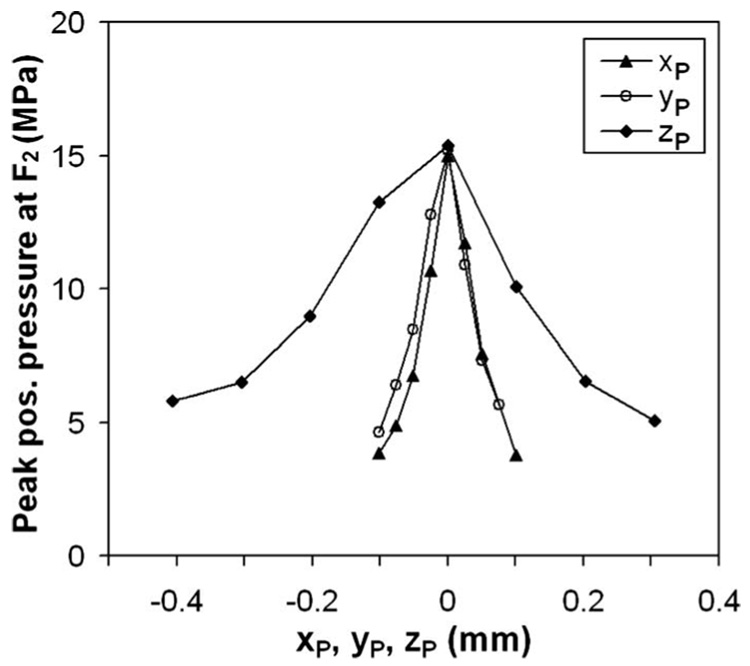
In addition, jitters in the exact location of laser-induced plasma around F1 can lead to reduced focusing gain, lower peak pressure, and shift in focal area. Since the optics are fixed on the wall of the water tank jitter around F1 was modeled by moving both the reflector and the tip of the FOPH simultaneously by a distance of −rP=(−xP,−yP,−zP), which is equivalent to displacing the laser-induced plasma by rP. To ensure sphericity of the shock wave, this experiment was performed at a low energy level of E=9.3%. The results show that displacement of the plasma in either the x or y axis leads to a much more rapid reduction of the peak pressure than in the z-axis (Fig. 9). Jitters in plasma location could also lead to different arrival times of the focused shock wave at F2, and signal averaging from multiple pulses would reduce the measured peak pressure. These factors may contribute to the large variation in peak pressure and FWHM at high energy output levels, as shown in Fig. 8. This finding suggests that in an EH lithotripter deviation of the spark discharge in the first focal plane transverse to the lithotripter axis could significantly reduce the peak pressure at F2 while effectively increasing the focal beam size.
FIG. 9.
Variation of the peak positive pressure measured at F2 in relation to the jitter in the location of laser-induced plasma along either x-, y- or z-axis at F1 (E=9.3%)
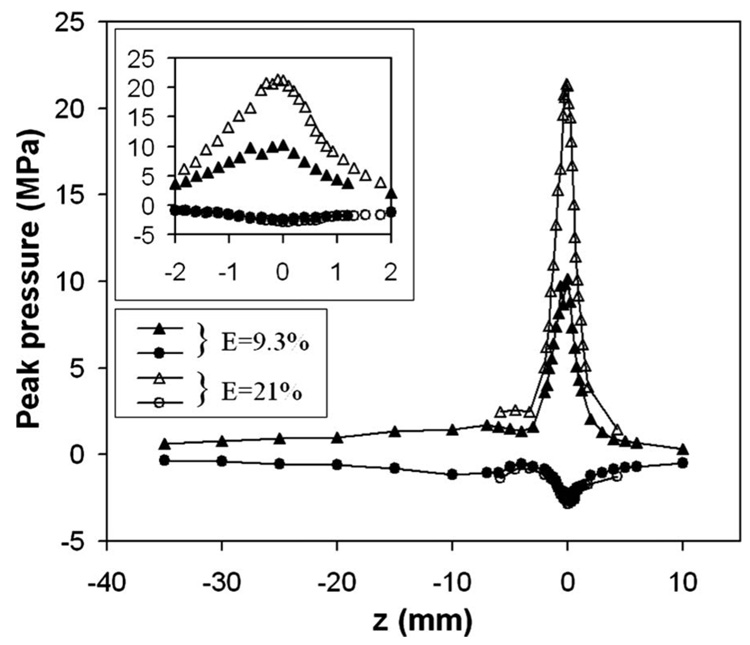
Figure 10 shows the distribution of the peak pressure of the focused shock wave along z-axis at two lower energy settings (i.e., 9.3% and 21%). Although the maximum pressure was found to increase with the laser energy, the location of the positive peak remained unchanged. In contrast to lithotripter field where peak compressive pressure tends to shift postfocally and peak tensile pressure shits prefocally,13 the measured peak pressures appear to coincide with F2 within the measurement uncertainty (±0.2 mm). Moreover, the length of the focal area at F2 was found to increase from 1.6 to 2.0 mm as the laser energy increased (Table II). Interestingly, both the compressive and tensile peak pressures have a local minimum at z=−4 mm (Fig. 10).
FIG. 10.
The positive (triangles) and negative (circles) peak pressure distribution of the focused shock wave along z-axis near F2. Data were taken using signal averaging over 30–64 shots at PRF=5 Hz. A zoomed view around the focal area is shown in the inset.
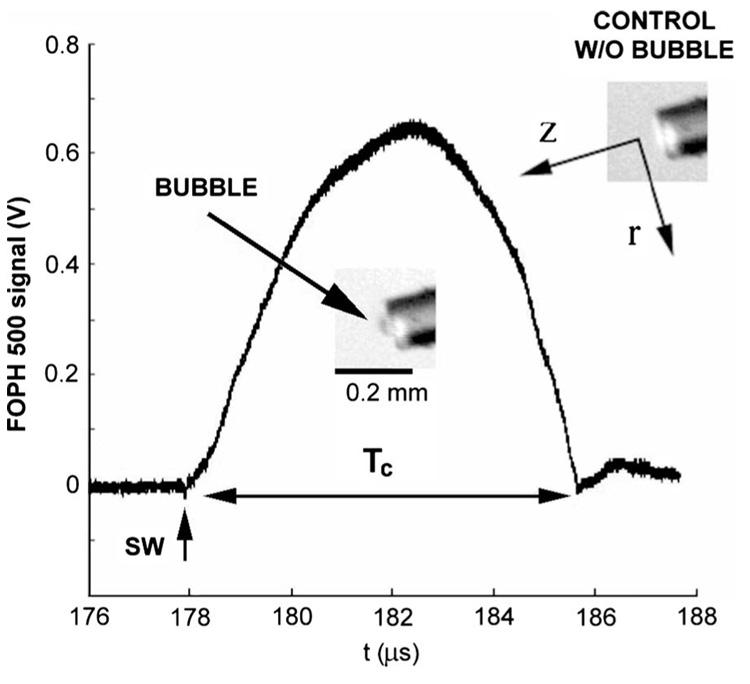
High-speed images, taken by a charge coupled device video camera (GP-MF552, Panasonic, Secaucus, NJ), revealed a detectable microbubble produced at the center of the end face of the FOPH 500 fiber tip (see inset in Fig. 11). The bubble has a maximum dimension of 55×30 µm2 at laser energy E=50% (p+~25 MPa). The main plot in the figure shows the hydrophone signal taken simultaneously, demonstrating a shock wave arrival time of 178 µs, bubble collapse time of ~8 µs and rebound of the bubble after 186 µs. Based on ten independent measurements, the collapse time of the microbubble was found to be in the range of 6.4–8.4 µs by passive cavitation detection using a 3.5 MHz focused transducer (A382S, Panametrics, Waltham, MA).
FIG. 11.
Fiber optic probe hydrophone signal (140 µm fiber diameter) in response to an impinging shock wave and resultant cavitation bubble. Inset: single bubble formed on the end face of the fiber near its maximum expansion following the shock wave impact.
C. Theoretical modeling of the shock wave focusing near F2
The profiles of the laser-induced focused shock wave along the z-axis of the truncated reflector were simulated by using the Hamilton model. The middle column in Fig. 6 shows the resultant waveform for the truncated reflector, while the right column shows two separate waveforms (1) from a complete insert reflector and (2) from the truncated part at the bottom normalized by the peak pressure at z=−0.1 mm for E=9.3%. Because the Hamilton’s model has a singularity at z=0 and the FOPH has a 100 µm core fiber diameter, z=−0.1 mm was chosen when calculating pressure at F2. The primary components of the shock wave, especially the central wave (C), the edge wave (E), and the wake (W), can be clearly seen. Despite the differences in numerical values, the general profiles of the shock wave at different locations agree qualitatively with the experimental measurements [Figs. 6(a)–6(e)]. Because the truncated ellipsoidal reflector has an upper and a lower rim, two edge waves were produced. The edge wave from the lower rim (EL) is closer to the central wave. In comparison, the edge wave from the upper rim (EU) is further away from the central wave before reaching the focal point [Figs. 6(f) and 6(k)]. As the shock wave converges toward F2,EU moves close to C at a faster speed than EL. At z=−4 mm, the peak of EL merges with the peak of the wake, leading to a reduced peak negative pressure [Figs. 6(g) and 6(l)] that was also observed experimentally (see Fig. 10). Beyond the focal point, both the edge wave and the wake invert the phase and overtake the central wave [Figs. 6(j) and 6(o)]. Similar features have been observed in a previous study of the reflector insert using spark discharge from a lithotripter electrode for shock wave generation.7
The results for higher energy level (E=21 and 65%) are shown in the Fig. 7 and Table II, which reveal a linear increase of the peak pressure at z=−0.1 mm with initial laser-induced shock wave pressure at F1 [see Fig. 4(b)] and qualitative agreement of the pressure waveforms along z-axis between the experimental measurement and model calculation.
IV. DISCUSSION
In this study, the focusing of laser-generated shock waves by a truncated brass ellipsoidal reflector in water was investigated. Owing to the consistency in shock wave generation by a focused laser and the short duration of the resultant acoustic pulse (which reduces the likelihood of cavitation inception), pressure waveforms at both foci (F1 and F2 of the ellipsoidal reflector can be reliably measured. The shock wave at F2 consists of a leading compressional phase (p+<32 MPa) with a zero-crossing pulse duration t+=25–33 ns, followed by a trailing tensile phase (p−>−4.3 MPa). In comparison, the corresponding values for the spark-discharge generated shock waves in electrohydraulic shock wave lithotripters are p+=40–50 MPa, t+=1–2 µs, and p−>−10 MPa. The beam size of laser-generated focused shock wave is also significantly smaller (1.6 × 0.2 mm2 in axial and transverse directions) than its counterpart in an EH lithotripter (120 × 12 mm2). It should be noted that the finite size of the hydrophone probe (0.1 mm) could lead to signal averaging and reduced peak pressure measured at F2 when the diameter of hydrophone is comparable to the beam diameter. Therefore the actual beam diameter may be even smaller.
Although the principle of shock wave generation in EH lithotripsy and laser-induced optical breakdown is similar, the first shock wave generated by the spark discharge in an EH lithotripter is much stronger than the second shock wave produced by the collapse of the bubble between the tips of the electrode.28 In comparison, the amplitude of the second shock wave from bubble collapse in laser-based systems is similar to that of the first shock wave produced by the optical breakdown.24 These differences may be caused by the significantly higher amount of electric energy (~16 J) that is deposited in an EH lithotripter, which yields a primary shock wave with higher peak pressure and longer pulse duration than the secondary shock wave produced by the collapse of the bubble, which is nonspherical due to the presence of the electrode tips.
Since the laser-generated shock wave is spherically diverging, the amplitude of the incident shock wave on the reflector surface (Θ=33°) can be estimated to be about 50 kPa with a corresponding focusing gain of ~300. For the most part, the initially divergent and subsequently focusing shock wave travels approximately at sound speed, suggesting that a linear approximation can be reasonably applied to model the wave propagation, except near the focal point. Indeed, Hamilton’s model correctly captures the interpulse time of various wave components although the calculated pressure of the central wave near F2 is several times higher than the measured one (data not shown). The discrepancy is more pronounced at higher laser output energy levels (Table II). It was found that for laser energy below E=21% the peak pressure at F2 increases with the source pressure at F1 (Fig. 8), yet at high energy levels (E>21%) the correlation between pressures at F2 and F1 becomes nonlinear and eventually saturated for both the compressive and tensile peak pressures (Fig. 8). Further increase of the laser output energy leads to increased pulse amplitude and pulse duration at F1, which would result in larger focus size based on linear diffraction theory [Eq. (1)]. In addition, nonlinear refraction and absorption limit the pressure gain at F2 especially for high amplitude waves. Elongation of laser plasma at high energy levels also spreads the acoustic energy to a large area, leading to a reduced pressure gain at F2 (Fig. 9). Hence, for validation of theoretical models, a low energy setting with resultant spherical bubble in the laser-induced shockwave system should be used.
The asymmetric effect of the jitter orientation on resultant pressure reduction at F2 (see Fig. 9) indicates that in an HM-3 where the electrode axis is tilted at 76° from the reflector axis (which is close to the most sensitive direction of 90°), the enlarged gap between the electrode tip as treatment progresses may produce a significant reduction of the peak pressure at F2 with a concomitantly increased beam size. In comparison, the electrode in most of the newer generation electrohydraulic shock wave lithotripters is aligned with the reflector axis (which is in the least sensitive direction of 0°). Therefore, the jitter due to enlarged gap of the electrode in the newer EH lithotripters may have a less significant impact on beam size change at F2.
Laser-generated shock waves may not be suitable for clinical lithotripsy because of the strong absorption of high frequency acoustic waves in biological tissues, which limits the penetration depth of the wave. Interestingly, fragmentation of rosin stone in water by laser-generated shock waves has been demonstrated by Musatov.29 Their results support spallation as a potential mechanism of stone fragmentation. Because cavitation produced by laser-induced shock waves is weak30 and the resultant maximum bubble radius is less than 0.1 mm (Fig. 11), such shock waves may be valuable for investigating the propagation and interaction of stress waves in stone phantoms by photoelastic imaging31 with minimal interference from cavitation bubbles. The short duration of laser-induced shock wave should significantly increase the resolution of the photoelastic image. Alternatively, the microbubbles produced by laser-induced shock wave may provide a useful means for investigating bubble-cell interaction in the context of cavitation-mediated drug and gene delivery.
ACKNOWLEDGMENTS
This work was supported in part by NIH through Grant Nos. RO1-DK52985 and S10-RR16802.
References
- 1.Chaussy CG, Fuchs GJ. Current state and future-developments of noninvasive treatment of human urinary stones with extracorporeal shock-wave lithotripsy. J. Urol. (Baltimore) 1989;141:782–789. doi: 10.1016/s0022-5347(17)41010-x. [DOI] [PubMed] [Google Scholar]
- 2.Lingeman JE. Extracorporeal shock wave lithotripsy - Development, instrumentation, and current status. Urol. Clin. North Am. 1997;24:185–211. doi: 10.1016/s0094-0143(05)70363-3. [DOI] [PubMed] [Google Scholar]
- 3.Lingeman JE, Kim SC, Kuo RL, McAteer JA, Evan AP. Shockwave lithotripsy: Anecdotes and insights. J. Endourol. 2003;17:687–693. doi: 10.1089/089277903770802191. [DOI] [PubMed] [Google Scholar]
- 4.Fuselier HA, Prats L, Fontenot C, Gauthier A. Comparison of mobile lithotripters at one institution: Healthtronics Lithotron (TM), Dornier MFL-5000, and Dornier Doli. J. Endourol. 1999;13:539–542. doi: 10.1089/end.1999.13.539. [DOI] [PubMed] [Google Scholar]
- 5.Gerber R, Studer UE, Danuser H. Is newer always better? A comparative study of 3 lithotrlptor generations. J. Urol. (Baltimore) 2005;173:2013–2016. doi: 10.1097/01.ju.0000158042.41319.c4. [DOI] [PubMed] [Google Scholar]
- 6.Graber SF, Danuser H, Hochreiter WW, Studer UE. A prospective randomized trial comparing 2 lithotriptors for stone disintegration and induced renal trauma. J. Urol. (Baltimore) 2003;169:54–57. doi: 10.1016/S0022-5347(05)64033-5. [DOI] [PubMed] [Google Scholar]
- 7.Zhou YF, Zhong P. Suppression of large intraluminal bubble expansion in shock wave lithotripsy without compromising stone comminution: Refinement of reflector geometry. J. Acoust. Soc. Am. 2003;113:586–597. doi: 10.1121/1.1528174. [DOI] [PubMed] [Google Scholar]
- 8.Xi XF, Zhong P. Improvement of stone fragmentation during shock-wave lithotripsy using a combined EH/PEAA shock-wave generator - In vitro experiments. Ultrasound Med. Biol. 2000;26:457–467. doi: 10.1016/s0301-5629(99)00124-6. [DOI] [PubMed] [Google Scholar]
- 9.Zhong P, Zhou YF. Suppression of large intraluminal bubble expansion in shock wave lithotripsy without compromising stone comminution: Methodology and in vitro experiments. J. Acoust. Soc. Am. 2001;110:3283–3291. doi: 10.1121/1.1416906. [DOI] [PubMed] [Google Scholar]
- 10.Sokolov DL, Bailey MR, Crum LA. Dual-pulse lithotripter accelerates stone fragmentation and reduces cell lysis in vitro. Ultrasound Med. Biol. 2003;29:1045–1052. doi: 10.1016/s0301-5629(03)00887-1. [DOI] [PubMed] [Google Scholar]
- 11.Hamilton MF. Transient axial solution for the reflection of a spherical wave from a concave ellipsoidal mirror. J. Acoust. Soc. Am. 1993;93:1256–1266. [Google Scholar]
- 12.Averkiou MA, Cleveland RO. Modeling of an electrohydraulic lithotripter with the KZK equation. J. Acoust. Soc. Am. 1999;106:102–112. doi: 10.1121/1.427039. [DOI] [PubMed] [Google Scholar]
- 13.Zhou YF, Zhong P. The effect of reflector geometry on the acoustic field and bubble dynamics produced by an electrohydraulic shock wave lithotripter. J. Acoust. Soc. Am. 2006;119:3625–3636. doi: 10.1121/1.2195074. [DOI] [PMC free article] [PubMed] [Google Scholar]
- 14.Tanguay M, Colonius I. Fourth International Symposium on Cavitation, CAV2001. USA: Pasadena; 2001. Numerical simulation of bubble cavitation flow in shock wave lithotripsy. [Google Scholar]
- 15.Tanguay M, Colonius T. Fifth International Symposium on Cavitation, CAV2003. Japan: Osaka; 2003. Progress in modeling and simulation of shock wave lithotripsy (SWL) [Google Scholar]
- 16.Szeri A. Numerical modeling of shock wave focusing and bubble dynamics. personal communication. 2006 [Google Scholar]
- 17.Iloreta JI, Zhou YF, Sankin GN, Zhong P, Szeri AJ. Assessment of shock wave lithotripters via cavitation potential. Phys. Fluids. 2007;19:086103. doi: 10.1063/1.2760279. [DOI] [PMC free article] [PubMed] [Google Scholar]
- 18.Lindau O. Ph.D. thesis. Georg-August-Universität; 2001. Untersuchungen zur lasererzeugten Kavitation. (Ger). [Google Scholar]
- 19.Akhatov I, Lindau O, Topolnikov A, Mettín R, Vakhitova N, Lauterborn W. Collapse and rebound of a laser-induced cavitation bubble. Phys. Fluids. 2001;13:2805–2819. [Google Scholar]
- 20.Buzukov AA, Popov YA, Teslenko VS. Experimental study of explosion caused by focusing monopulse laser radiation in water. Zh. Prikl. Mekh. Tekh. Fiz. 1969;10:17–24. [Google Scholar]; J. Appl. Mech. Tech. Phys. 1972;10:701–708. [Google Scholar]
- 21.Noack J, Vogel A. Single-shot spatially resolved characterization of laser-induced shock waves in water. Appl. Opt. 1998;37:4092–4099. doi: 10.1364/ao.37.004092. [DOI] [PubMed] [Google Scholar]
- 22.Vogel A, Nahen K, Theisen D, Noack J. Plasma formation in water by picosecond and nanosecond Nd:YAC laser pulses. 1. Optical break-down at threshold and superthreshold irradiance. IEEE J. Sel. Top. Quantum Electron. 1996;2:847–860. [Google Scholar]
- 23.Christensen DA. Ultrasonics Bioinstrumentation. New York: Wiley; 1988. [Google Scholar]
- 24.Sankin GN, Simmons WN, Zhu SL, Zhong P. Shock wave interaction with laser-generated single bubbles. Phys. Rev. Lett. 2005;95:034501. doi: 10.1103/PhysRevLett.95.034501. [DOI] [PMC free article] [PubMed] [Google Scholar]
- 25.Sud’enkov YV, Ivanov EV. Experimental study of the focusing of submicrosecond pressure pulses in liquids. Tech. Phys. 1998;43:714–719. [Google Scholar]
- 26.Musatov AG, Rudenko OV, Sapozhnikov OA. Nonlinear refraction and nonlinear absorption in the focusing of high-intensity pulses. Sov. Phys. Acoust. 1992;38:274–279. [Google Scholar]
- 27.Noack J, Vogel A. Laser-induced plasma formation in water at nanosecond to femtosecond time scales: Calculation of thresholds, absorption coefficients, and energy density. IEEE J. Quantum Electron. 1999;35:1156–1167. [Google Scholar]
- 28.Coleman AJ, Choi MJ, Saunders JE, Leighton TG. Acousticemission and sonoluminescence due to cavitation at the beam focus of an electrohydraulic shock-wave lithotripter. Ultrasound Med. Biol. 1992;18:267–281. doi: 10.1016/0301-5629(92)90096-s. [DOI] [PubMed] [Google Scholar]
- 29.Musatov AG. Destruction of solids by powerful ultrasonic pulses. Acoust. Phys. 1995;41:100–104. [Google Scholar]
- 30.Niemz MH, Lin CP, Pitsillides C, Cui J, Doukas AG, Deutsch TF. Laser-induced generation of pure tensile stresses. Appl. Spectrosc. 1997;70:2676–2678. [Google Scholar]
- 31.Xi XF, Zhong P. Dynamic photoelastic study of the transient stress field in solids during shock wave lithotripsy. J. Acoust. Soc. Am. 2001;109:1226–1239. doi: 10.1121/1.1349183. [DOI] [PubMed] [Google Scholar]


