

Abstract
We have characterized initial canonical responses to two environmental toxicants, cadmium (Cd) and benzo[a]pyrene (B[a]P), in a novel in vitro model derived from renal proximal tubule epithelial cells (RPTEC) of a healthy human donor. The RPTEC/TERT1 cell line has been immortalized using the human telomerase reverse transcriptase (hTERT) subunit only and does not exhibit chromosomal abnormalities. RPTEC/TERT1 cells were exposed to single-compound and binary mixtures of Cd and B[a]P, known or suspected renal toxicants respectively. Cells exhibited cytotoxicity to concentrations of B[a]P and Cd as low as 1 nm and 3 μM, respectively. RPTEC/TERT1 cells exhibited compound-specific gene expression responses when exposed to 0.01–1 μM B[a]P and 0.1–10 μM Cd. A significant increase in the expression of genes coding for B[a]P metabolizing enzymes (CYP1A1, CYP1B1) occurred in a dose and time dependent manner at 3, 6, and 24 h post exposure. Likewise, a significant increase in the heavy metal responsive gene MT2A was observed following exposure to Cd. The EROD activity assay confirmed significant increases in CYP1(A/B) activity after 24 h of exposure to B[a]P which was not affected by the presence of Cd. Co-exposure to low concentrations of Cd and B[a]P were consistent with changes in gene expression as seen with single-compound exposures. These experiments are the first to provide information regarding toxicological responses in the RPTEC/TERT1 cell line that model those of the target tissue. We conclude that these cells can provide a useful tool for future toxicological studies.
Keywords: RPTEC/TERT1, In vitro immortalized renal cell, Tox21, Benzo[a]pyrene, Cadmium
1. Introduction
According to the National Cancer Institute and the National Institute of Diabetes and Digestive and Kidney Diseases, the incidences of renal cell carcinoma (RCC), chronic kidney disease, and end-stage renal failure are significantly and steadily increasing [34,18]. Approximately 10% of the U.S. adult population suffers from renal diseases. Collectively, these diseases are etiologically complex with environmentally mediated risk factors contributing to an estimated 90% of cases. To address this gap in our understanding, the Tox21 initiative has set forth goals to develop improved in vitro models with which to investigate human conditions, such as renal disease, that may be promoted by toxicant exposure [33].
In accordance with the Tox21 initiative, we have proposed to characterize immortalized renal cells that are toxicological targets of environmental chemicals in the human kidney. Specifically, the renal proximal tubule epithelial cells (RPTEC) in the kidney are a principal target site of chemical and elemental toxicity [3,22]. We have examined metabolic responses to two model environmental toxicants in a novel, genetically modified human renal cell line, RPTEC/TERT1, derived from a normal, healthy renal proximal tubule donor [36]. The RPTEC/TERT1 cell line has been immortalized using the catalytic subunit of human telomerase reverse transcriptase (hTERT), the endogenous enzyme responsible for telomere stabilization. Wieser et al. [36] have confirmed the functional similarity of the RPTEC/TERT1 cell line to that of proximal tubule cells in the body by demonstrating that they exhibit a normal, stable male diploid karyotype and prototypical RPTEC structural and biochemical properties through more than 90 population doublings [36]. While primary RPTECs derived from normal, healthy, human tissue are the best models under certain, specific experimental protocols, primary cells undergo replicative senescence in culture. These properties make them difficult if not impossible for many experimental protocols including chronic exposure or long-term studies. The RPTEC/TERT1 cell line does not undergo replicative senescence overcoming these limitations of primary RPTECs. Furthermore, primary RPTECs are often isolated from diseased patients, which may influence their ability to model the normal, healthy tissue. The near-normal properties of this cell line suggest that it may provide a promising new model with which to study the toxicant-induced mechanisms of renal disease and cancer.
In this study, we investigated transcriptional and metabolic responses to benzo[a]pyrene (B[a]P), a representative polycyclic aromatic hydrocarbon (PAH), and cadmium (Cd), a toxic heavy metal, in the RPTEC/TERT1 cell line. B[a]P, generated by the incomplete combustion of organic material, is an environmental carcinogen that may play a role in renal cell carcinogenesis. Studies suggest that increased B[a]P exposure through diet, environment, and/or cigarette smoking can more than double one's risk for developing RCC [8,10,11]. B[a]P is rapidly bioactivated in the body to reactive epoxide intermediates in the liver and other organs including the proximal tubule of the kidney. Bioactivation occurs primarily through cytochrome P450 enzymes, CYP1A1/2 and CYP1B1, and microsomal epoxide hydrolase (EPHX1) [22,31,37]. These toxic metabolites readily react with cellular macromolecules. Glutathione conjugation leads to metabolite detoxification. However, B[a]P metabolites also bind DNA directly, forming bulky adducts [23,32]. If these lesions not repaired properly, mutations may develop.
Cd is a well-known nephrotoxicant and suspected renal cell carcinogen [20,29,35]. Cd is transported to the kidney bound to small proteins such as metallothioneins. Nephrotoxicity occurs when the Cd-metallothionein complex is reabsorbed in the proximal tubule where the metallothionein is degraded freeing Cd [4,29]. Cd is not metabolized, has a long biological half-life, and bioaccumulates primarily in the liver and kidneys [13,21]. Chronic effects of Cd exposure may be evident in Cd's ability to promote cellular oxidative stress as well as inhibit DNA repair, thus increasing the mutagenicity of genotoxicants [1,9,15]. Both B[a]P and Cd are found in the diet, environment, and tobacco smoke, with each considered as contributing risk factors to the development of RCC [8,17,24].
To explore the potential mechanisms by which these toxicants promote carcinogenesis, we treated RPTEC/TERT1 cells with defined concentrations of B[a]P and Cd separately and in combination. We measured specific toxicological responses and changes in the expression of genes encoding key biotransformation enzymes and metal binding proteins as well as selected functional differences in biotransformation activity. We hypothesize that RPTEC/TERT1 cells which exhibit structural, biochemical, and functional properties comparable to normal, healthy RPTECs will respond to these xenobiotics and provide an improved model for future studies.
2. Materials and methods
2.1. Cell culture
RPTEC/TERT1 cells and culture medium were purchased from Evercyte Laboratories (Vienna, Austria) and cultured according to the vendor's instructions. RPTEC/TERT1 cells were passaged approximately once or twice per week and subcultured at a 1:2 or 1:3 ratio. Human Kidney 2 (HK-2) cells, used for comparative purposes, were purchased from ATCC (Manassas, VA) and cultured according to the vendor's instructions. All cells were cultured at 37 °C in a humidified atmosphere containing 5% CO2.
2.2. Chemicals
All chemicals and enzymes were purchased from Sigma–Aldrich, USA unless noted otherwise. Cadmium chloride (CdCl2, 202908) was dissolved in fresh complete medium and delivered at 0.1% of the final culture volume to yield the appropriate target concentrations. Benzo[a]pyrene (B[a]P, B1760) was dissolved in dimethyl sulfoxide (DMSO, D8418) and delivered at 0.05% of the final culture volume to yield the appropriate target concentrations. B[a]P preparations and exposures were carried out and conducted under low light conditions.
2.3. Cytotoxicity
Cells were seeded at 10,000 cells per well and exposed in 96-well microplate format to either Cd or B[a]P for the duration of the experimental time point. Methylthiazolyldiphenyl-tetrazolium bromide (MTT, Sigma, M5655) was used to assess cell viability. MTT was reconstituted to 5 mg/mL in phenol red free basal medium and delivered at 10% volume directly to microplates. Cells were incubated at 37 °C in a humidified atmosphere of 5% CO2 with MTT for 3 h to allow the formation of formazan crystals. After incubation, cells were lysed with an equal volume of solubilizing solution (10% Triton X-100, 0.1 N HCl, isopropanol) and absorbance read at 570/690 nm. Viabilities are expressed as percent of untreated control for Cd-exposed cells and percent of DMSO vehicle control for B[a]P-exposed cells.
2.4. Gene expression
RPTEC/TERT1 cells were grown to confluence in 60 mm dishes and exposed to Cd or B[a]P as described above. Cells were exposed in biological triplicates for each concentration and time point examined. Total RNA was isolated from cells after appropriate time points using the QIAshredder (QIAGEN, 79656) and RNeasy extraction kit (QIAGEN, 74136) following the manufacturer's instruction. RNA concentration and purity was assessed using a Thermo Scientific Nanodrop 2000c spectrophotometer. RNA samples were diluted to 0.5 μg/μL in nuclease-free water.
Two microliters of each RNA sample were used for cDNA synthesis reactions to deliver 1 μg template in a 20 μL total reaction volume. cDNA was synthesized using iScript cDNA synthesis (BioRad, 170-8891) protocol as follows: 5 min at 25 °C, 30 min at 42 °C, and 5 min at 85 °C. RNA templates and cDNA were stored at −20 °C until use. Gene expression was determined using primer-probe sets from Applied Biosystems® TaqMan® Gene Expression Assays. Actin, beta (ACTB) was used as a reference gene. A complete list of primers used are listed in Table 1. The thermal cycling protocol followed the manufacturer's instructions: 50 °C for 2 min and 95 °C for 10 min followed by 40 cycles of 95 °C for 15 s and 60 °C for 1 min. Reactions were conducted in 20 μL volumes with each sample being run in duplicate. All reactions were carried out using a BioRad C1000™ thermal cycler equipped with a CFX96™ Real-Time PCR Detection System.
Table 1.
Primer-probe sets used for normalized, relative quantitative PCR for the genes under study. Pre-designed TaqMan® gene expression assays from Applied Biosystems® were used to quantify gene expression. To minimize the influence of residual genomic DNA contamination, genomic DNA elimination using the QIAGEN method during RNA isolation. Additionally, where possible, primer-probe sets spanning multiple exons were used to further reduce potential for genomic DNA interference.
| Gene ID | Gene function | Gene location | Assay ID |
|---|---|---|---|
| CYP1A1 | Phase I metabolism | 15q24.1 | Hs00153120_m1 |
| CYP1B1 | 2p22.2 | Hs00164383_m1 | |
| EPHX1 | 1q42.12 | Hs01116806_m1 | |
| GSTT1 | Phase II metabolism | 22q11.23 | Hs00184475_m1 |
| GSTM1 | 1p13.3 | Hs02341469_m1 | |
| XPA | DNA damage repair | 9q22.33 | Hs00166045_m1 |
| MT1A | Metal binding | 16q12.2 | Hs00831826_s1 |
| MT2A | 16q12.2 | Hs02379661_g1 | |
| ACTB | Reference | 7p22.1 | Hs99999903_m1 |
2.5. Genotyping
Genomic DNA was isolated from healthy, untreated RPTEC/TERT1 cells using a standard phenol:chloroform DNA extraction procedure. Briefly, cell pellets were incubated with Tris-EDTA (TE) buffer, RNaseT1, mRNAse A, and sodium dodecyl sulfate (SDS) for 45 min at 37 °C. Next, pellets were then incubated with proteinase K for 60 min at 60 °C and then overnight at 37 °C. Deproteinized DNA was extracted using the 5 PRIME Phase Lock Gel light method in 15 ml tubes (Fisher-Scientific, Pittsburg, PA), to increase the yield from the aqueous phase. Precipitated DNA was spooled onto a glass pipette, transferred to 70% ethanol, and collected by centrifugation (14,000 rpm for 10 min). Ethanol was decanted and DNA was allowed to dry completely before reconstituting in sterile, DNA-grade water. DNA concentration and purity was assessed using a Thermo Scientific Nanodrop 2000c spectrophotometer.
RPTEC/TERT1 genomic DNA was provided to the Coriell Institute for Medical Research (Camden, NJ) and genotyped using the Affymetrix GeneChip™ Genome-Wide Human SNP Array 6.0 and the Affymetrix DMET™ Drug Metabolism Array. See supplemental material for genotyping results.
2.6. CYP1(A/B) enzymatic activity
To assess enzymatic activity and functional response to exposure, RPTEC/TERT1 cells were treated at confluence in 12-well tissue culture treated plates. After exposure time points, cells were washed twice with cold 1× phosphate buffered saline (PBS) and stored in sealed 12 well plates at −80 °C for a minimum of 24 h before ethoxyresorufin-O-deethylase (EROD) activity assay was determined.
Previously exposed and frozen cells, in 12-well plate formats, were removed from −80 °C storage and thawed rapidly in a water bath at 37 °C then placed directly on ice for approximately 2 min. This freeze/thaw cycle was repeated twice to ensure permeability of cell membranes. A stock solution of EROD reaction mix was prepared in 50 mM Tris to deliver 100 μL volumes to each well with the following concentrations: 5 μM 7-ethoxyresorufin, 0.5 mM NADPH, and 1 mg/mL bovine serum albumin (Jackson ImmunoResearch Laboratories, Inc., West Grove, PA). Cells were incubated at 37 °C in a standard cell culture incubator for 1 h with EROD reaction mix. An eight point standard curve was made by diluting resorufin from 0.098 ng resorufin at 1:2 dilutions in 15% methanol: 85% 60 mM Tris (pH 7.1–7.4).
After incubation, 90 μL EROD reaction mix was removed from each replicate of the 12-well plate (n = 3 per treatment group) and added to an optically clear, 96-well microplate to which 70 μL 2 M glycine had been added to stop the reaction. Standards were prepared in the same way with 90 μL standard and 70 μL 2M glycine (n = 3 for each dilution point). Fluorescence was read immediately using a Tecan Infinite® 200 PRO multimode microplate reader, Tecan (San Jose, CA), at 535 excitation/570 emission. Resorufin was calculated for samples based on the standard curve. Values were calculated as pg resorufin/mg protein for each sample and expressed as percent of respective control (or vehicle) treated group. Points represent mean percent pg resorufin/mg protein ± SEM.
2.7. Metallothionein protein expression
Metallothionein (MTI/II) protein expression was determined by immunoblotting using a modified Western method [7]. Cells were plated in 100 mm dishes at 100,000 cells per ml, in a 10 ml total volume and exposed to Cd for defined time points. Protein was isolated and quantified using the Bradford assay [5]. 50 μg of protein was loaded on AnykD gels (Bio-Rad), transferred to PVDF membranes, and probed with primary antibodies overnight. The following primary antibodies were used from Abcam® (Cambridge, MA): MTI/II, mouse monoclonal, ab12228, and Actin, mouse monoclonal, ab8224. Excess primary antibody was removed the next day and the secondary antibody, goat anti-mouse (IR 680, LI-COR, Lincoln, NE) were applied for 1 h. Membranes were washed and visualized using a LI-COR Odyssey Imaging System. Band density was quantified using ImageJ software, normalized to actin, and expressed as percent of untreated control for each time point [27].
2.8. Statistical analysis
One-way and two-way ANOVAs were performed using the GraphPad Prism analytical software, version 6.0 (San Diego, California). Data for the MTT viability assays were analyzed using a one-way ANOVA and Dunnett's multiple comparison test. Data for gene expression was analyzed using a two-way ANOVA and Tukey's post hoc test. An alpha of 0.05 was used as the criteria for determining significance.
General linear models were used to test for differences among treatments, treatment groups, and timepoints for the EROD activity assay endpoints investigated. Where the initial GLM analysis of variance (GLM-ANOVA) indicated a significant difference, post hoc mean comparisons were conducted using a Dunnett's correction. Statistical testing was conducted using IBM SPSS Statistics version 19 software (Armonk, New York). An alpha of 0.05 was used as the criteria for determining significance.
3. Results
3.1. RPTEC/TERT1 cells demonstrate sensitivity to low concentrations of Cd and B[a]P
In order to determine if RPTEC/TERT1 cells were sensitive to the two renal toxicants, Cd and B[a]P, cells were exposed to each in a 96-well microplate format. After 24 h, 48 h, or 1-week of exposure, cytotoxicity was assessed using the MTT viability assay for each toxicant. Viability assessments were used to determine both RPTEC/TERT1 sensitivity and appropriate, sub-toxic concentrations for future experiments.
3.2. Cd induced cytotoxicity in RPTEC/TERT1 cells
After a 24-h exposure to Cd, RPTEC/TERT1 cells demonstrated significantly decreased viabilities at 15 and 30 μM Cd with viabilities at 74.2 and 49.0% of untreated controls, respectively (Fig. 1A). After a 48-h Cd exposure, all concentrations, with the exception of 1 μM Cd, were significantly cytotoxic when compared to untreated cells (Fig. 1B). However, after 1 week, cells showed recovery, or stabilization in viability as in the case of 3 μM Cd, from the previously assessed time point for all concentrations except for groups treated with either 15 μM or 30 μM Cd. At the highest concentration, 30 μM Cd, cell viability continued to decline with a final viability of less than 5% of the untreated controls (Fig. 1C).
Fig. 1.

Concentration- and time-dependent effects of Cd on the viability of RPTEC/TERT1 cells after (A) 24 h, (B) 48 h and (C) 1 week of Cd exposure. Viabilities are expressed as percent of untreated control, 0 μM, at each time point as indicated by the MTT viability assay. Bars represent mean viability (n = 8) ± SEM, * indicates significant difference from 0 μM at each respective time point, p < 0.001, and # indicates significant difference from 0 μM at each respective time point, p < 0.05.
3.3. B[a]P induced cytotoxicity in RPTEC/TERT1 cells
B[a]P significantly reduced cell viability after a 24-h exposure at concentrations as low as 0.001 μM with viability at 84.1% of the DMSO-treated control cells, p < 0.001 (Fig. 2A). Because viabilities were significantly affected over a wide range of concentrations, 0.001 μM to 10 μM B[a]P, cells were exposed to 1 × 10⁻²¹ μM B[a]P to explore a non-cytotoxic concentration. Treatment with 1 × 10⁻²¹ μM B[a]P did not significantly reduce cell viabilities at any time point (Fig. 2A-C). After a 48-h exposure to B[a]P, RPTEC/TERT1 cell viabilities continued to decline with viabilities below 62%, p< 0.01 (Fig. 2B). Although cells appeared to recover after the 48-h exposure time point, viabilities remained significantly reduced after 1 week following the initiation of B[a]P exposure (Fig. 2C).
Fig. 2.

Concentration- and time-dependent effects of B[a]P on the viability of RPTEC/TERT1 cells after (A) 24 h, (B) 48 h and (C) 1 week of B[a]P exposure. Viabilities are expressed as percent of vehicle control, DMSO, at each time point as indicated by the MTT viability assay. Bars represent mean viability (n = 8) ± SEM, * indicates significant difference from DMSO, p < 0.001,† indicates significant difference from DMSO, p < 0.01, # indicates significant difference from DMSO, p < 0.05.
3.4. Cd and B[a]P stimulate compound-specific changes in gene expression in RPTEC/TERT1 cells
Next we selected key genes to characterize changes in RPTEC/TERT1 cells in response to specific concentrations of B[a]P or Cd at 3, 6, and 24 h post-exposure. Refer to Table 1 for gene ID listing and assay information. Although GSTM1 and GSTT1 expression was examined at all concentrations and time points, neither genes were detected by RT-PCR (data not shown). Our analysis of XPA at all concentrations and time points showed constitutively expressed levels of the gene that were not significantly altered by any treatment or time point (data not shown).
We examined Phase I metabolic enzyme gene expression in the RPTEC/TERT1 cell line after exposure to B[a]P or Cd. RPTEC/TERT1 cells showed concentration- and time-dependent changes in CYP1A1 (Fig. 3A) and CYP1B1 (Fig.3C) gene expression after exposure to B[a]P but not Cd (Fig. 3F and G). Expression of CYP1A1 was not detected in the absence of B[a]P treatment. However, CYP1A1 gene expression was most significantly upregulated after 3 h of B[a]P exposure with levels declining toward baseline after 24 h (Fig. 3A). CYP1B1 gene expression was constitutive in RPTEC/TERT1 cells with induction increasing most significantly after 24 h of exposure to 1 μM B[a]P (Fig. 3C). Similar to CYP1A1 gene expression, all concentrations of B[a]P examined induced a CYP1B1 expression response. Gene expression of EPHX1 was constitutive in RPTEC/TERT1 cells, but no significant changes in gene expression were observed after any treatment or time point (Fig. 3E and H). HK-2 cells, a virally transformed human proximal tubule epithelial cell line, were used for comparative purposes. HK-2 cells exhibited constitutive, low level expression of CYP1A1 and CYP1B1; however, there was no significant concentration or time dependent change in CYP1A1 or CYP1B1 at 3, 6, or 24 h after B[a]P exposure (Fig. 3B and D).
Fig. 3.
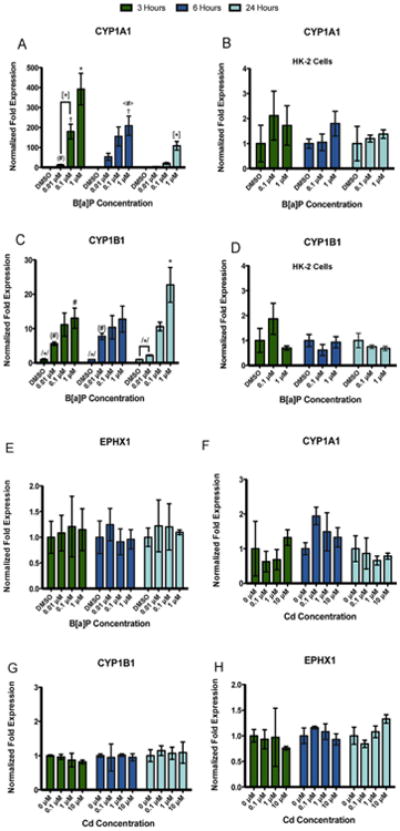
Compound-specific as well as concentration- and time-dependent changes in gene expression are observed in phase I metabolic enzymes in RPTEC/TERT1 cells but not HK-2 cells. RPTEC/TERT1 cells were treated with B[a]P or Cd for 3, 6, and 24 h. HK-2 cells were exposed to B[a]P for 3, 6, and 24 h for comparative purposes. (A) CYP1A1 and (C) CYP1B1 gene expression increased significantly after exposure to B[a]P in RPTEC/TERT1 cells at all time points while HK-2 cells showed no response to B[a]P after any time point (B) and (D). There were no significant changes in (E) EPHX1 gene expression detected after B[a]P treatment. Additionally, no significant changes in gene expression were detected in (F) CYP1A1, (G) CYP1B1, or (H) EPHX1 after Cd treatment at any time point or concentration. Bars represent mean fold expression (n = 3) ± SEM. All genes of interest were normalized to ACTB. Expression of genes in the DMSO or 0 μM control groups, where denoted, was set to 1. * Indicates significant difference from DMSO or 0 μM controls at each respective time point, p < 0.001,† indicates significant difference from DMSO or 0 μM controls at each time point, p < 0.01, # indicates significant difference from DMSO or 0 μM controls at each time point, p < 0.05, [*] indicates significant difference from 1 μM B[a]P at 3 h, p < 0.001, /*/ indicates significant difference from 1 μM B[a]P at 24h, p < 0.001, (#) indicates significant difference from 0.1 μM B[a]P at 3 h, p < 0.05, <#> indicates significant difference from 1 μM B[a]P at 3 h, p < 0.05, and {#} indicates significant difference from 1 μM B[a]P at 24 h, p < 0.05.
Gene expression of the canonical heavy metal binding proteins, metallothionein (MT1A and MT2A), was determined after exposure to B[a]P or Cd. Significant differences in MT1A and MT2A were detected after Cd exposure (Fig. 4A and B) but not after B[a]P exposure (Fig. 4C and D).
Fig. 4.
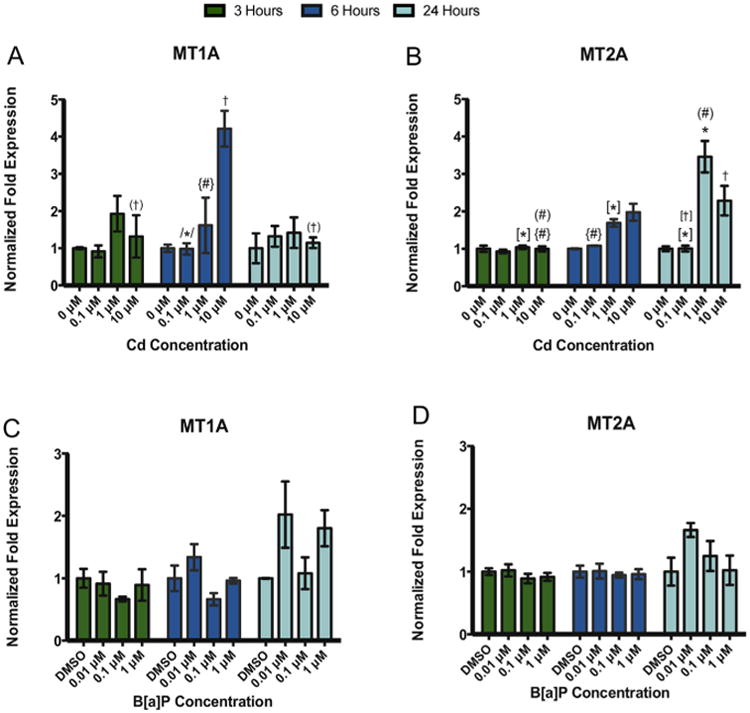
Treatment with Cd but not B[a]P resulted in significant changes in MT1A and MT2A gene expression in RPTEC/TERT1 cells. Exposure to Cd resulted in a significant increase in (A) MT1A at 10 μM Cd after 6 h and in (B) MT2A after 3, 6, and 24 h. In contrast, exposure to B[a] P after 3, 6, and 24 h did not result in significant changes in (C) MT1A or (D) MT2A gene expression. Bars represent mean fold-expression (n = 3) ± SEM. All genes of interest were normalized to ACTB. Expression of genes in the DMSO or 0 μM control groups, where denoted, was set to 1. * Indicates significant difference from DMSO or 0 μM controls at each respective time point, p < 0.001, † indicates significant difference from DMSO or 0 μM controls at each time point, p < 0.01, # indicates significant difference from DMSO or 0 μM controls at each time point, p < 0.05. [*] Indicates significant difference from 1 μM Cd at 24 h, p < 0.001, /*/ indicates significant difference from 10 μM Cd at 6 h, p < 0.001, (†) indicates significant difference from 10 μM Cd at 6 h, p < 0.01, [†] indicates significant difference from 10 μM Cd at 24 h, p < 0.01, (#) indicates significant difference from 10 μM Cd at 24 h, p < 0.05, and {#} indicates significant difference from 10 μM Cd at 6 h, p < 0.05.
3.5. Co-exposure to Cd and B[a]P does not alter gene expression responses to single compounds
Because the kidney is exposed to mixtures of toxicants while filtering and reabsorbing nutrients in the body, we characterized cytotoxicity and gene expression responses of the RPTEC/TERT1 cell line after co-exposure to Cd and B[a]P. Cells were treated with 1 μM Cd for 24 h followed by exposure to concentrations of B[a]P for 24 h. Treatment with 1 μM Cd alone did not significantly alter cell viability at any time point post-exposure (Fig. 1A–C). Cytotoxicity under co-exposure conditions was determined using the MTT assay. Only cells treated with 1 μM Cd for 24 h and 10 μM B[a]P for 24 h were significantly different from untreated controls, p < 0.001 (Fig. 5).
Fig. 5.

Co-exposure to Cd and B[a]P resulted in a significant increase in cytotoxicity at the highest dose only. After 24 h of either 0 μM Cd, 0.1 μM Cd, or 1 μM Cd, cells were exposed to concentrations of B[a]P for 24 h. Only groups exposed to 1 μM Cd × 10 μM B[a]P significantly differed from untreated controls, p < 0.001. Viabilities are expressed as percent DMSO control as determined by the MTT viability assay. Points represent mean ± SEM (n = 8).
Patterns of gene expression after co-exposure followed those seen after single compound exposures. Phase I metabolic enzymes CYP1A1 and CYP1B1 showed an induction in gene expression, most significantly at 1 μM Cd × 1 μM B[a]P (Fig. 6A and B). There was no significant increase in EPHX1 gene expression after single compound exposures. However EPHX1 expression was modestly, but significantly increased after co-exposure to 1 μM Cd × 1 μM B[a]P (Fig. 6C). There was no change in MT1A gene expression (Fig. 6D) whereas MT2A was significantly increased after treatment with 1 μM Cd × 1 μM B[a]P (Fig. 6E).
Fig. 6.

Co-exposure to Cd and B[a]P resulted in significant increases in gene expression at 1 μM Cd × 1 μM B[a]P in (A) CYP1A1 (B) CYP1B1, (C)EPHX1, and (E)MT2A. There were no significant changes in gene expression at any concentration in (D)MT1A Cells were exposed to 1 μM Cd alone for 24 h followed by a 24 h exposure to defined concentrations of B[a]P. Bars represent mean fold expression (n = 3) ± SEM. All genes of interest were normalized to ACTB. The expression of genes in the DMSO control group was set to 1. * Indicates significant difference from 1 μM Cd × 1 μM B[a]P, p < 0.001, † indicates significant difference from 1 μM Cd × 1 μM B[a]P, p < 0.01, and # indicates significant difference from 1 μM Cd × 1 μM B[a]P, p < 0.05.
3.6. Enzymatic activity increases in CYP1(A/B) with B[a]P exposure
The EROD activity assay was performed at 3, 6, and 24 h post-exposure to B[a]P and after Cd × B[a]P co-exposure conditions to confirm CYP1(A/B) enzymatic activity and function (Fig. 7). Significant increases in CYP1(A/B) enzymatic activity were detected after 24 h of exposure to 0.1 μM and 1 μM B[a]P alone. Additionally, there were significant increases in enzymatic activity after co-exposure to 1 μM Cd × 0.01 μM B[a]P and 1 μM Cd × 1 μM B[a]P. There was no significant effect due to Cd treatment under co-exposure conditions.
Fig. 7.

Increase in CYP1(A/B) enzymatic activity was detected after B[a]P exposure using the EROD activity assay. Statistically significant increases were detected after 24 h of exposure to 0.1 μM B[a]P and 1 μM B[a]P alone. Under co-exposure conditions with Cd and B[a]P significant increases in enzymatic activity were detected at 1 μM Cd × 0.1 μM B[a]P and 1 μM Cd × 1 μM B[a]P. Points represent mean(n = 3) pg resorufin/mg protein ± SEM and expressed as percent of the DMSO control group for each respective time point, # indicates significant difference from the DMSO control group at each respective time point, p < 0.05.
3.7. Metallothionein protein expression
MTI/IIA protein levels were determined by immunoblotting after 48 h and after 1 week of exposure to 1 μM and 10 μM Cd (Fig. 8). After 48 h of exposure, RPTEC/TERT1 cells show the greatest increase in MTI/IIA protein at 1 μM Cd. Densitometry of bands revealed over a 290% increase in MTI/IIA protein after exposure to 1 μM Cd for 48 h and over a 140% increase after exposure to 10 μM Cd for 48 h in comparison to untreated controls. After 1 week of exposure, MTI/IIA protein remained elevated in cells exposed to 1 μM Cd and 10 μM Cd with levels exceeding 150% and 160%, respectively, when compared to untreated controls.
Fig. 8.
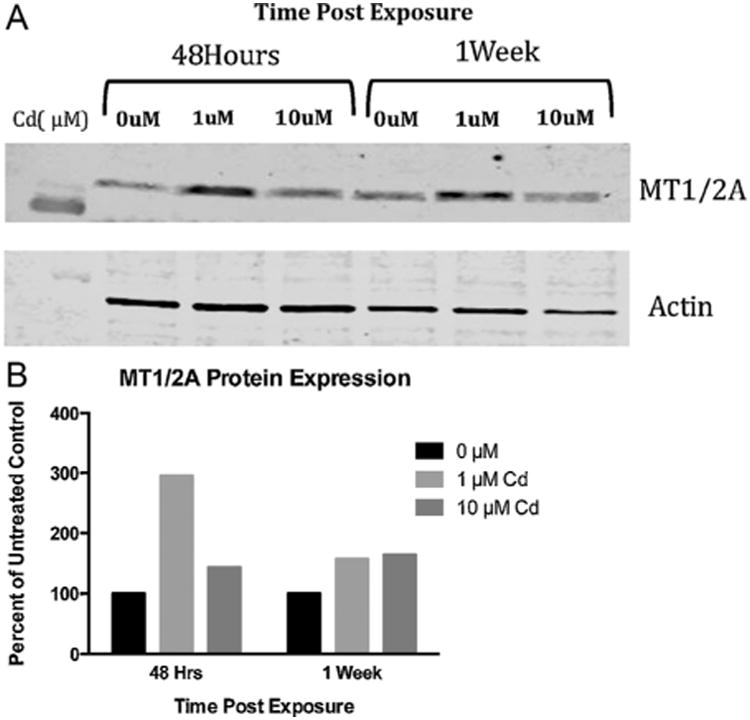
Change in metallothionein protein was detected after exposure to Cd. (A) Metallothionein protein expression was significantly increased by Western blot in RPTEC/TERT1 cells after 48 h of exposure to 1 μM Cd. (B) Protein bands were quantified using ImageJ software, normalized to Actin, and expressed as percent of untreated control.
4. Discussion
At present, the majority of human in vitro, immortalized models rely on cells that retain an ability to proliferate due to a tumorigenic phenotype or through viral transformation. Although these cell lines have provided tools for experimentation, their altered states may not adequately model normal, healthy human cells in the tissue of interest. Unstable or tumor-derived in vitro models make it difficult to study the progression of healthy cells to tumorigenic ones. New evidence suggests that tumor derived cell lines grown in culture are less likely to resemble cells in the original tumor tissue. Recently, transcriptional analyses of several cell lines derived from diverse tumor tissues including glioblastoma, colorectal cancer, breast cancer, metastatic melanoma, leukemia, and ovarian cancer have revealed a greater similarity of the cell lines to each other than to their respective tumor tissues [16]. Because many of these cell lines are less sensitive than their normal biological counterparts to chemically induced effects, substantially higher concentrations of compounds are required to produce a significant response. Therefore, some of these immortalized cell lines may not be suitable models to accurately represent xenobiotic biotransformation or DNA repair capacity, as it would occur in vivo. In order to provide the most relevant information for translating in vitro toxicity tests using immortalized cell lines to human health and risk assessment, it is imperative to conduct experiments under biologically appropriate conditions [19].
Renal proximal tubule epithelial cells are primarily responsible for reabsorption of nutrients in the kidney. These cells are uniquely susceptible to toxicants and damage as they are the first cells exposed to tubular filtrate [30]. Consequently, renal proximal tubule epithelial cells are continuously exposed to potentially damaging agents, which can contribute to and promote the progression of renal diseases and renal cell carcinogenesis [22]. With the incidence of kidney and renal pelvis diseases and cancers significantly increasing over the last several decades, it is important to develop suitable in vitro models which can be utilized to examine mechanisms and causal factors of renal malignancy [18].
Many in vitro studies focused on human kidney function and diseases have relied on the Human Kidney-2 cell line (HK-2). The HK-2 cell line, isolated in 1994 from human renal proximal tubule cells, was immortalized with the human papilloma virus 16 (HPV16) E6 and E7 genes. While studies characterizing the HK-2 cell line have demonstrated their ability to reproduce results seen in isolated proximal tubule cells, the transformation with E6/E7 genes is now known to lead to aberrant cell growth, signaling, and in vitro properties that may not correctly reflect normal proximal tubule cells [26,28].
The goal of this initial, targeted toxicological evaluation was to examine selected toxicant induced responses in a novel, immortalized RPTEC line that may model the target tissue better than other widely available cell lines. We argue that primary RPTECs are likely better in vitro models for evaluating toxicological effects on renal cells but only under certain experimental protocols. Primary RPTECs are often obtained from diseased patients, they undergo replicative senescence in culture, and their xenobiotic metabolizing properties may change in culture, as do primary hepatocytes. Where primary RPTECs from healthy, human donors can be obtained and used for appropriate experimental protocols, they should be the preferred model. We suggest that our work herein was conducted to provide a rationale for using this novel, immortalized RPTEC/TERT1 cell line in toxicological studies where those criteria cannot be met. Our experiments in the RPTEC/TERT1 cell line demonstrate their chemical sensitivity and metabolic capacity when exposed to low concentrations of single and binary combinations of B[a]P and Cd. In the RPTEC/TERT1 cell line, sensitivity to single compounds was exhibited at concentrations as low as 1 nM B[a]P and 3 μM Cd. Unlike Cd, B[a]P must be bioactivated in order to cause cytotoxicity and mutagenicity [2]. Increased cytotoxicity in RPTEC/TERT1 cells due B[a]P exposure suggests bioactivation of the parent compound, B[a]P, to its toxic metabolites.
While there are very limited studies examining the effects of B[a]P on human kidney cells, strong evidence supports the link between PAH consumption and an increase in RCC risk [10,11]. Significant increases in CYP1A1 and CYP1B1 gene expression were detected in RPTEC/TERT1 cells after B[a]P exposure but not after Cd-only exposure. This demonstrates dynamic dose responsiveness at the gene expression level. HK-2 cells, used here as a comparative model, showed no significant differences in gene expression due to B[a]P exposure at any concentration or time point. In HK-2 cells, CYP1A1 was detected at late cycle times, between 31 and 34 out of 40 PCR cycles, and CYP1B1 was detected between 25 and 26 out of 40 PCR cycles. Because HK-2 cells were immortalized by transformation with HPV-16 E6/E7, it is possible that these properties may be promoting constitutive, ectopic, dysfunctional expression of CYP1A1, CYP1B1, and other genes not included in our studies. Additionally, RPTEC/TERT1 cells exhibited appropriate compound-specific responses such that cells treated with Cd alone did not mirror responses seen when cells were treated with B[a]P alone. Likewise, cells treated with Cd responded with significant increases in MTI/II as would be expected following heavy metal exposure.
Cd is known to have a long biological half life of several decades, up to 30 years, and accumulates in the proximal tubules of the kidney [12]. We exposed RPTEC/TERT1 cells to 1 μM Cd for 24 h followed by concentrations of B[a]P for 24 h in order to determine effects of co-exposure to B[a]P and Cd as would occur in the environment. Under co-exposure, cells showed responses similar to those after exposure to each single compound with an increase in CYP1A1, CYP1B1, and MT2A. A small but significant increase in EPHX1 after co-exposure, which was not detected after single compound exposure, suggests increased oxidative stress due to the presence of both compounds. We aim to investigate this effect in terms of mixtures, oxidative stress, and mutagenesis with ongoing studies using the RPTEC/TERT1 cell line.
Significant increases in enzymatic activity were detected with the EROD activity assay after 24 h of B[a]P exposure and under co-exposure conditions. Because the EROD assay specifically detects CYP1A activity, the increase in EROD seen in the RPTEC/TERT1 cell line after B[a]P exposure suggests activation of the AhR signaling pathway [2,6]. We hypothesize that the AhR pathway would be activated in this cell line after exposure to biologically relevant concentrations of many AhR ligands. This data further confirms functional and appropriate metabolic responses to environmental toxicants in the RPTEC/TERT1 cell line.
Many experiments studying PAHs such as B[a]P have been carried out in human liver cells derived from hepatocellular carcinoma (HepG2) as well as human bronchial epithelial cells derived from a carcinoma (A549). However, the tumorigenic nature of these cell lines calls into question their accurate representation of prototypical biological responses. Using these cells to model normal, healthy cells and organs in toxicological experiments is far from ideal.
The kidneys have been known to activate, metabolize, and detoxify xenobiotics through all of the typical Phase I and Phase II metabolic reactions. Since the 1960s, renal CYP activity has been studied as a key component of drug biotransformation and toxicity in the kidney. Xenobiotics such as analgesics, barbiturates, chemotherapeutics, alcohol, and immunosuppressive agents have been widely studied and shown to induce the renal CYP system to varying degrees. Early in vivo experiments using B[a]P have verified the presence and activation of CYPs in the kidney [25]. Likewise, studies detailing Cd's transport, bioaccumulation, promotion of oxidative stress, and inhibition of DNA repair pathways in renal proximal tubule cells have validated the heavy metal as a suspected renal cell carcinogen [20,21,35].
Our results demonstrate the canonical properties of active renal metabolism in a human cell line derived from normal, healthy kidney tissue. Additionally, these cells respond to environmental toxicants at levels lower than those shown in other metabolically competent cell lines [14,25,32]. Because actual human exposures in the environment are to mixtures of chemicals and compounds, we are primarily interested in expanding scientific knowledge of how these mixtures may promote chemically induced responses and potentiate carcinogenesis. Our results demonstrate that the RPTEC/TERT1 cell line can be used to study a binary mixture of two carcinogens with distinctly different modes of action. Future research examining the toxicological effects of this binary mixture in addition to more complex mixtures should be considered as a model of biologically relevant exposure scenarios. Ongoing studies are necessary to further verify the metabolic properties of RPTEC/TERT1 cells. Quantifying and tracking known biomarkers of exposure to B[a]P, such as BPDE-DNA adducts, as well as effects seen in the presence of Cd, will provide essential mechanistic information regarding the ability of the RPTEC/TERT1 cell line to accurately model the kidney [37]. By characterizing the RPTEC/TERT1 cell line for exposure and toxicological research, we aim to provide a model toxicological system which better represents responses that may occur in normal renal proximal tubule epithelial cells.
Supplementary Material
Acknowledgments
We acknowledge the Tulane University Cancer Center and the Louisiana Cancer Research Consortium for their generous support. We also acknowledge Dr. Wen Zhang for the generous help in optimizing the EROD activity assay.
Funding: This work was supported by the Baton Rouge Area Foundation.
This work was supported by the National Institutes of Health [grant number 5U19ES020677].
Footnotes
Supplementary data: The supplementary data for this manuscript contains genotyping of drug metabolizing enzymes for characterization purposes of the RPTEC/TERT1 cell line. The data is provided in spreadsheet format.
Conflict of interest: None declared.
Transparency document: The Transparency document associated with this article can be found in the online version.
Appendix A. Supplementary data: Supplementary data associated with this article can be found, in the online version, at doi:10.1016/j.toxrep. 2014.05.010.
References
- 1.Asmuss M, Mullenders LH, Hartwig A. Interference by toxic metal compounds with isolated zinc finger DNA repair proteins. Toxicol Lett. 2000;112-113:227–231. doi: 10.1016/s0378-4274(99)00273-8. [DOI] [PubMed] [Google Scholar]
- 2.Baird WM, Hooven LA, Mahadevan B. Carcinogenic polycyclic aromatic hydrocarbon-DNA adducts and mechanism of action. Environ Mol Mutagen. 2005;45:106–114. doi: 10.1002/em.20095. http://dx.doi.org/10.1002/em.20095. [DOI] [PubMed] [Google Scholar]
- 3.Barbier O, Jacquillet G, Tauc M, Poujeol P, Cougnon M. Acute study of interaction among cadmium, calcium, and zinc transport along the rat nephron in vivo. Am J Physiol Renal Physiol. 2004;287:F1067–F1075. doi: 10.1152/ajprenal.00120.2004. http://dx.doi.org/10.1152/ajprenal.00120.2004. [DOI] [PubMed] [Google Scholar]
- 4.Barbier O, Jacquillet G, Tauc M, Cougnon M, Poujeol P. Effect of heavy metals on, and handling by, the kidney. Nephron Physiol. 2005;99:105–110. doi: 10.1159/000083981. http://dx.doi.org/10.1159/000083981. [DOI] [PubMed] [Google Scholar]
- 5.Bradford MM. A rapid and sensitive method for the quantitation of microgram quantities of protein utilizing the principle of protein-dye binding. Anal Biochem. 1976;72:248–254. doi: 10.1006/abio.1976.9999. [DOI] [PubMed] [Google Scholar]
- 6.Burke MD, Mayer RT. Ethoxyresorufin: direct fluorimetric assay of a microsomal O-dealkylation which is preferentially inducible by 3-methylcholanthrene. Drug Metab Dispos. 1974;2:583–588. [PubMed] [Google Scholar]
- 7.Burnette WN. “Western blotting”: electrophoretic transfer of proteins from sodium dodecyl sulfate-polyacrylamide gels to unmodified nitrocellulose and radiographic detection with antibody and radioiodinated protein A. Anal Biochem. 1981;112:195–203. doi: 10.1016/0003-2697(81)90281-5. [DOI] [PubMed] [Google Scholar]
- 8.Chow WH, Dong LM, Devesa SS. Epidemiology and risk factors for kidney cancer. Nat Rev Urol. 2010;7:245–257. doi: 10.1038/nrurol.2010.46. http://dx.doi.org/10.1038/nrurol.2010.46. [DOI] [PMC free article] [PubMed] [Google Scholar]
- 9.Dally H, Hartwig A. Induction and repair inhibition of oxidative DNA damage by nickel(II) and cadmium(II) in mammalian cells. Carcinogenesis. 1997;18:1–6. doi: 10.1093/carcin/18.5.1021. [DOI] [PubMed] [Google Scholar]
- 10.Daniel CR, Cross AJ, Graubard BI, Park Y, Ward MH, Rothman N, Hollenbeck AR, Chow WH, Sinha R. Large prospective investigation of meat intake, related mutagens, and risk of renal cell carcinoma. Am J Clin Nutr. 2012;95:155–162. doi: 10.3945/ajcn.111.019364. http://dx.doi.org/10.3945/ajcn.111.019364. [DOI] [PMC free article] [PubMed] [Google Scholar]
- 11.Daniel CR, Schwartz KL, Colt JS, Dong LM, Ruterbusch JJ, Purdue MP, Cross AJ, Rothman N, Davis FG, Wacholder S, Graubard BI, Chow WH, Sinha R. Meat-cooking mutagens and risk of renal cell carcinoma. Br J Cancer. 2011;105:1096–1104. doi: 10.1038/bjc.2011.343. http://dx.doi.org/10.1038/bjc.2011.343. [DOI] [PMC free article] [PubMed] [Google Scholar]
- 12.Filipic M. Mechanisms of cadmium induced genomic instability. Mutat Res. 2012;733:69–77. doi: 10.1016/j.mrfmmm.2011.09.002. http://dx.doi.org/10.1016/j.mrfmmm.2011.09.002. [DOI] [PubMed] [Google Scholar]
- 13.Fowler BA. Monitoring of human populations for early markers of cadmium toxicity: a review. Toxicol Appl Pharmacol. 2009;238:294–300. doi: 10.1016/j.taap.2009.05.004. http://dx.doi.org/10.1016/j.taap.2009.05.004. [DOI] [PubMed] [Google Scholar]
- 14.Genies C, Maitre A, Lefebvre E, Jullien A, Chopard-Lallier M, Douki T. The extreme variety of genotoxic response to benzo[a]pyrene in three different human cell lines from three different organs. PLoS ONE. 2013;8:e78356. doi: 10.1371/journal.pone.0078356. http://dx.doi.org/10.1371/journal.pone.0078356. [DOI] [PMC free article] [PubMed] [Google Scholar]
- 15.Giaginis C, Gatzidou E, Theocharis S. DNA repair systems as targets of cadmium toxicity. Toxicol Appl Pharmacol. 2006;213:282–290. doi: 10.1016/j.taap.2006.03.008. http://dx.doi.org/10.1016/j.taap.2006.03.008. [DOI] [PubMed] [Google Scholar]
- 16.Gillet JP, Calcagno AM, Varma S, Marino M, Green LJ, Vora MI, Patel C, Orina JN, Eliseeva TA, Singal V, Padmanabhan R, Davidson B, Ganapathi R, Sood AK, Rueda BR, Ambudkar SV, Gottesman MM. Redefining the relevance of established cancer cell lines to the study of mechanisms of clinical anti-cancer drug resistance. Proc Natl Acad Sci U S A. 2011;108:18708–18713. doi: 10.1073/pnas.1111840108. http://dx.doi.org/10.1073/pnas.1111840108. [DOI] [PMC free article] [PubMed] [Google Scholar]
- 17.Grieb SM, Theis RP, Burr D, Benardot D, Siddiqui T, Asal NR. Food groups and renal cell carcinoma: results from a case-control study. J Am Diet Assoc. 2009;109:656–667. doi: 10.1016/j.jada.2008.12.020. http://dx.doi.org/10.1016/j.jada.2008.12.020. [DOI] [PubMed] [Google Scholar]
- 18.Howlader N, Noone AM, Krapcho M, Neyman N, Aminou R, Waldron W, Altekruse SF, Kosary CL, Ruhl J, Tatalovich Z, Cho H, Mariotto A, Eisner MP, Lewis DR, Chen HS, Feuer EJ, Cronin KA, Edwards BK, editors. SEER Cancer Statistics Review, 1975-2008. National Cancer Institute; 2011. [Google Scholar]
- 19.Hubal EAC. Biologically relevant exposure science for 21st century toxicity testing. Toxicol Sci. 2009;111:226–232. doi: 10.1093/toxsci/kfp159. http://dx.doi.org/10.1093/toxsci/kfp159. [DOI] [PubMed] [Google Scholar]
- 20.Huff J, Lunn RM, Waalkes MP, Tomatis L, Infante PF. Cadmium-induced cancers in animals and in humans. Int J Occup Environ Health. 2007;13:202–212. doi: 10.1179/oeh.2007.13.2.202. [DOI] [PMC free article] [PubMed] [Google Scholar]
- 21.Järup L, Akesson A. Current status of cadmium as an environmental health problem. Toxicol Appl Pharmacol. 2009;238:201–208. doi: 10.1016/j.taap.2009.04.020. http://dx.doi.org/10.1016/j.taap.2009.04.020. [DOI] [PubMed] [Google Scholar]
- 22.Klassen CD. Casarett and Doull's Toxicology: The Basic Science of Poisons. 7. McGraw Hill; 2008. p. 1310. [Google Scholar]
- 23.Lagerqvist A, Hakansson D, Lundin C, Prochazka G, Dreij K, Segerback D, Jernstrom B, Tornqvist M, Frank H, Seidel A, Erixon K, Jenssen D. DNA repair and replication influence the number of mutations per adduct of polycyclic aromatic hydrocarbons in mammalian cells. DNA Repair (Amst) 2011;10:877–886. doi: 10.1016/j.dnarep.2011.06.002. http://dx.doi.org/10.1016/j.dnarep.2011.06.002. [DOI] [PubMed] [Google Scholar]
- 24.Ljungberg B, Campbell SC, Choi HY, Jacqmin D, Lee JE, Weikert S, Kiemeney LA. The epidemiology of renal cell carcinoma. Eur Urol. 2011;60:615–621. doi: 10.1016/j.eururo.2011.06.049. http://dx.doi.org/10.1016/j.eururo.2011.06.049. [DOI] [PubMed] [Google Scholar]
- 25.Lohr JW, Willsky GR, Acara MA. Renal drug metabolism. Pharmacol Rev. 1998;50:107–141. [PubMed] [Google Scholar]
- 26.Pei XF. The human papillomavirus E6/E7 genes induce discordant changes in the expression of cell growth regulatory proteins. Carcinogenesis. 1996;17:1395–1401. doi: 10.1093/carcin/17.7.1395. [DOI] [PubMed] [Google Scholar]
- 27.Rasband WS. ImageJ. U.S. National Institutes of Health; Bethesda, MD, USA: 1997–2012. http://imagej.nih.gov/ij/ [Google Scholar]
- 28.Ryan MJ, Johnson G, Kirk J, Fuerstenberg SM, Zager RA, Torok-Storb B. HK-2: an immortalized proximal tubule epithelial cell line from normal adult human kidney. Kidney Int. 1994;45:48–57. doi: 10.1038/ki.1994.6. [DOI] [PubMed] [Google Scholar]
- 29.Sabolic I, Breljak D, Skarica M, Herak-Kramberger CM. Role of metallothionein in cadmium traffic and toxicity in kidneys and other mammalian organs. Biometals. 2010;23:897–926. doi: 10.1007/s10534-010-9351-z. http://dx.doi.org/10.1007/s10534-010-9351-z. [DOI] [PubMed] [Google Scholar]
- 30.Saladin KS. Anatomy and Physiology: The Unity of Form and Function. 4. McGraw-Hill; New York, NY: 2007. [Google Scholar]
- 31.Shimada T, Fujii-Kuriyama Y. Metabolic activation of polycyclic aromatic hydrocarbons to carcinogens by cytochromes P450 1A1 and 1B1. Cancer Sci. 2004;95:1–6. doi: 10.1111/j.1349-7006.2004.tb03162.x. [DOI] [PMC free article] [PubMed] [Google Scholar]
- 32.Tarantini A, Maitre A, Lefebvre E, Marques M, Rajhi A, Douki T. Polycyclic aromatic hydrocarbons in binary mixtures modulate the efficiency of benzo[a]pyrene to form DNA adducts in human cells. Toxicology. 2011;279:36–44. doi: 10.1016/j.tox.2010.09.002. http://dx.doi.org/10.1016/j.tox.2010.09.002. [DOI] [PubMed] [Google Scholar]
- 33.Tice RR, Austin CP, Kavlock RJ, Bucher JR. Improving the human hazard characterization of chemicals: a Tox21 update. Environ Health Perspect. 2013;121:756–765. doi: 10.1289/ehp.1205784. http://dx.doi.org/10.1289/ehp.1205784. [DOI] [PMC free article] [PubMed] [Google Scholar]
- 34.United States Renal Data System. 2013 Annual Data Report: Atlas of Chronic Kidney Disease and End Stage Renal Diseases in the United States. 2013. National Institutes of Health National Institute of Diabetes and Digestive and Kidney Diseases; Bethesda, MD: 2013. [Google Scholar]
- 35.Waalkes MP. Cadmium carcinogenesis. Fundam Mol Mech Mutagen. 2003;533:107–120. doi: 10.1016/j.mrfmmm.2003.07.011. http://dx.doi.org/10.1016/j.mrfmmm.2003.07.011. [DOI] [PubMed] [Google Scholar]
- 36.Wieser M, Stadler G, Jennings P, Streubel B, Pfaller W, Ambros P, Riedl C, Katinger H, Grillari J, Grillari-Voglauer R. hTERT alone immortalizes epithelial cells of renal proximal tubules without changing their functional characteristics. AJP: Renal Physiol. 2008;295:F1365–F1375. doi: 10.1152/ajprenal.90405.2008. http://dx.doi.org/10.1152/ajprenal.90405.2008. [DOI] [PubMed] [Google Scholar]
- 37.Xue W, Warshawsky D. Metabolic activation of polycyclic and heterocyclic aromatic hydrocarbons and DNA damage: a review. Toxicol Appl Pharmacol. 2005;206:73–93. doi: 10.1016/j.taap.2004.11.006. http://dx.doi.org/10.1016/j.taap.2004.11.006. [DOI] [PubMed] [Google Scholar]
Associated Data
This section collects any data citations, data availability statements, or supplementary materials included in this article.