Abstract
Maximizing 2-photon parameters used in acquiring images for quantitative intravital microscopy, especially when high sensitivity is required, remains an open area of investigation. Here we present data on correctly setting the black level of the photomultiplier tube amplifier by adjusting the offset to allow for accurate quantitation of low intensity processes. When the black level is set too high some low intensity pixel values become zero and a nonlinear degradation in sensitivity occurs rendering otherwise quantifiable low intensity values virtually undetectable. Initial studies using a series of increasing offsets for a sequence of concentrations of fluorescent albumin in vitro revealed a loss of sensitivity for higher offsets at lower albumin concentrations. A similar decrease in sensitivity, and therefore the ability to correctly determine the glomerular permeability coefficient of albumin, occurred in vivo at higher offset. Finding the offset that yields accurate and linear data are essential for quantitative analysis when high sensitivity is required.
Keywords: black level, offset, sensitivity, low intensity, 2-photon, albumin, permeability
Introduction
Intravital 2-photon microscopy moved quickly past the initial “wow” factor onto increasingly complex applications from which dynamic, meaningful and quantitative information can be obtained.1 Various manuscripts and reviews cover these applications2–9 and the information obtained from images can be surmised into two distinct categories. The first is comprised of information akin to more standardized morphometric analysis.10–13 These include scoring of structures as seen between normal and pathologic states, determining structures such as organelles,14 and deriving slow and rapid movement of structures from static images,15,16 such as red blood cell flow, or a movie to follow vesicular trafficking.17,18
The second and more complex analysis involves the accurate measurement of intensity. Here, more careful attention must be paid to how images are collected for subsequent analysis. Saturation of values in the upper range of the detection scale is the more common and better-understood parameter in this aspect of image analysis. Any value pushed above the detection range causing saturation will skew the average value for the data set down, reporting an underestimation, effectively masking the magnitude of a response.19 Less consideration is typically placed on the importance of setting the lower detection limit, the threshold of the photomultiplier tube (PMT). To achieve a full range of detection, the black level of the PMT amplifier must be set properly.20 The black level is adjusted via amplifier offset, which adds a positive or negative voltage to the signal so that the lowest pixel values are just above the threshold of detection. Low black level will render normal background in the image. Whereas, when the black level is set too high, some low intensity values become zero making otherwise quantifiable intensity signals undetectable. With the properly adjusted offset the acquired images produce only a few random pixel values at zero and the majority of the autofluorescence within the tissue is acquired and later subtracted out. This step involves the collection of background information for later correction by either averaging the background values from a preset number of images and subtracting this average from the acquired image post infusion of a fluorescent molecule, or acquiring background images or 3D data sets for each region of interest to be studied, and subtracting matching background information.
To determine the influence on low intensity readings by setting offsets correctly where only a few random pixels have values of zero, or by setting offsets too high where background values are progressively pushed to zero, we undertook a study to determine which is better suited to correctly acquire and report fluorescence intensities, particularly those with low values near the inherent background levels within tissue. We proceeded by examining in vitro intensity values generated in our 2-photon system using a series of dilute fluorescent solutions and comparing them to those obtained using a standard spectrophotometer.
Our initial findings using a series of dilute Texas Red rat serum albumin (TR-RSA) solutions demonstrated a loss in sensitivity as the offset in the 2-photon system was numerically increased from the properly adjusted level as described above (causing a simultaneous increase in the number of pixel reporting values of zero).
When these same offsets were applied in vivo to the acquisition of background and Texas Red rat serum albumin (TR-RSA) containing data sets, a reduction in sensitivity and nonlinearity was found with high offsets. All in vitro and in vivo images used in quantitation were background subtracted. Lower offset images had positive background values while higher offset images had values at or near zero. Dividing fluorescence values from the 2-photon microscope or the spectrophotometer by the concentration of TR-RSA revealed a nearly constant value with a linear relationship for the lower offsets and the spectrophotometer. Higher offsets on the 2-photon system lost linearity and sensitivity with lower TR-RSA concentrations.
The in vitro data on serial dilution of the fluorescent solution and intravital data on TR-RSA permeability suggest carefully setting offset values and subsequently subtracting out background information should be used for accurate quantitation of low fluorescent intensity values.
Results
Two-photon imaging of solution standards in vitro and correlative spectrophotometry
These studies were undertaken to determine and maximize the limit of sensitivity in 2-photon studies. The initial approach was to systematically determine the sensitivity of our Olympus Fluoview 1000 2-photon system equipped with highly sensitive GaAsP photomultiplier tube (PMT) detectors.18 We hypothesized setting the lower detection limits is crucial in detecting samples with low intensity values. This was achieved by adjusting the black level of the PMT using the offset on the amplifier so that only a small number of the pixel values were set to zero for the blank dish, which are shown as blue by the Fluoview software. Numerically higher offset values (corresponding to higher black levels on the FV1000) lower background values and hence improve the image contrast. However, when the offset is set too high it comes at a cost of forcing an increasing number of pixel values within an image to the value of zero resulting in compromised PMT sensitivity. To systematically test the effect of offset values on sensitivity in an in vitro system, a series of Texas Red rat serum albumin dilutions (TR-RSA) were placed in a coverlisp dish and green fluorescent bead were added to allow a consistent focal plane approximately 2 µm into the solution by focusing on the 4 µm beads in cross-section.
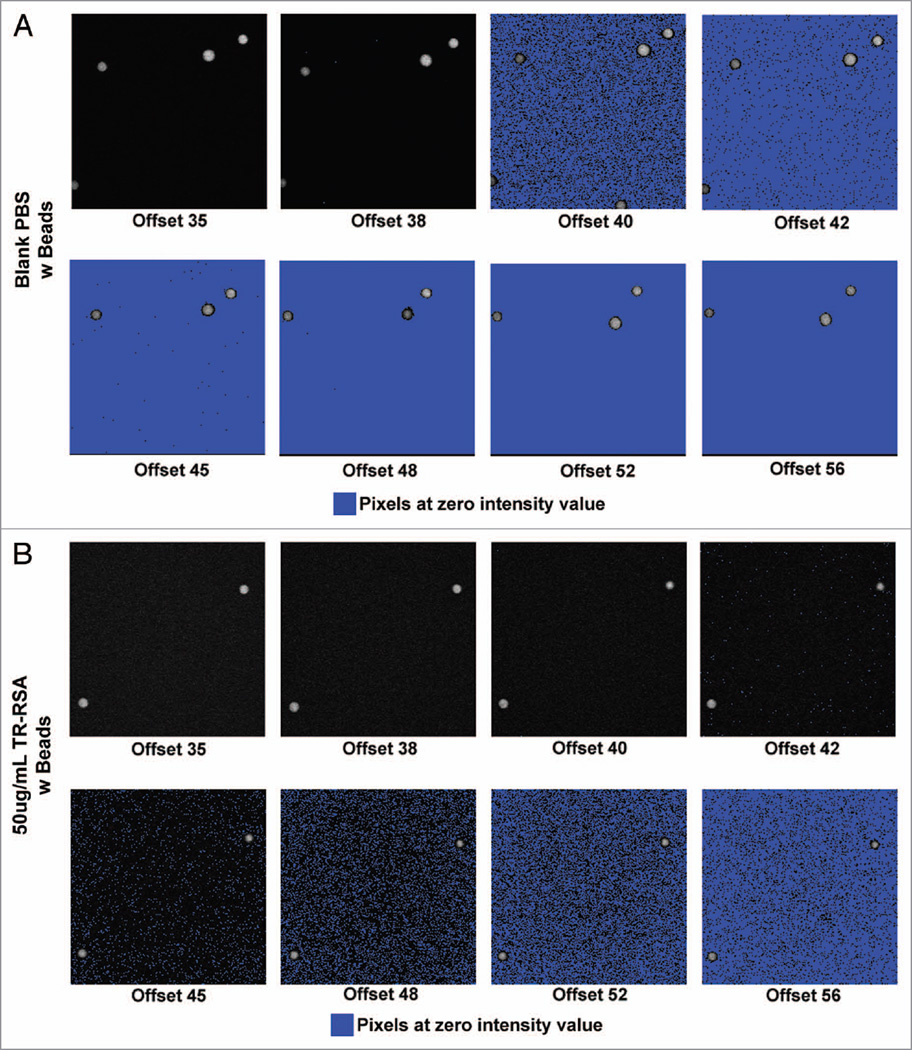
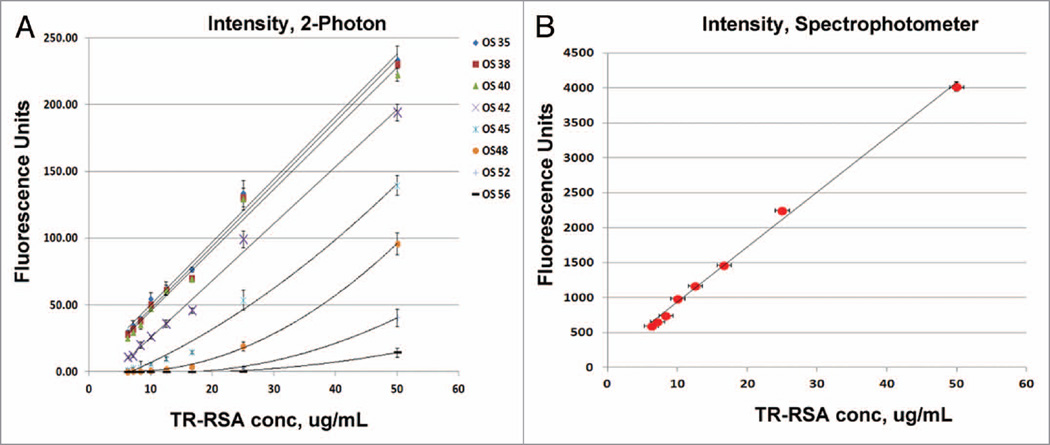
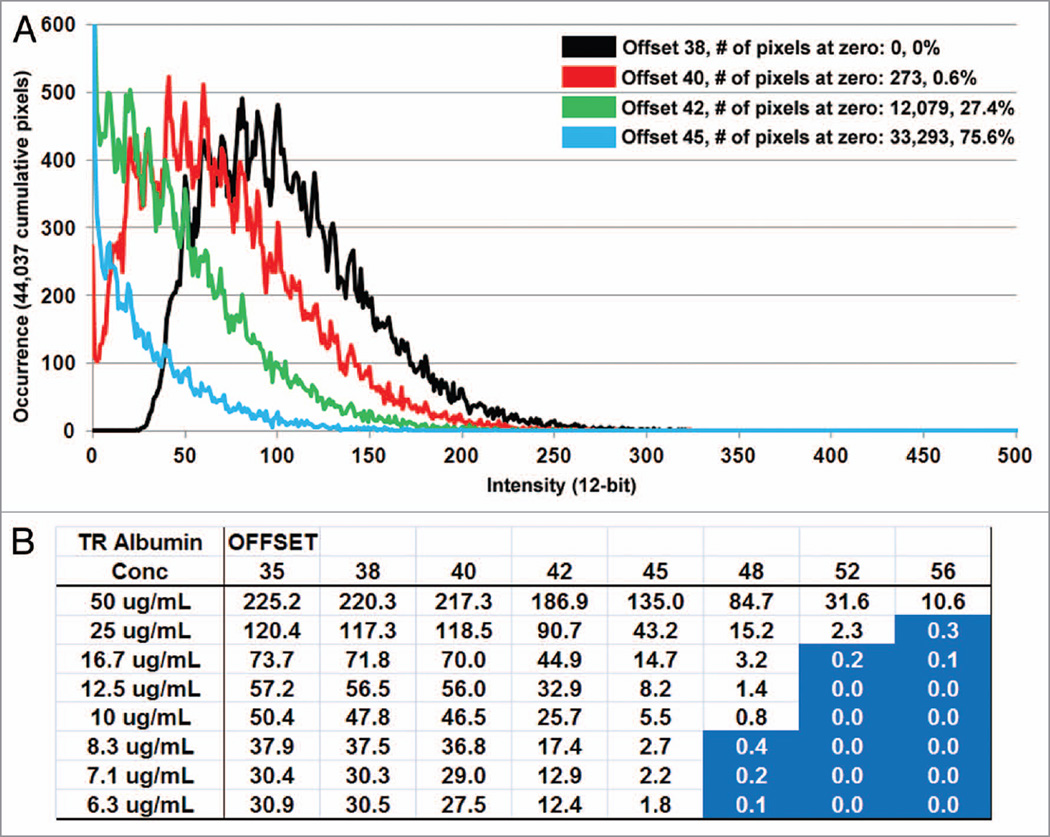
A range of offsets at 35, 38, 40, 42, 45, 48, 52 and 56 were studied for the TR-RSA solutions spanning concentrations of 6.25, 7.1, 8.33, 10, 12.5, 16.677, 25 and 50 µg/mL; as well as a PBS blank to determine background levels that were subsequently subtracted from all of the raw values (at higher offsets the background values averaged zero). Figure 1 demonstrates when imaging the PBS blank solutions it became apparent that an offset of 40 and greater would force an increasingly larger number of pixels to values of zero. For the PBS blanks at an offset of 42 nearly 90% of the pixels in a standardized 40 × 40 circular region of interest were at zero; at an offset of 48 and greater this number was 100%. This was also seen with TR-RSA solutions with higher offset settings forcing pixel values to zero as the solution concentration decreased. Intensity diagrams shown in Figure 2 show a linear relationship between detected fluorescence, corrected for background, at the various concentration of TR-RSA for offset values of 35, 38 and 40. At greater offsets the relationship became nonlinear as the fluorescence detected and overall sensitivity dramatically decreased. Figure 2B shows the same solutions read by a spectrophotometer, also exhibit a linear relationship. The TR-RSA solution at 12.5 µg/mL was selected to generate histograms to show the pixel values within a selected region. Figure 3A plots individual pixel intensity values relative to occurrence within a region containing 44,037 pixels. Note the Y-axis on the graph is truncated at 600 occurrences. As the offset was increased, when acquiring from the same solution, the number of zero value pixels dramatically increased from none to 273 for offsets 38 and 40, respectively, to 12,079 and 33,293 for offsets 42 and 45, respectively. The table in Figure 3B shows the average intensity values for the different concentrations of TR-RSA at the different offset settings. As expected, higher offsets had average intensity values closer to or at zero, particularly for the lower concentrations of TR-RSA. Additionally, the proportional drop in average fluorescence intensity seen with decreasing concentrations of TR-RSA, at lower offsets, exhibited disproportionately larger decreases at the higher offsets.
Figure 1.
Effect of increasing offset on pixel intensity values in solutions of Texas Red rat serum albumin (TR-RSA). In vitro images acquired using 2-photon microscopy display an increasingly greater number of pixel values at zero as the offset value is increased. Series (A) shows a 200×200 pixel region of fluorescent beads in a blank PBS solution with the offset values labeled from 35 through 56. Increasing numbers of pixels with values at zero (as seen by the blue warning marker) are apparent as the offset increases. Identical images in series (B) show the highest concentration of TR-RSA used (50 µg/mL). Here, a more gradual increase in the number of pixels with values at zero was seen and became prevalent in offsets of 45 and greater. For other concentrations the prevalence of pixels with values at zero were seen in numerically lower offsets as the concentration of TR-RSA decreased (image ~83 µm across).
Figure 2.
Effect of higher offsets on the linearity of detection. Fluorescence intensity graphs generated from the 2-photon microscopy in vitro images shows a loss of linearity for the concentrations of Texas Red rat serum albumin (TR-RSA) as the offsets increase. (A) The intensity profiles for offsets 35–42 appear to remain linear throughout the range of concentrations of TR-RSA used. For the remaining offsets, 45 through 56, the intensity curves conform to a polynomial function with less sensitivity noted. (B) The intensity profile generated for the solutions of TR-RSA using the Spectramax M5 spectrophotometer are shown. Here, a linear relationship between the different concentrations of TR-RSA was observed.
Figure 3.
Effect of higher offsets on pixel values. Histograms generated from the 12.5 ug/mL TR-RSA concentration images show an increasing number of individual pixels with values of zero as offset is increased. (A) Histograms for offsets 38, 40, 42 and 45 are shown in black, red, green and blue, respectively. The Y-axis showing the number of occurrences for a specific pixel value is truncated at 600. The total number of pixels counted in the area was 44,037. Images taken at offsets 42 and 45 had 12,079 and 33,293 pixels with a value of zero, respectively. Note the bell shaped curves seen for offsets 38 and 40, which become sharply rising curves peaking with increasing values at zero for offsets 42 and 45. (B) A table shows average intensity values for each offset at the varying concentrations of TR-RSA. Average intensity values fall below zero at higher offsets (shown in blue) and at lower concentrations where fluorescence becomes weaker. Note the proportional drop in fluorescence between concentrations of TR-RSA at the lower offsets while higher offsets show a disproportionately larger decrease in intensity values as the concentration of TR-RSA decreases.
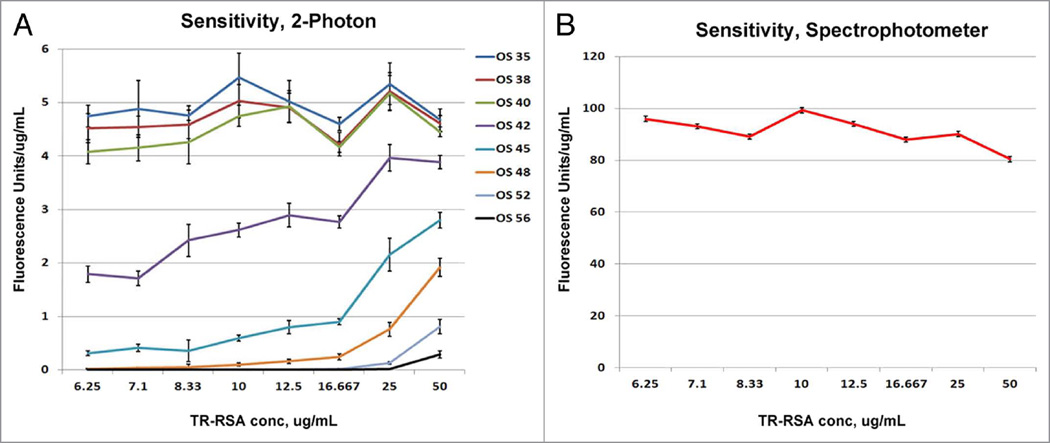
When the fluorescence units detected at the various concentrations for each offset were standardized to give fluorescence units/µg/mL of TR-RSA, a nearly constant value for offsets 35, 38 and 40 was seen spanning the concentration range. These curves were close in value (Fig. 4A). Sensitivity using the remaining offsets, 42 through 56, progressively decreased, an observation readily visible especially at the lower TR-RSA concentrations. Data obtained from the spectrophotometer presented in this manner also exhibit a linear relationship between the fluorescence intensities and the conjugate concentrations (Fig. 4B).
Figure 4.
Effect of increasing offsets on sensitivity. Intensity data from Figure 2 was normalized to the individual concentrations to evaluate sensitivity. (A) The sensitivity values expressed as fluorescence units/µg/mL remain relatively constant for offsets between 35–40, even at the lowest concentration of 6.25 µg/mL of TR-RSA. In contrast, the sensitivity of the remaining higher offsets starts low at the lowest concentration and climbs gradually. The two lowest offsets (52 and 56) show no appreciable detection capabilities until a concentration of ~16.67 µg/mL TR-RSA. The sensitivity values for the spectrophotometer shown in (B) denote a curve virtually identical to offsets 35–40 for the varying TR-RSA concentrations examined.
Intravital imaging of glomerular permeability of fluorescent rat serum albumin
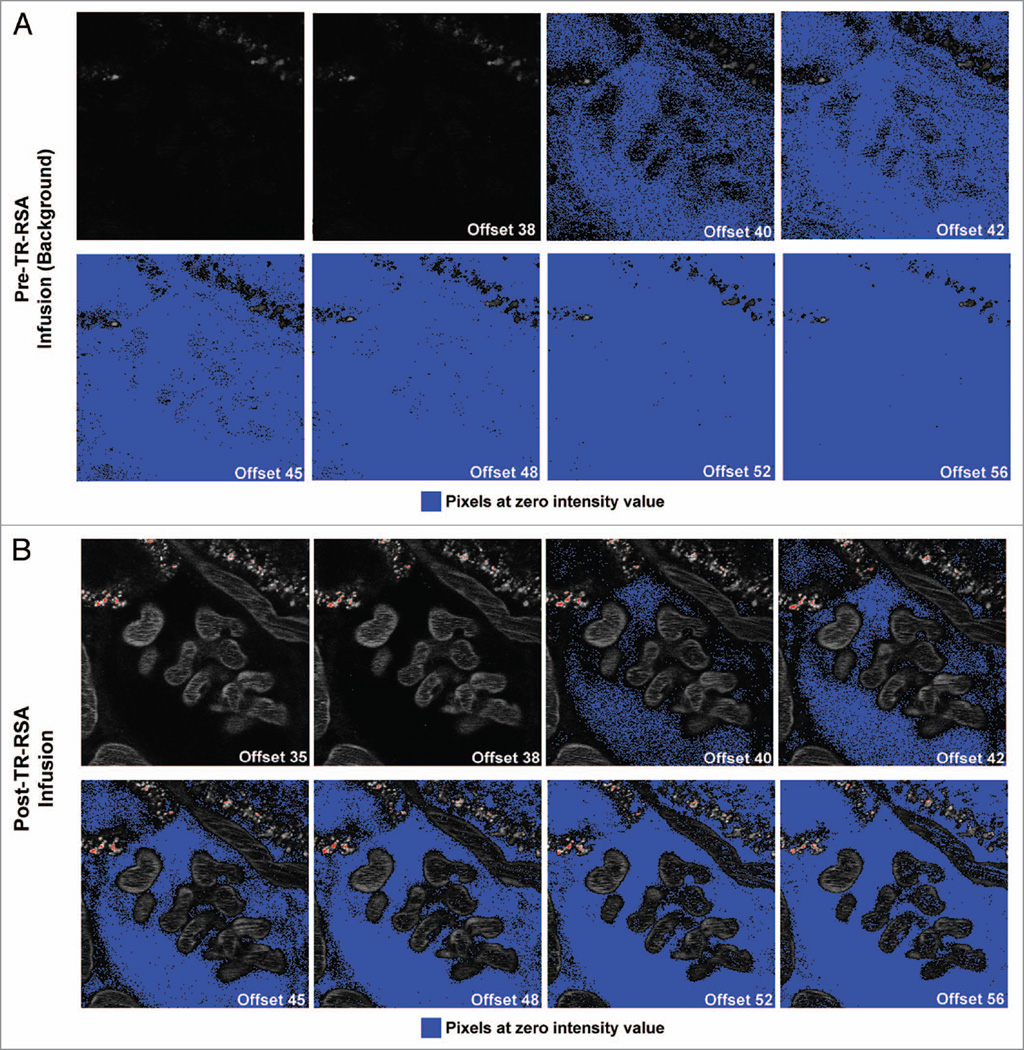
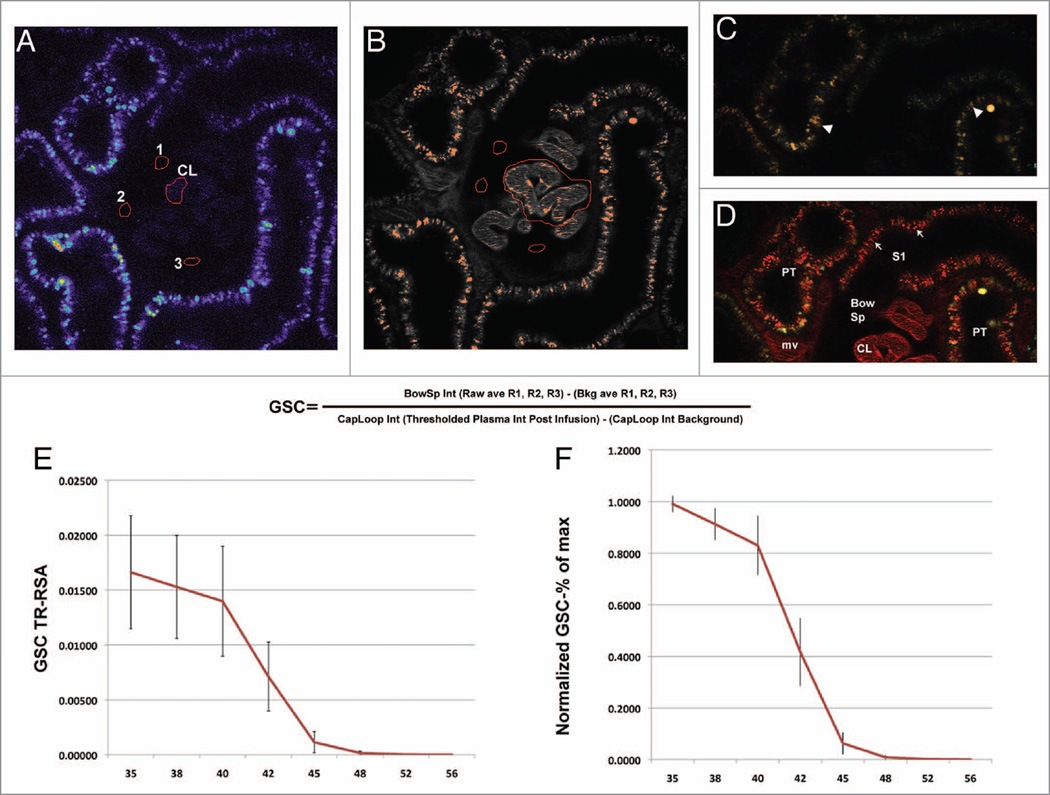
Using a set of offsets that were extensively characterized in vitro using a range of TR-RSA solutions, we next set out to determine if the same effects on sensitivity and detection persisted in an intravital study aimed at determining glomerular albumin permeability. In results very similar to those seen for the in vitro study (Fig. 1), Figure 5A showed background images acquired, to be used for background subtraction, having the same increased progression of pixels being pushed to values of zero as the offset values were increased. When looking at images after TR-RSA infusion (Fig. 5B), the same Bowman’s space surrounding the capillary loops in the center, used in the detection of filtered albumin, displayed a greater number of pixels showing values of zero. Glomerular Sieving Coefficients for albumin were subsequently calculated. Figure 6 shows how background values for Bowman’s space and capillary loops are selected and recorded (Fig. 6A) to subtract from the values obtained using the identical focal plane after infusion of TR-RSA (Fig. 6B). Figure 6C and D shows a color image of a glomerulus before and after infusion of TR-RSA. Albumin filtered across capillary loops (CL) is retrieved by the early S1 proximal tubule (S1) segment found adjacent to the glomerulus, as well as later S2 proximal tubule segments (PT). The formula for calculating the glomerular sieving coeffecient of labeled albumin (GSC) is shown in Fig. 6A–D. Fig. 6E shows GSC values generated from 15 glomeruli from 2 Simonsen’s Munich Wistar rats at 10 weeks of age. Lower offsets resulted in Bowman’s Space values that did not contain a large number of pixels at zero. These background subtracted values generated higher GSC values. As offsets were increased glomeruli generated GSC values that decreased several orders of magnitude. When these values for each glomeruli were normalized to the highest value (shown in Fig. 6F) a better representation of the effect of increasing offset could be seen. For the first three offsets examined (35, 38 and 40), the GSC remained within ~80% of the maximum value. However, the value for offset 42 dropped to ~41% ± 13% and for 45 it dropped to 6% ± 4%. For offsets of 48, 52 and 56 these values were virtually undetectable dropping to less than 0.001% ± 0.0004% of maximum value.
Figure 5.
Effect of increasing offset on pixel intensity values within the glomerulus in Munich Wistar rats. Two-photon intravital images display an increasingly greater number of pixels with values at zero as the offset value was increased. Series (A) shows a 250×250 pixel region of background images with a glomerulus centered and offsets labeled from 35 through 56. Concomitant with an increase in offset, more pixels are pushed to values of zero as seen with the PBS blanks in Figure 1. Images taken after infusion of Texas Red rat serum albumin (TR-RSA) show distribution throughout the peritubular vasculature and glomerular capillary loops in the center as shown in series (B). The Bowman’s Space containing the glomerular filtrate became increasingly distinguishable as the intensity values of the pixels within are pushed to zero. For this macromolecule of ~66 kDa a noticeable amount of pixels with intensity values at zero within the Bowman’s Space first occurred at offset 40. As the offset increased, additional structures such as part of the capillary loops and S1 proximal tubule segment at the upper left showed diminished fluorescent intensity (image = 104 µm across).
Figure 6.
The effect of offset on the calculated GSC of albumin. The Glomerular Sieving Coefficient of Texas Red rat serum albumin (TR-RSA) was markedly reduced as offset was increased. (A) An image of a glomerulus before infusion of TR-RSA. Average intensity values for small areas within the Bomwan’s space (labeled 1, 2, and 3) are taken and averaged to provide background values. A region within the capillary loop (CL) is taken to provide a background value. (B) An image of a glomerulus taken after infusion of TR-RSA. The regions for the Bowman’s space are transferred to take identical measurements. Within the center region of capillary loops, the area is thresholded to outline only the brightest pixel values at the edges. (C and D) An image of the same glomerulus pre and post infusion of TR-RSA, respectively. The arrowheads in (C) point to lysosomes, found within proximal tubules, having a characteristic yellow/orange autoflourescence when viewed by a dual-pass Rhodamine/FITC cube. (D) Retrieval of filtered intact TR-RSA (arrows) accumulated within the endosomal/transcytotic pool of the early S1 segment and proximal tubules (PT). Note the distinct red fluorescence associated with TR-RSA. The Bowman’s space (Bow Sp) and capillary loops (CL) are easily distinguished from the surrounding microvasculature (mv). The formula for calculating GSC is shown in the center. Panel (E) shows the average GSC values obtained from 2 male Simonsen’s MW rats at 10 weeks of age (n = 15 glomeruli). For offsets 35, 38, and 40, the values were 0.0166 ± 0.0051, 0.0152 ± 0.0047, and 0.0139 ± 0.0050; respectively. For images taken at offsets 42, 45, 48, 52 and 56 these values dropped off dramatically, with values of 0.0071 ± 0.0031, 0.00114 ± 0.00096, 0.00016 ± 0.00017, 0.00003 ± 0.000058, and 0.0000 ± 0.0000; respectively. Panel (F) shows these same GSC ’s normalized to the highest value within each glomeruli to delineate the magnitude of the decrease as the offset was increased. When offset setting between 35–40 were used the GSC values were all within 80% of the maximum; conversely, increasing the offset by only two to 42 quickly dropped the GSC value to ~40% of the maximum. Subsequent values rapidly dropped again to ~6% of the maximum at offset 45 and virtually zero at greater offsets (images ~204 µm across).
Discussion
Errors in quantitative fluorescence microscopy measurements may be introduced by the specimen, the microscope, or the detector. The present studies detailing image acquisition parameters, used in the detection of low intensity values within tissue, serve to illustrate the importance of appropriate offsets for quantitative analysis of low fluorescence signals. Intuitively, the method of using higher offsets seems the most straightforward and efficient because when offsets are set high enough it negates the need to acquire background images for subtraction, which can be time consuming. However, once the output value from the PMT is adjusted (using the offset) to a level that is below the threshold corresponding to the zero values of the digitizer, it will be digitized as zero. In other words, once digitized as zero it is impossible to differentiate otherwise detectable low signals from the background on an image. Therefore, careful attention must be taken to assure accurate findings on the 2-photon microscope when detection of low signal is required. In vitro analysis of a serial dilution of TR-RSA (Figs. 1–4) was the only method that could be corroborated by another analytical method, the spectrophotometer. The serial dilutions of TR-RSA studied at the various offsets uncovered an associated loss in sensitivity and nonlinearity with the higher offsets, particularly for the lower concentrations of TR-RSA. When intensity values were normalized to their respective concentration to derive a relative sensitivity value (Fig. 4), a nearly constant value across the concentration range seen with the spectrophotometer should have occurred with the 2-photon data. Instead, this was seen only with the lower offset values. The higher offsets had no appreciable sensitivity to the lower concentrations of TR-RSA. Images from the in vitro and intravital data were background corrected so the higher values could not be attributed to any background intensities.
Within the kidney (Fig. 5), the glomerular filtration of albumin under physiologic conditions contains TR-RSA intensity values that would fall within the lower concentration range studied here.18,21–23 Therefore, it is not surprising that the data mimicked the effect the higher offsets had on the lower concentrations of TR-RSA examined in vitro. Therefore, the lower intensity values, stemming from relatively low concentrations of filtered albumin, fell below the detection capabilities at the higher offsets. When the glomerular sieving coefficients (GSC’s) for the same glomeruli, at the various offsets were compared, a decrease in orders of magnitude occurred. Typically our previous studies18 use an offset of 38 and the GSC’s we report here (Fig. 6E 0.015 ± 0.0047) are within the range of our previous values.18,21–23 Glomerular sieving coefficient values normalized to the maximum GSC value reported within each glomerulus (Fig. 6F) will compensate for intra-glomerular variability and better illustrate the effect of offset settings on detecting filtered albumin.
Our values for GSC are in contrast to those emanating from another investigator24,25 which have been orders of magnitude lower (≤ 0.0006). The data from this current study strongly suggest this is due the use of inappropriately high offsets used to drop background values in the glomerulus essentially to zero. This minimized their ability to detect and correctly quantify low intensity values. Other suggestions for this discrepancy have been offered.26 Among these differences reported, the bit-depth of the detection system is an unlikely source. It is a common misconception that a higher dynamic range for detection can be achieved by increasing the number of gray levels. In biological microscopy the fluorescence intensity level is usually very low. Even for the brightest pixels only 10–20 photons are collected by the detector.20 Eight-bit images, for example, have a gray scale with 256 units, which exceed the number of detected photons by more than an order of magnitude. This explains why consistent values for albumin permeability have been reported using our 8-bit Bio- Rad MRC-1024 and the Olympus FV1000 system with 12-bit GaAsP detectors. In the present study our data provide evidence that setting offsets to generate background values at or near zero on only a few random pixels in tissue is the far better approach when it is necessary to quantify low intensity signals.
The results from this study underscore the need to standardize image acquisition parameters particularly in cases where subtle changes in instrument settings can profoundly affect data. Moreover, a fresh look at background values and their implications in whole tissue imaging requires further study. Background correction protocols derived from imaging samples with low autofluorescence, such as cultured cell monolayers, do not appear to be the best approach when imaging intravital tissues. Finally, it appears offset settings account for the disparity in glomerular albumin permeability values reported in studies from two different groups,18,22–25 as we were able to quantify permeability values spanning orders of magnitude within individual glomeruli by varying the offset settings.
Materials and Methods
Solutions and fluorescent beads
Texas Red conjugated Rat Serum Albumin (TR-RSA) was conjugated as previously described to a final stoichiometric ratio of 4:1 fluorophore:albumin (Texas Red Sulfonyl Chloride, Invitrogen, T-353; Rat Serum Albumin, Sigma-Aldrich, A-6272). Serial dilutions with a final concentration in PBS of 6.25, 7.1, 8.33, 10, 12.5, 16.67, 25 and 50 µg/mL were made for testing sensitivity of the 2-photon system in vitro. Green fluorescent beads with an average size of 4.16 µm (Bangs Lab, F-505F) were added to the solutions when testing the 2-photon system to acquire images at a consistent focal plane as the beads were allowed to settle on the dish and a cross section of the beads resting on the coverslip was used consistently as the focal plane of interest.
Spectrophotometry
The dilutions of TR-RSA were placed in 96 well plates (n = 5 per dilution) and read using a 590nmex, 620nmem 615nmcuttoff filter and read using the more sensitive “Bottom Read” function on a Spectramax M5 spectrophotometer (Molecular Dynamics). Blank PBS values were acquired and used to subtract from raw values to generate background corrected values.
Preparing the rats for intravital microscopy
Two male Simonsen’s Munich Wistar rats at 10 weeks of age allowed ad libitum access to food and water were used for the study, which generated data from 15 glomeruli. Rats were prepared as previously described;18 briefly, they were anesthetized with Inactin hydrate C-III (Sigma-Aldrich, T133-1G), an indwelling i.v. jugular line was placed to infuse in a bolus of TR-RSA and normal saline at 1.5 cc/Hr. A femoral arterial line was attached to a pressure transducer to monitor blood pressure, heart rate, body temperature and temperature of normal saline solution in coverslip bottom dish.
Intravital microscopy
All 2-photon microscopy was performed as previously described18 on an Olympus FV1000 system using external non-descanned GaAsP detectors in the red and green channels. For both in vitro and intravital studies, images at listed offsets (Table 1) were acquired rapidly, taking no more than 30 sec to acquire a series. The sample was illuminated only once per offset at the focal plane of interest thereby preventing excessive illumination.
Table 1.
Microscope settings for in vitro and intravital image acquisistion
| Laser transmission: 10%, 800 nm ex | Laser transmission: 15%, 800 nm ex | ||||
|---|---|---|---|---|---|
| In vitro | Gain | Offset | Intravital | Gain | Offset |
| Green em 525/50 | 500 | 47 | Green em 525/50 | 750 | 47 |
| Red em 605/90 | 625 | 35, 38, 40, 42, 45, 48, 52, 56 | Red em 605/90 | 625 | 35, 38, 40, 42, 45, 48, 52, 56 |
Offset testing to determine lower limits of sensitivity
Images were acquired from numerically low to high offset values (a setting that will determine the lower limit of detection within any digital 2-photon/confocal system). At the end of the series a 2nd set of offset 38 images was acquired and analyzed to assure no decrease in intensity occurred which could be attributed to photo-bleaching.
Glomerular Sieving Coefficients (GSCs)
Glomerular Sieving Coeffecients are values used to determine the permeability of a molecule across the renal filtration barrier by ratioing the concentration in filtrate (Bowman’s space) by the concentration in the plasma. Glomerular Sieving Coefficient values were presented here in ratio form as well as normalized to the highest value for each individual glomeruli to compare the effect of offset.
Image analysis
Numerical values from the images were extracted using Metamorph offline v6.1 (Universal maging/Molecular Dynamics) and processed using Microsoft Excel (Office suite 2007). Glomerular Sieving Coefficients (GSC) was determined as previously described18,22,23 and shown in Figure 6. For both the in vitro and intravital data, background values were subtracted from the images collected to give corrected values for the in vitro data, and capillary loop and Bowman’s space values when calculating Glomerular Sieving Coeffecients. For the lower numerical offset values an average background value was usually a positive integer while those of higher offsets were zero.
Acknowledgments
We are grateful for the discussions and input from Dr Kenneth W. Dunn during the writing of the manuscript. We would also like to thank Dr Silvia B Campos-Bilderback for her assistance with surgical procedures and Sarah E. Wean for maintaining the colony of Munich Wistar rats. This work was supported by funding provided to the Indiana Center for Biological Microscopy, and the National Institutes of Health grants P30-DK079312, and 5RO1-DK091623 awarded to B.A.M.
Footnotes
Disclosure of Potential Conflicts of Interest
No potential conflicts of interest were disclosed.
References
- 1.Dunn KW, Sandoval RM, Kelly KJ, Dagher PC, Tanner GA, Atkinson SJ, et al. Functional studies of the kidney of living animals using multicolor twophoton microscopy. Am J Physiol Cell Physiol. 2002;283:C905–C916. doi: 10.1152/ajpcell.00159.2002. PMID:12176747. [DOI] [PubMed] [Google Scholar]
- 2.Masedunskas A, Milberg O, Porat-Shliom N, Sramkova M, Wigand T, Amornphimoltham P, et al. Intravital microscopy: A practical guide on imaging intracellular structures in live animals. Bioarchitecture. 2012;2:143–157. doi: 10.4161/bioa.21758. PMID:22992750. [DOI] [PMC free article] [PubMed] [Google Scholar]
- 3.Zipfel WR, Williams RM, Webb WW. Nonlinear magic: multiphoton microscopy in the biosciences. Nat Biotechnol. 2003;21:1369–1377. doi: 10.1038/nbt899. PMID:14595365; http://dx.doi.org/10.1038/nbt899. [DOI] [PubMed] [Google Scholar]
- 4.Wyckoff J, Gligorijevic B, Entenberg D, Segall J, Condeelis J. High-resolution multiphoton imaging of tumors in vivo. Cold Spring Harb Protoc. 2011:1167–1184. doi: 10.1101/pdb.top065904. [DOI] [PMC free article] [PubMed] [Google Scholar]
- 5.Benninger RK, Hao M, Piston DW. Multi-photon excitation imaging of dynamic processes in living cells and tissues. Rev Physiol Biochem Pharmacol. 2008;160:71–92. doi: 10.1007/112_2008_801. PMID:18418560. [DOI] [PubMed] [Google Scholar]
- 6.Helmchen F, Denk W. Deep tissue two-photon microscopy. Nat Methods. 2005;2:932–940. doi: 10.1038/nmeth818. PMID:16299478; http://dx.doi.org/10.1038/nmeth818. [DOI] [PubMed] [Google Scholar]
- 7.Molitoris BA, Sandoval RM. Pharmacophotonics: utilizing multi-photon microscopy to quantify drug delivery and intracellular trafficking in the kidney. Adv Drug Deliv Rev. 2006;58:809–823. doi: 10.1016/j.addr.2006.07.017. PMID:17064810; http://dx.doi.org/10.1016/j.addr.2006.07.017. [DOI] [PubMed] [Google Scholar]
- 8.Niesner RA, Hauser AE. Recent advances in dynamic intravital multi-photon microscopy. Cytometry A. 2011;79:789–798. doi: 10.1002/cyto.a.21140. PMID:21905212; http://dx.doi. org/10.1002/cyto.a.21140. [DOI] [PubMed] [Google Scholar]
- 9.Peti-Peterdi J, Burford JL, Hackl MJ. The first decade of using multiphoton microscopy for highpower kidney imaging. Am J Physiol Renal Physiol. 2012;302:F227–F233. doi: 10.1152/ajprenal.00561.2011. PMID:22031850; http://dx.doi. org/10.1152/ajprenal.00561.2011. [DOI] [PMC free article] [PubMed] [Google Scholar]
- 10.Dela Cruz JM, McMullen JD, Williams RM, Zipfel WR. Feasibility of using multiphoton excited tissue autofluorescence for in vivo human histopathology. Biomed Opt Express. 2010;1:1320–1330. doi: 10.1364/BOE.1.001320. PMID:21258552; http://dx.doi.org/10.1364/BOE.1.001320. [DOI] [PMC free article] [PubMed] [Google Scholar]
- 11.Kelly KJ, Sandoval RM, Dunn KW, Molitoris BA, Dagher PC. A novel method to determine specificity and sensitivity of the TUNEL reaction in the quantitation of apoptosis. Am J Physiol Cell Physiol. 2003;284:C1309–C1318. doi: 10.1152/ajpcell.00353.2002. PMID:12676658. [DOI] [PubMed] [Google Scholar]
- 12.Imamura R, Isaka Y, Sandoval RM, Ichimaru N, Abe T, Okumi M, et al. A nonerythropoietic derivative of erythropoietin inhibits tubulointerstitial fibrosis in remnant kidney. Clin Exp Nephrol. 2012;16:852–862. doi: 10.1007/s10157-012-0647-x. PMID:22678524; http://dx.doi.org/10.1007/s10157-012-0647-x. [DOI] [PMC free article] [PubMed] [Google Scholar]
- 13.Imamura R, Isaka Y, Sandoval RM, Ori A, Adamsky S, Feinstein E, et al. Intravital two-photon microscopy assessment of renal protection efficacy of siRNA for p53 in experimental rat kidney transplantation models. Cell Transplant. 2010;19:1659–1670. doi: 10.3727/096368910X516619. PMID:20719069; http://dx.doi.org/10.3727/096368910X516619. [DOI] [PubMed] [Google Scholar]
- 14.Hall AM, Rhodes GJ, Sandoval RM, Corridon PR, Molitoris BA. In vivo multiphoton imaging of mitochondrial structure and function during acute kidney injury. Kidney Int. 2012;83:72–83. doi: 10.1038/ki.2012.328. PMID:22992467. [DOI] [PMC free article] [PubMed] [Google Scholar]
- 15.Dunn KW, Sutton TA, Sandoval RM. Live-animal imaging of renal function by multiphoton microscopy. Curr Protoc Cytom. 2012;Chapter 14 doi: 10.1002/0471142956.cy1209s62. Unit12 9. [DOI] [PMC free article] [PubMed] [Google Scholar]
- 16.Choong FX, Sandoval RM, Molitoris BA, Richter-Dahlfors A. Multiphoton microscopy applied for real-time intravital imaging of bacterial infections in vivo. Methods Enzymol. 2012;506:35–61. doi: 10.1016/B978-0-12-391856-7.00027-5. PMID:22341218; http://dx.doi.org/10.1016/B978-0-12-391856-7.00027-5. [DOI] [PMC free article] [PubMed] [Google Scholar]
- 17.Masedunskas A, Porat-Shliom N, Weigert R. Regulated exocytosis: novel insights from intravital microscopy. Traffic. 2012;13:627–634. doi: 10.1111/j.1600-0854.2012.01328.x. PMID:22243493; http://dx.doi.org/10.1111/j.1600-0854.2012.01328.x. [DOI] [PMC free article] [PubMed] [Google Scholar]
- 18.Sandoval RM, Wagner MC, Patel M, Campos-Bilderback SB, Rhodes GJ, Wang E, et al. Multiple factors influence glomerular albumin permeability in rats. J Am Soc Nephrol. 2012;23:447–457. doi: 10.1681/ASN.2011070666. PMID:22223875; http://dx.doi.org/10.1681/ASN.2011070666. [DOI] [PMC free article] [PubMed] [Google Scholar]
- 19.Sandoval RM, Molitoris BA. Quantifying endocytosis in vivo using intravital two-photon microscopy. Methods Mol Biol. 2008;440:389–402. doi: 10.1007/978-1-59745-178-9_28. PMID:18369960; http://dx.doi.org/10.1007/978-1-59745-178-9_28. [DOI] [PubMed] [Google Scholar]
- 20.Pawley J, editor. Handbook of Biological Confocal Microscopy. New York, NY: Springer Science+Business Media, LLC; 2006. [Google Scholar]
- 21.Saleh MA, Sandoval RM, Rhodes GJ, Campos-Bilderback SB, Molitoris BA, Pollock DM. Chronic endothelin-1 infusion elevates glomerular sieving coefficient and proximal tubular albumin reuptake in the rat. Life Sci. 2012;91:634–637. doi: 10.1016/j.lfs.2012.06.007. PMID:22727794; http://dx.doi.org/10.1016/j.lfs.2012.06.007. [DOI] [PMC free article] [PubMed] [Google Scholar]
- 22.Russo LM, Sandoval RM, Campos SB, Molitoris BA, Comper WD, Brown D. Impaired tubular uptake explains albuminuria in early diabetic nephropathy. J Am Soc Nephrol. 2009;20:489–494. doi: 10.1681/ASN.2008050503. PMID:19118149; http://dx.doi.org/10.1681/ASN.2008050503. [DOI] [PMC free article] [PubMed] [Google Scholar]
- 23.Russo LM, Sandoval RM, McKee M, Osicka TM, Collins AB, Brown D, et al. The normal kidney filters nephrotic levels of albumin retrieved by proximal tubule cells: retrieval is disrupted in nephrotic states. Kidney Int. 2007;71:504–513. doi: 10.1038/sj.ki.5002041. PMID:17228368; http://dx.doi.org/10.1038/sj.ki.5002041. [DOI] [PubMed] [Google Scholar]
- 24.Nakano D, Kobori H, Burford JL, Gevorgyan H, Seidel S, Hitomi H, et al. Multiphoton imaging of the glomerular permeability of angiotensinogen. J Am Soc Nephrol. 2012;23:1847–1856. doi: 10.1681/ASN.2012010078. PMID:22997258; http://dx.doi.org/10.1681/ASN.2012010078. [DOI] [PMC free article] [PubMed] [Google Scholar]
- 25.Salmon AH, Ferguson JK, Burford JL, Gevorgyan H, Nakano D, Harper SJ, et al. Loss of the endothelial glycocalyx links albuminuria and vascular dysfunction. J Am Soc Nephrol. 2012;23:1339–1350. doi: 10.1681/ASN.2012010017. PMID:22797190; http://dx.doi.org/10.1681/ASN.2012010017. [DOI] [PMC free article] [PubMed] [Google Scholar]
- 26.Peti-Peterdi J. Independent two-photon measurements of albumin GSC give low values. Am J Physiol Renal Physiol. 2009;296:F1255–F1257. doi: 10.1152/ajprenal.00144.2009. PMID:19297453; http://dx.doi.org/10.1152/ajprenal.00144.2009. [DOI] [PMC free article] [PubMed] [Google Scholar]


