Abstract
Background
Although cytological screening for cervical precancers has led to a reduction of cervical cancer incidence worldwide it is a subjective and variable method with low single-test sensitivity. New biomarkers like p16 that specifically highlight abnormal cervical cells can improve cytology performance. Virtual microscopy offers an ideal platform for assisted evaluation and archiving of biomarker-stained slides.
Methods
We first performed a quantitative analysis of p16-stained slides digitized with the Hamamatsu NDP slide scanner. From the results an automated algorithm was created to reliably detect cells, nuclei, and p16-stained cells. The algorithm's performance was evaluated on two complete slides and tiles from 52 independent slides (11.628, 4.094 and 25.619 cells/clusters respectively).
Results
We achieved excellent performance to discriminate unstained cells from nuclei and biomarker-stained cells. The automated algorithm showed a high overall and positive agreement (99.0-99.7% and 70.9-83.4%, respectively) with the gold standard and had a very high sensitivity (89.1-100.0%) and specificity (98.9-100.0%) to detect biomarker-stained cells.
Conclusion
We implemented a virtual microscopy system allowing highly efficient automated prescreening and archiving of biomarker-stained slides. Based on the initial results, we will evaluate the performance of our system in large epidemiologic studies against disease endpoints.
Introduction
Current cervical cancer screening is based on annually repeated cytological evaluations to detect and treat cervical precancers. Since its introduction in the 1970s in many industrialized countries, cytology-based cervical cancer screening has led to a substantial reduction of cervical cancer incidence and mortality in these countries[15]. Despite this success, cervical cytology has several limitations: The single-test sensitivity to detect prevalent CIN2 or greater is only 50-60% [22]; thus, to achieve sufficient security, Pap screening is repeated annually. The frequent repetition of tests is costly and bears the risk of generating false positive results. Overall, cytology is subjective and only poorly standardized; there are many different techniques, different cytology classifications, and high inter- and intra-observer variability.
A lot of progress has been made over the past years to improve cervical cancer prevention. It is now generally accepted that cervical cancer is caused by infections with carcinogenic human papillomavirus types (HPV) [15, 23]. The recent introduction of vaccines targeting two HPV types, HPV16 and HPV18, which are responsible for about 70% of cervical cancers worldwide, may substantially reduce the load of cervical cancer and precancer if vaccination is widely implemented [15]. Recent results from large randomized controlled clinical trials have demonstrated that HPV testing can be efficiently used as a primary screening test and may allow extending screening intervals to 3 or even 5 years in HPV-negative women [2, 11, 14].
Despite these challenges, Pap cytology will remain the primary screening test for a substantial time, and even in a future scenario with primary HPV screening, a cytology-based test may be important as a triage test [6]. Efforts to improve the efficiency of Pap testing include standardization of sampling and staining, improvement of quality control, and developing assisted or automated evaluation systems. In addition, several biomarkers are currently evaluated that can be analyzed on cytological specimens and may substantially improve sensitivity and specificity [21]. One such biomarker is p16, a cellular tumor suppressor that is strongly upregulated in cervical precancer and cancer [10]. p16 immunohistochemistry is widely used to improve the assessment of cervical histology [4, 17]. Recently, cytological applications using p16 staining have been developed and successfully used in cervical cancer screening studies [3, 19, 20]. These studies have demonstrated that cytologic specimens from women with precancer may contain very few or up to hundreds of abnormal, biomarker-highlighted cells. Detecting rare events in a manual screen is tedious, error-prone, and represents an ideal task for automated color-based cell detection. Beyond this, image processing may also support the assessment of stained cells.
Current automated Pap evaluation systems are based on conventional microscopes and assist the cytology evaluation process by reducing the number of normal slides to be analyzed or by presenting the most abnormal cells on a slide. The limitation of these systems is that they are not suited for generating and archiving virtual slides at a large scale. Expert cytologists and slides need to be at the same physical location and multi-observer evaluations require physical sending of slides. Physical storage space for cytology specimens can be limited and many novel biomarker stains fade over time and do not allow for long time storage without compromising the original results.
Recently, slide scanners have become available that are capable of generating digital microscopic images of full histological or cytological slides. After completion of image acquisition, digital images can be studied in seamless levels of magnification. In addition, some systems allow generating and displaying images at different focus levels to visualize three-dimensional structures within the cytological sample. Horizontal and vertical image browsing is usually implemented in highly efficient internet viewers connected to dedicated image servers. Thus, after scanning, virtual microscopic slides can be viewed by a pathologist completely independent of the physical location of the glass-slide or the sample [9].
In this study, we developed the prototype of a system capable of scanning virtual slides, automatically separating cell clusters and individual cells, detecting nuclei and cytoplasm, and identifying biomarker-stained cells.
Materials and methods
Cytology samples and immunostaining
All analyses were conducted on cytological specimens generated using the Thinprep system (Hologic) [16]. PreservCyt containers were obtained from a routine cytology lab and were anonymized not linkable to patient names or other patient data. Slides were generated using the T2000 processor. All slides were stained using the CinTec p16 cytology kit (mtm Laboratories, Heidelberg, Germany) according to the manufacturer's instructions. Briefly, slides were incubated with a monoclonal antibody (E6H4) directed against p16, followed by a second antibody linked to horseradish peroxidase and detected by adding DAB substrate, generating a brown stain. All slides were counterstained with Hematoxylin.
Scanning System and Software
All slides were scanned on a NanoZoomer NDP system with 20x resolution (0.46 μm / pixel) (Hamamatsu Photonics, Hamamatsu-City, Japan). For the image database the NDP.serve slide image system of Hamamatsu Photonics was used. The image analysis software has been developed using MatLab R2008a (The Mathworks, Natick, USA) with the image processing toolbox. Statistical calculations have been performed using Microsoft Excel (Microsoft, Redmond, USA) and SPSS (SPSS, Chicago, USA).
Image processing
Scanning of the cytological specimens at 20fold magnification resulted in image sizes of 65K x 50K pixels to be processed per slide. Complete scans were separated into tiled subimages to allow for efficient analysis. We determined tiles of 2000 x 2000 pixels as an optimal size by analyzing algorithm runtimes with various image sizes (data not shown). To avoid loss of information at tile borders, each tile was extended by 100 μm (217 pixels in 20x resolution). Cells and clusters present on two adjacent tiles that had identical coordinates in the overlapping area were combined to a single annotated object as illustrated in Fig. 1a.
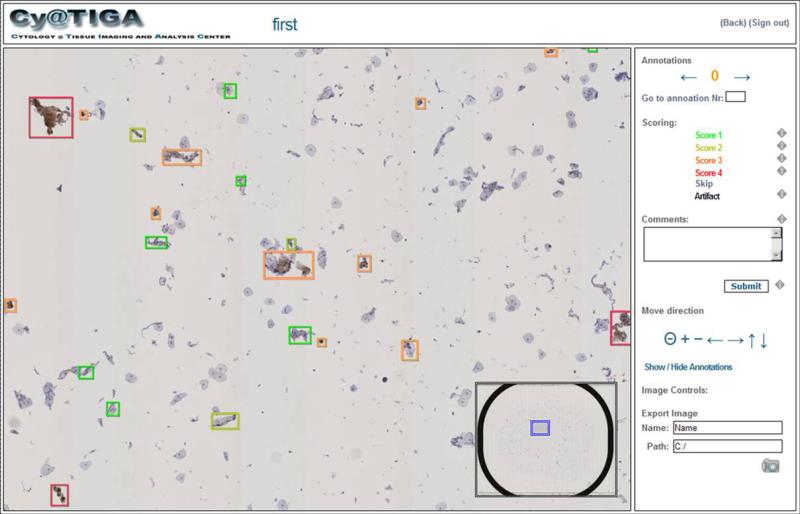
Figure 1. Web interface of the cytology server application.
The web interface allows free panning, zooming and focusing as well as “one click” diagnostic decisions of the computationally pre-screened cytological slide. Instead of an image gallery, the user is walked through the virtual slide via a precomputed navigation route allowing the evaluation of all objects in their natural spatial context. Each object (cell or cell cluster) can be assigned a score by a single mouse click; free-text comments can be added.
Object detection was performed after conversion of the subimages into grey scale. Grey scale images were calculated using the internal MatLab routines rgb2gray, which converts the RGB images to grayscale images by forming a weighted sum of the R, G, and B components: R * 0.2989 + G * 0.5870 + B * 0.1140. In the subimages, the Otsu method was used to separate a bimodal distribution of grey values into two classes, i.e. background and cells/cell clusters.
Detection of nuclei, cytoplasm and p16 stained cells was performed by transforming RGB Color (Red-Green-Blue) images of the objects into HSV color space [8]. In the RGB color space, colors are defined by three values for red, green, and blue channels. These values indirectly imply a certain saturation and intensity. By contrast, a color in the HSV color space model is defined by a single coordinate (hue), enhanced by the two coordinates saturation (addition of white) and value (brightness). Therefore, in this color model, different colors can be – to a certain extent - separated based on the hue value alone. Based on the determined HSV parameters we designed fix-bounds and probability based pixel classifiers. The probability based classifier uses a weighted function p to describe the probability of a pixel belonging to a nucleus. For the probability functions normal distributions - centered around the mean values of the according intervals in the individual HSV channels - were used. For the exact values used for both classifiers we refer to the paragraph “Analysis of the HSV color space” in the section “Results”.
Cytology webstation and Slide database
All virtual slides were stored in the relational database system Hamamatsu NDP.server virtual slide server. On all subimages of the virtual slide objects containing a p16INK4a stain are identified by the image analysis described in the following sections. From the results, an XML file is generated containing the absolute coordinates of all detected p16 cells and cell cluster, all objects, all nuclei and potential artifacts regarding the complete virtual slide. During this process objects spanning two tiles (e.g. large cell clusters) are united. The XML file is then exported to the virtual slide image database forming an annotation file corresponding to the slide image file. Thus the NDP.slide server holds the virtual slides as well as all annotations, but both as separate entities.
We developed a novel web server application (CyTIGA Server) which provides a user interface for cytological evaluation as shown in Fig. 1. This web server handles internal communication with the NDP.slide server image database. To work with the CyTIGA Server a standard browser connected to the internet is necessary for assessing preprocessed cytological slides allowing for the analysis of slides completely independent from the geographical position of the glass slides and any server infrastructure. The CyTIGA Server provides one-click diagnostic decision-buttons but also offers virtual slide browsing features. This allows interactive navigation through the slide guided by a pre-computed navigation route visiting all or only biomarker-stained objects. The one-click decision-buttons allow fast and simple scoring of each object by an expert. Predefined fields or free-text fields can be used to store additional information.
Statistical evaluation
To define a gold standard for p16-positive cell detection we performed a three pass evaluation. In the first pass an observer annotated the slides manually. In an independent second pass the automated algorithm was used for detecting p16-stained cells. The discrepant events from both passes were then manually reassessed by the observer in a third pass. Discrepant findings – independent if they were identified by the algorithm or the observer - were classified into the categories negative, positive or artifact (e.g. debris, bubbles). Cells rated positive after the third pass were included in the positive reference set (Gold+) while negatively rated objects and artifacts were assigned to the negative reference set (Gold-). The results labeled “Manual+/−” of Table 1 represent the objects rated positive or negative by the observer in the first pass. “Automated+/−” refers to the objects rated positive or negative by the algorithm (second pass). Overall and positive agreement and McNemar's test was used to compare the automated and manual evaluation to the gold standard.
Table 1.
Statistical analysis of classification algorithm In 2 complete slides as well as in 52 tiles from different slides, automated and manual detection of p16-stained cells was compared. Gold+/− denotes the number of cells or cell clusters rated positive/negative after 3 pass analysis of the same slide (2 manual and 1 automatic). Agr: percent overall agreement of algorithm and observer; pos Agr: percent agreement among positively rated cells; McNemar: McNemars test to analyze direction of discrepant results; Sens: sensitivity, Spec = specificity.
| Gold+ | Gold− | Agr | pos Agr | McNemar | Sens | Spec | ||
|---|---|---|---|---|---|---|---|---|
| Slide 1 | Automated+ | 99 | 21 | 99.7% | 75.6% | 0.11 | 90.0% | 99.8% |
| Automated− | 11 | 11,607 | ||||||
| Slide 1 | Manual+ | 109 | 0 | 100.0% | 90.9% | 0.05 | 99.1% | 100.0% |
| Manual− | 1 | 11,628 | ||||||
| Slide 2 | Automated+ | 226 | 45 | 99.0% | 83.4% | 0.00 | 100.0% | 98.9% |
| Automated− | 0 | 4,048 | ||||||
| Slide 2 | Manual+ | 222 | 0 | 99.9% | 98.2% | 0.01 | 98.2% | 100% |
| Manual− | 4 | 4,093 | ||||||
| 52 Tiles | Automated+ | 407 | 117 | 99.4% | 70.9% | 0.00 | 89.1% | 100.0% |
| Automated− | 50 | 25,502 | ||||||
| 52 Tiles | Manual+ | 411 | 27 | 99.7% | 84.9% | 0.00 | 84.4% | 100.0% |
| Manual− | 46 | 25,592 |
Statistical entities for the following measures were individual cells or cell clusters respectively. Overall and positive agreements refer to the “raw agreement indices” of descriptive statistics for assessing the agreement between two independent observers. Overall agreement measures the percent agreement of e.g. the automated algorithm versus the gold standard as the sum of Automated+/Gold+ and Automated-/Gold- normalized by the sum of Automated+, Gold+, Automated-, Gold-. Positive agreement only measures the by the gold standard and the automated algorithm positively rated events Automated+/Gold+. The McNemar test assesses the statistical significance of the difference between Automated+/Gold- and Automated-/Gold+ (homogenous disagreement). Further, the conventional sensitivity and specificity measures were used.
Results
Object detection
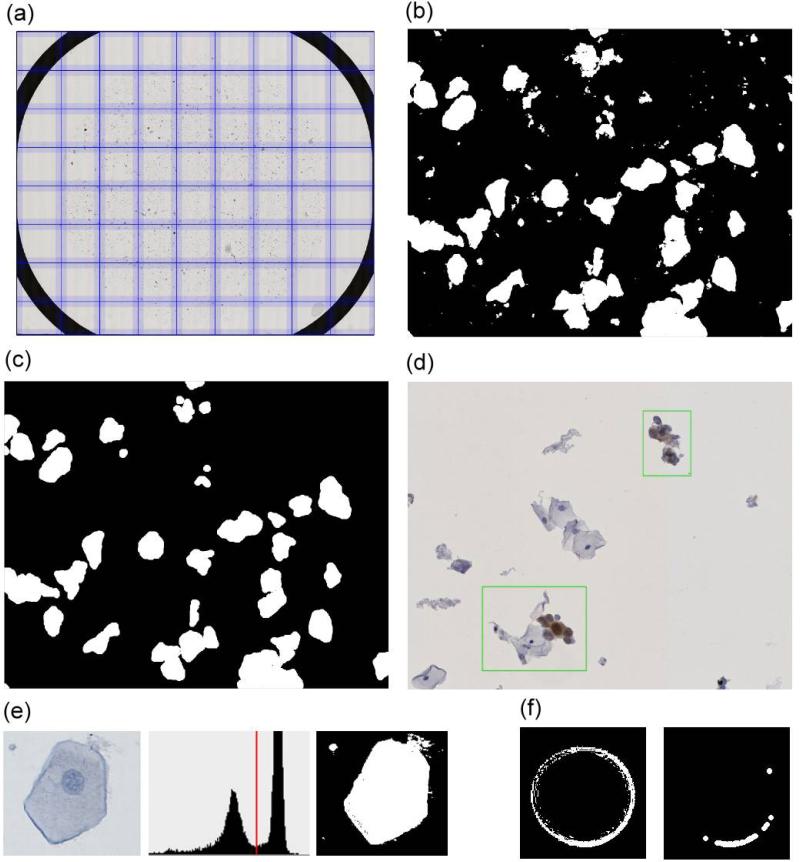
Images were scanned in a rectangular area circumscribing the ring that confines the cell area on Thinprep slides (Fig. 2a). Object detection was based on grey scale images of each subimage (Fig 2b). For every slide cells and cell clusters were separated from the background using the Otsu-method (Fig. 2e). After removal of very small objects by the image processing operation ‘opening’ (kernel: disk with 5μm diameter) for both operations, a clear image of cells and cell clusters was generated (Fig. 2c). This process also removed artifacts caused by air inclusions under the cover slip (Fig. 2f).
Figure 2. Illustration of object detection.
(a) Virtual slides of 65,000 x 50,000 pixels size are tiled into 2000 x 2000 pixel sized subimages for image processing, (b) object detection yields potential cell clusters (white), (c) erosion and dilation removes small objects, (d) detected cell clusters are annotated as a green frame in the original and non-tiled virtual slide, (e) object detection by Otsu method which separates background and object via a threshold in the intensity histogram, (f) small air bubbles are removed by erosion and dilation and a minimal cell size filter.
Analysis of the HSV color space
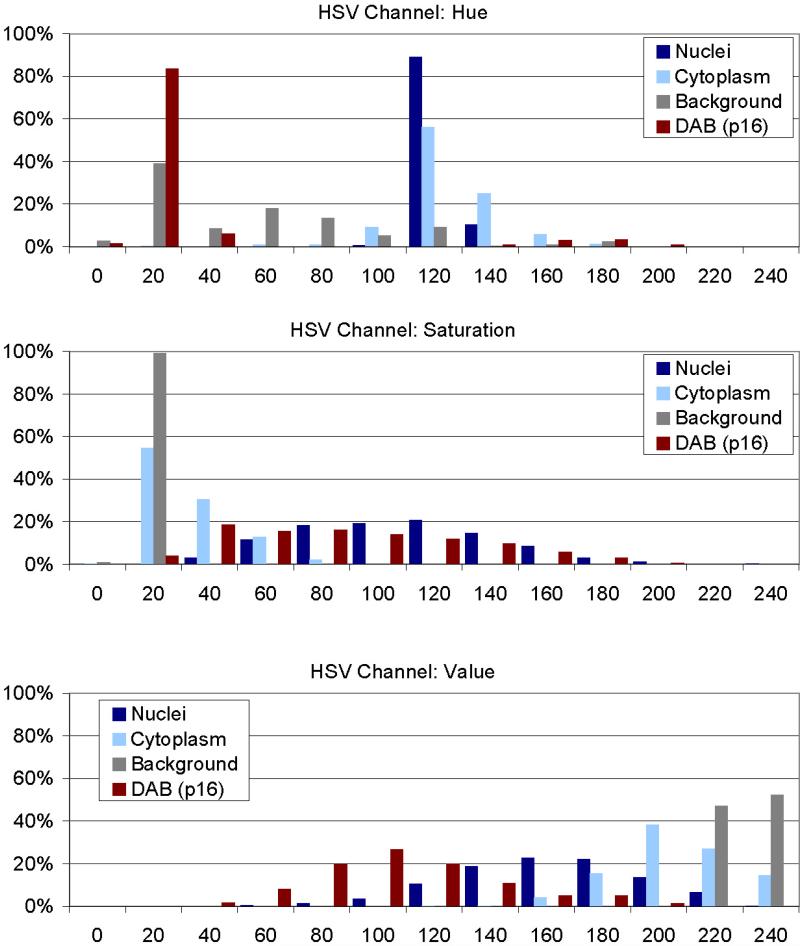
Prior to development of the algorithms we collected a pixel training data set encompassing 340 images of nuclei, cytoplasm, background, and p16 stained cells (85 images each from 10 different slides). From each image we randomly select 10 pixels, yielding a training data set of 3400 pixels. On this training data set we performed an analysis of the individual objects in their respective HSV channels Hue, Saturation and Value (Fig. 3). For nuclei we identified a narrow range in the Hue Channel (100-160; mean 112±6) with broader ranges for saturation (60-180; mean 99±35) and value (10-220; mean 153±35) where ± indicates the standard deviation of the normal distribution. For cytoplasm we identified the same hue range, but different saturation (0-40) and value components (160-240). Images of p16 positive cells were characterized by a low (5-35) or high hue range (135-255), broad saturation (10-180) and value (20-145). Slide background was characterized by a low saturation (0-40) and high value (220-255). The distinct ranges of these values motivated the development of HSV channel specific image classifiers.
Figure 3. Analysis of objects in HSV color space.
340 images of nuclei, cytoplasm, background, and p16 stained cells (85 images each) have been analyzed for their composition in the HSV color model after conversion from the original Red-Green-Blue (RGB) images. From each image 10 pixel have been collected, yielding a training data set of 3400 pixels from which the classifiers for nuclei, cytoplasm, and p16 stain were developed. In each channel (Hue, Saturation, Value) distinct distributions can be identified allowing discriminating of the image sets.
Classification of Nuclei and Cytoplasm
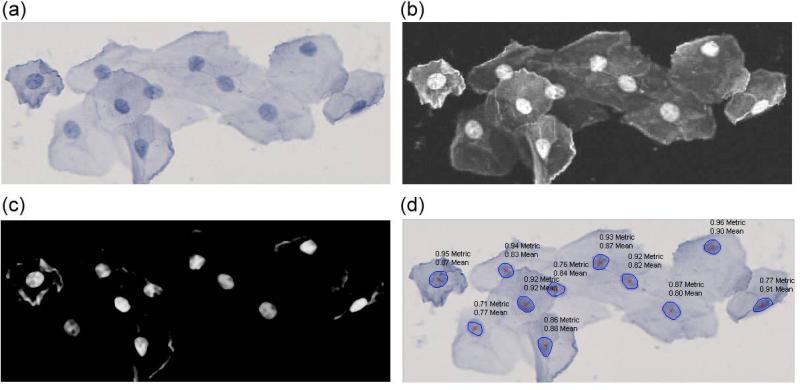
We developed classifiers for nuclei and cytoplasm by assigning a probability to each pixel corresponding to the normal distribution around the mean of the respective HSV channel. We evaluated the discriminatory performance of the HSV color model and measured a sensitivity of 93% for nuclei detection with 97% specificity and 97% sensitivity for cytoplasm detection with 93% specificity when only measuring pixels without taking cellular morphology into account. We improved specificity by determining size and roundness of potential nuclei (Fig 4d). Roundness was computed using the metric = 4*pi*area/perimeter^2. This metric equals one for a perfect circle and less than one for any other shape. Fig. 4 illustrates the nuclei detection on a representative image. In a representative image of the cell cluster (Fig. 4a) the probability (white) of a pixel belonging to a nucleus is calculated from the HSV color space parameters of this pixel (Fig. 4b). This probability is then further refined by subtracting the according probability of this pixel belonging to the cytoplasm (Fig. 4c).
Figure 4. Segmentation and measurement of individual nuclei.
(a) Original image of a cell cluster, (b) the probability (white) of a pixel belonging to a nucleus is calculated based on the HSV color space, (c) subtracting a pixel intensity corresponding to the probability of a pixel to belong to the cytoplasm (after being mapped to the scale of 0-255) highlights the individual nuclei, (d) mean nucleus probability (‘mean’) and application of roundness-metric (‘metric’) result in probability scores in the range of 0 to 1 for each nucleus of a cell cluster.
Biomarker detection
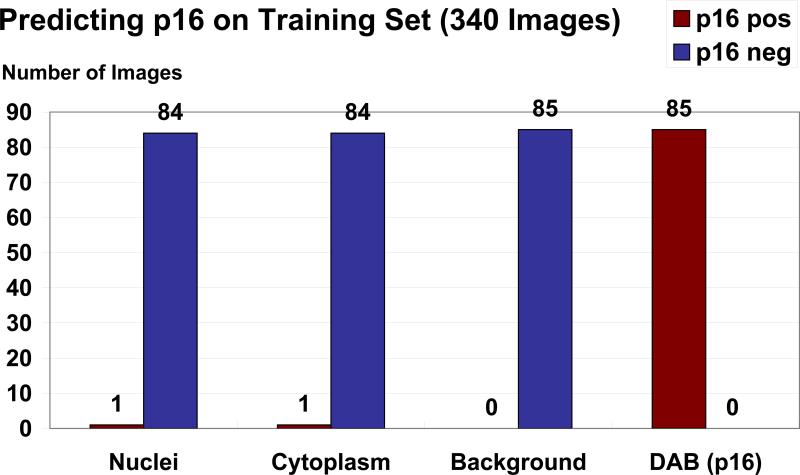
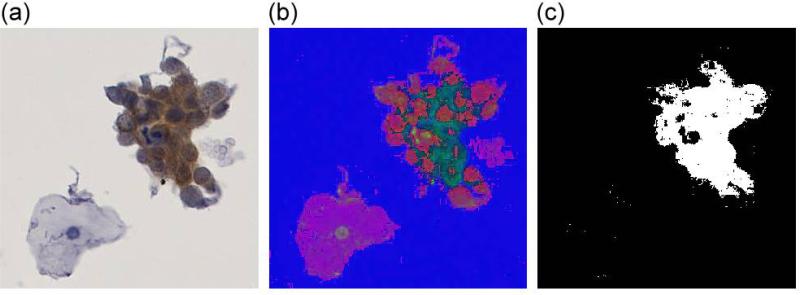
Based on the specific HSV channel values identified for p16 stained cells, a binary classifier was used to detect pixels indicative of p16INK4a staining. In the training set encompassing 340 images of nuclei, cytoplasm, background and DAB stained cells, we achieved an almost optimal discrimination of p16 positive and negative objects based on HSV values (Fig. 5). Since debris, dust, substrate precipitates, and air bubbles may have similar HSV values as DAB two additional criteria to ensure specific recognition of p16 stained cells were used. First, artifacts like air bubbles and small dust particles were removed using the image processing operation ‘opening’. The opening process is done by two successive linear structuring elements (in x-, then in y-direction) which open thin connected areas of the artifacts while compact areas of stained cells keep their shape. In addition, a minimal size of 300 pixels was required to identify p16INK4a stained cells. The process is illustrated in Fig. 6. The original image shown in Fig. 6a is transformed into HSV color space (Fig. 6b). The binary classifier highlights the identified brown fractions of the cell cluster (Fig. 6c).
Figure 5. Training data set.
Classification of all images from the training data set for p16 positive objects when applying the ranges resulting from the HSV color space analysis. All 85 training images containing p16 stained cells were recognized. One of 85 nuclei images and one of 85 cytoplasm images but no background images were rated positive.
Figure 6. Separation of p16 stained cells by HSV color space transformation.
(a) Original image of a p16 stained cell cluster, (b) visualization of the same cluster in HSV color space (here displayed by interpreting the HSV values as RGB values), (c), applying a threshold in the HSV color space displays p16 stained components of the cluster.
Comparison between automated and manual detection of p16 stained cells
We evaluated the capability of our system to detect p16 stained cells by directly comparing automatic and manual evaluation on the same slides (Table 1). We studied two complete slides as well as 52 tiles from 52 different slides from five different staining batches. The tiles covered an area of 3 x 3 mm size carrying each 84-1400 objects with nuclei (cells, clusters, or nuclei) to account for the heterogeneity of cytology slides (25.619 objects in total, 56.469 nuclei in total). The first complete slide was scanned in 3 focus layers and encompassed 11.628 objects with 24.742 nuclei. The uncompressed image size was 31 GB (compressed 567 MB). The second slide was scanned in a single focus layer, displayed 4093 objects with 8428 nuclei and had an uncompressed image size of 9 GB (compressed 164 MB). With 56.469 nuclei from five different batches the total the amount of slide data of our study reflects a broad spectrum of cytological events. After a first manual and second automatic evaluation pass of the slides or slide tiles, divergent annotations were manually reassessed. Cells rated positive after the third pass were included in the positive reference set (Gold+) while negatively rated objects and artifacts were assigned to the negative reference set (Gold-). Overall, the agreement of manual and automated evaluations with the gold standard was always above 99%, mainly related to the high number of unstained cells present on the slides. The positive agreement of the automatic algorithm with the gold standard was sufficient on full slides (75.6% and 83.4%) although slightly lower on slide tiles (70.9%). The manual evaluation showed a higher positive agreement (84.9% to 98.2%). McNemar's test indicated a partially higher detection of biomarker-stained cells in the automated evaluation, but the overall number of false positive cells was low. The sensitivity of the algorithm to detect biomarker-stained cells was very high (89.1% to 100%) on the full slides and even higher than the manual evaluation (84.4% to 98.2%) with specificity above 98.9% for both, manual and automatic analysis.
Discussion
Efficiency, reproducibility, and objectivity of slide evaluation have been important issues in cytology and are a matter of ongoing debates [12, 13]. We have developed a system to automatically scan, store, and evaluate cervical cytology slides. Our system generates high quality virtual cytology slides that can be evaluated and annotated through a standard web browser from remote locations. We have conducted a quantitative study of p16 stained cytology slides and demonstrated an excellent performance to detect p16-stained cells. In our system, after conversion into the HSV color space, cellular events can be reliably differentiated by their individual color channel distributions. In addition to a purely color-based assessment we have developed algorithms further integrating cell size and nuclear roundness. Our system allows quantifying objects like single cells, clusters, cell sheets, individual nuclei, and stained cells. The nuclear count provides information on the overall cell count on a slide and may be used for quality control purposes and to analyze biomarkers normalized to cell count. The color-based detection of stained cells allows detecting rare biomarker-stained cells on a slide. The system is currently optimized for the detection of DAB stained cells and may be used for other DAB-based biomarker stains beyond p16. Detected cells are stored in the flexible NDP.serve relational database system. Categorized or free-text annotations can be added to each slide; the display of those annotations can be controlled in user-dependent manner. For example, multiple observers can annotate the same image blinded or unblinded to each other or the automated annotations.
Concerning usability, two necessary prerequisites for using digital systems as a replacement for conventional cytology are excellent image quality and microscope-like handling. By using three Time-Delay Integration (TDI) CCD sensors (one for each RGB color channel) and line-scanning, the Hamamatsu Photonics NDP System provides an image quality equal to the optical use of a conventional microscopy system. The digitized slide (virtual slide) can be seamlessly moved horizontally or vertically or rotated, as one is used to with a microscope. When viewing the virtual slide only those image areas are transferred through the internet which are viewed by the user, so that highly efficient real-time browsing through the slide is possible also at relatively small bandwidths (e.g. ADSL). Switching magnifications can be done either by switching a virtual lens, or by zooming in and out seamlessly using the mouse-wheel. Digital images of cytological specimens are frequently criticized by the lack of three-dimensional structures. In contrast to histology, where slides are cut at a specific thickness, cytology specimens display intact cells that may have greater depth than structures on histology slides. We have added the capability of using a z-layer in the CyTIGA system by scanning the slide at several focus levels which allows scrolling through the three-dimensional features of cells present on a slide.
We have used our CyTIGA system to evaluate p16 stained cells. We could demonstrate a very high specificity of the p16-detection algorithm which is important as the slides contain tens of thousands of objects that need to be reliably rated. At the same time we achieved a high sensitivity to detect p16-stained cells. A meticulous multi-pass manual evaluation of DAB stained slides is hard to beat by automatic algorithms. Nevertheless, we achieved very high positive agreement, kappa values and sensitivity on the cellular level with the computational algorithm. This is remarkable, since color-based biomarker detection is frequently hampered by dust, debris, or air bubbles present on a slide. Overlapping cells and nuclei are frequently found in conventional Pap smears, but less common in liquid based thin layer cytology. In our comparison of manual and automated cell detection, we did not miss any stained cells because of overlap with other cells. The automated evaluation detects overlapping stained cells and presents them to the observer; however, further morphological assessment may be limited. The achieved high agreement between manual and automated results needs to be confirmed in larger studies which will generate more detailed results regarding the agreement of automatic and manual cytological slide evaluation and will provide reliable performance estimates against a real disease gold standard.
Two automated Pap cytology systems have been developed that are currently used mainly in large cytology laboratories: The FocalPoint system (BD) is an automated screening system using a proprietary video microscope, image analysis software and morphology algorithms to pre-screen cytological specimens from a normal screening population to identify 25% of slides that do not require further review [5]. As such, the system mainly aims at reducing the work-load of screening a high number of normal specimens. It does not flag slides that are likely derived from precancer, and it is not intended to be used in a population with a high prevalence of disease (e.g. a referral population). The Thinprep Imaging system (Hologic) uses a different approach by screening all slides and displaying the 22 most abnormal regions on a slide to a cytotechnologist [1]. The slide can then be called normal or needs to be reviewed further if abnormal cells are identified by the cytotechnologist. Both systems do not generate a virtual slide and are technically based on physical glass-slides. Another prototypic system to detect biomarker-stained cells based on glass slides has been described recently [18]. 50 events of the slide are selected by scanning a glass slide in low magnification with a CCD camera mounted on a AxioPlan2 imaging microscope (Carl Zeiss, Germany). These events are then re-visited in high magnification. For the positive events a discriminant function (DF) is calculated positively weighing optical density and negatively weighing stained area. Images with DF exceeding a threshold are included in an image gallery then presented to the cytologist. From the image processing point of view our approach differs as we show how a decomposition of the images in the HSV color model can be used to reliably identify p16 stained cells. Also, at this stage, we have not implemented a quantitative score of the identified cells but present all stained cells to the cytologist. Hence, our system offers an automated preprocessing which identifies p16 positive events that can be evaluated by expert cytologists. Clearly, our approach is also suitable for the inclusion of additional biomarkers like mitose-associated Ki-67 antigen which can be easily integrated into the detection system thereby enhancing the specificity of slides derived from women with cervical precancer and cancer.
Principally, conventional microscopic approaches do not achieve a complete digitalization of the slide like virtual microscopy does and thus require the in detail re-analysis of the physical glass slide after a pre-screening. The advantage of running image evaluation algorithms on whole slide scans is that a complete image of the slide is recorded. This virtual slide is then available for complex image analysis operations which can take into account all objects on the full slide simultaneously. In contrast, in microscopic solutions that are based on object detection in a pre-scan and that capture images only if an object is detected, the image evaluation algorithms are naturally limited to objects detected in the first pass. Using conventional microscopic systems for full image slide scanning would result in manifold technical problems that have already been overcome by virtual microscopy.
Until now, virtual microscopy has been applied in cytology in selected cases for e-learning [7]. With our system slides are made immediately available via the internet to the cytologist, independent of his or her geographic location. The cytologist can remotely evaluate complete slides. Moreover, the full area of slides can be automatically evaluated, annotated, be re-evaluated with different settings, and finally be permanently archived. Especially for archiving, virtual microscopy offers important advantages, as the slide is digitally conserved in its optimal state of quality directly after production and also exactly at the point of time when the diagnostic decision was made. Thus, the highly important issue of degrading of slide quality (e.g. emerging air bubbles, stain degradation, physical loss) is optimally solved by permanent digital archiving.
In summary, we have developed an integrated virtual cytology solution that scans glass slides, stores the resulting virtual slides and objectively and automatically evaluates cytological slides for DAB stained objects. The evaluations are presented to the user for final diagnostic decisions. We are now moving forward to use the platform in a large series of p16 stained cytology specimens obtained in primary cervical cancer screening and triage studies. The automated detection of p16 stained cells will be rigorously compared to manual evaluation in a larger series. Future developments may include more complex algorithms to evaluate cell morphology that allow an extensive quantitative and qualitative evaluation of p16 stained cells.
References
- 1.Bolger N, Heffron C, Regan I, Sweeney M, Kinsella S, McKeown M, Creighton G, Russell J, O'Leary J. Implementation and evaluation of a new automated interactive image analysis system. Acta Cytol. 2006;50(5):483–91. doi: 10.1159/000326001. [DOI] [PubMed] [Google Scholar]
- 2.Bulkmans NW, Berkhof J, Rozendaal L, van Kemenade FJ, Boeke AJ, Bulk S, Voorhorst FJ, Verheijen RH, van Groningen K, Boon ME, Ruitinga W, van Ballegooijen M, Snijders PJ, Meijer CJ. Human papillomavirus DNA testing for the detection of cervical intraepithelial neoplasia grade 3 and cancer: 5-year follow-up of a randomised controlled implementation trial. Lancet. 2007;370(9601):1764–72. doi: 10.1016/S0140-6736(07)61450-0. [DOI] [PubMed] [Google Scholar]
- 3.Carozzi F, Confortini M, Dalla Palma P, Del Mistro A, Gillio-Tos A, De Marco L, Giorgi-Rossi P, Pontenani G, Rosso S, Sani C, Sintoni C, Segnan N, Zorzi M, Cuzick J, Rizzolo R, Ronco G. Use of p16-INK4A overexpression to increase the specificity of human papillomavirus testing: a nested substudy of the NTCC randomised controlled trial. Lancet Oncol. 2008;9(10):937–45. doi: 10.1016/S1470-2045(08)70208-0. [DOI] [PubMed] [Google Scholar]
- 4.Cuschieri K, Wentzensen N. Human papillomavirus mRNA and p16 detection as biomarkers for the improved diagnosis of cervical neoplasia. Cancer Epidemiol Biomarkers Prev. 2008;17(10):2536–45. doi: 10.1158/1055-9965.EPI-08-0306. [DOI] [PMC free article] [PubMed] [Google Scholar]
- 5.Eichhorn JH, Brauns TA, Gelfand JA, Crothers BA, Wilbur DC. A novel automated screening and interpretation process for cervical cytology using the internet transmission of low-resolution images: a feasibility study. Cancer. 2005;105(4):199–206. doi: 10.1002/cncr.21098. [DOI] [PubMed] [Google Scholar]
- 6.Franco EL, Cuzick J. Cervical cancer screening following prophylactic human papillomavirus vaccination. Vaccine. 2008;26(Suppl 1):A16–23. doi: 10.1016/j.vaccine.2007.11.069. [DOI] [PubMed] [Google Scholar]
- 7.Glatz K, Bubendorf L, Glatz D. [Cytology in the internet]. Pathologe. 2007;28(5):318–24. doi: 10.1007/s00292-007-0922-x. [DOI] [PubMed] [Google Scholar]
- 8.Gonzales RC, Eddins LS, Woods RE. Digital Image Processing Using MATLAB. Prentice Hall; 2004. [Google Scholar]
- 9.Grabe N. Virtual Microscopy in Systems Pathology. Der Pathologe. 2008;S2:259. doi: 10.1007/s00292-008-1083-2. 2008. [DOI] [PubMed] [Google Scholar]
- 10.Klaes R, Benner A, Friedrich T, Ridder R, Herrington S, Jenkins D, Kurman RJ, Schmidt D, Stoler M, von Knebel Doeberitz M. p16INK4a immunohistochemistry improves interobserver agreement in the diagnosis of cervical intraepithelial neoplasia. Am J Surg Pathol. 2002;26(11):1389–99. doi: 10.1097/00000478-200211000-00001. [DOI] [PubMed] [Google Scholar]
- 11.Mayrand MH, Duarte-Franco E, Rodrigues I, Walter SD, Hanley J, Ferenczy A, Ratnam S, Coutlee F, Franco EL. Human papillomavirus DNA versus Papanicolaou screening tests for cervical cancer. N Engl J Med. 2007;357(16):1579–88. doi: 10.1056/NEJMoa071430. [DOI] [PubMed] [Google Scholar]
- 12.McQueen F, Duvall E. Using a quality control approach to define an ‘adequately cellular’ liquid-based cervical cytology specimen. Cytopathology. 2006;17(4):168–74. doi: 10.1111/j.1365-2303.2006.00344.x. [DOI] [PubMed] [Google Scholar]
- 13.Mesker WE, Torrenga H, Sloos WC, Vrolijk H, Tollenaar RA, de Bruin PC, van Diest PJ, Tanke HJ. Supervised automated microscopy increases sensitivity and efficiency of detection of sentinel node micrometastases in patients with breast cancer. J Clin Pathol. 2004;57(9):960–4. doi: 10.1136/jcp.2004.017368. [DOI] [PMC free article] [PubMed] [Google Scholar]
- 14.Naucler P, Ryd W, Tornberg S, Strand A, Wadell G, Elfgren K, Radberg T, Strander B, Johansson B, Forslund O, Hansson BG, Rylander E, Dillner J. Human papillomavirus and Papanicolaou tests to screen for cervical cancer. N Engl J Med. 2007;357(16):1589–97. doi: 10.1056/NEJMoa073204. [DOI] [PubMed] [Google Scholar]
- 15.Schiffman M. Integration of human papillomavirus vaccination, cytology, and human papillomavirus testing. Cancer. 2007;111(3):145–53. doi: 10.1002/cncr.22751. [DOI] [PubMed] [Google Scholar]
- 16.Scimia M. ThinPrep pap test: a platform for gynecological diagnosis. Adv Clin Path. 2001;5(4):183–4. [PubMed] [Google Scholar]
- 17.Tsoumpou I, Arbyn M, Kyrgiou M, Wentzensen N, Koliopoulos G, Martin-Hirsch P, Malamou-Mitsi V, Paraskevaidis E. p16(INK4a) immunostaining in cytological and histological specimens from the uterine cervix: A systematic review and meta-analysis. Cancer Treat Rev. 2009 doi: 10.1016/j.ctrv.2008.10.005. [DOI] [PMC free article] [PubMed] [Google Scholar]
- 18.van der Laak JA, Siebers AG, Aalders SA, Grefte JM, de Wilde PC, Bulten J. Objective assessment of cancer biomarkers using semi-rare event detection. Cell Oncol. 2007;29(6):483–95. doi: 10.1155/2007/487435. [DOI] [PMC free article] [PubMed] [Google Scholar]
- 19.Wentzensen N, Bergeron C, Cas F, Eschenbach D, Vinokurova S, von Knebel Doeberitz M. Evaluation of a nuclear score for p16INK4a-stained cervical squamous cells in liquid-based cytology samples. Cancer. 2005;105(6):461–7. doi: 10.1002/cncr.21378. [DOI] [PubMed] [Google Scholar]
- 20.Wentzensen N, Bergeron C, Cas F, Vinokurova S, von Knebel Doeberitz M. Triage of women with ASCUS and LSIL cytology: use of qualitative assessment of p16INK4a positive cells to identify patients with high-grade cervical intraepithelial neoplasia. Cancer. 2007;111(1):58–66. doi: 10.1002/cncr.22420. [DOI] [PubMed] [Google Scholar]
- 21.Wentzensen N, von Knebel Doeberitz M. Biomarkers in cervical cancer screening. Dis Markers. 2007;23(4):315–30. doi: 10.1155/2007/678793. [DOI] [PMC free article] [PubMed] [Google Scholar]
- 22.Wright TC, Jr., Schiffman M, Solomon D, Cox JT, Garcia F, Goldie S, Hatch K, Noller KL, Roach N, Runowicz C, Saslow D. Interim guidance for the use of human papillomavirus DNA testing as an adjunct to cervical cytology for screening. Obstet Gynecol. 2004;103(2):304–9. doi: 10.1097/01.AOG.0000109426.82624.f8. [DOI] [PubMed] [Google Scholar]
- 23.zur Hausen H. Papillomaviruses and cancer: from basic studies to clinical application. Nat Rev Cancer. 2002;2(5):342–50. doi: 10.1038/nrc798. [DOI] [PubMed] [Google Scholar]


