

Abstract
Prenatal alcohol exposure is known to have severe, long-term consequences for brain and behavioral development already detectable in infancy and childhood. Resulting features of fetal alcohol spectrum disorders (FASD) include cognitive and behavioral effects, as well as facial anomalies and growth deficits. Diffusion tensor imaging (DTI) and tractography were used to analyze white matter development in 11 newborns (age since conception <45 weeks) whose mothers were recruited during pregnancy. Comparisons were made with 9 age-matched controls born to abstainers or light drinkers from the same Cape Coloured (mixed ancestry) community near Cape Town, South Africa. DTI parameters, T1 relaxation time, proton density and volumes were used to quantify and investigate group differences in white matter (WM) in the newborn brains. Probabilistic tractography was used to estimate and to delineate similar tract locations among the subjects for transcallosal pathways, cortico-spinal projection fibers and cortico-cortical association fibers. In each of these WM networks, the axial diffusivity AD was the parameter that showed the strongest association with maternal drinking. The strongest relations were observed in medial and inferior WM, regions in which the myelination process typically begins. In contrast to studies of older individuals with prenatal alcohol exposure, FA did not exhibit a consistent and significant relation with alcohol exposure. To our knowledge, this is the first DTI-tractography study of prenatally alcohol exposed newborns.
Keywords: DTI, tractography, prenatal alcohol exposure, newborns, white matter
1. INTRODUCTION
Studies spanning more than four decades have documented adverse effects of prenatal alcohol exposure (PAE) on brain development and cognitive function, which are encompassed collectively under the term fetal alcohol spectrum disorders (FASD). These effects were observed initially in the most severely affected children, who presented with a distinct pattern of craniofacial changes, growth deficits including microcephaly, and cognitive and behavioral impairment (Lemoine et al., 1968; Jones and Smith, 1973). Effects were subsequently also seen in alcohol exposed individuals who lack the facial features but nonetheless exhibit neurocognitive and behavioral deficits (e.g., Streissguth et al., 1994; Mattson et al., 2011; Jacobson et al., 2004). More recently, structural (e.g., Archibald et al., 2001; Chen et al., 2012) and functional MRI (e.g., Fryer et al., 2007; Meintjes et al., 2010; Diwadkar et al., 2013) have been used to examine underlying neural impairment in prenatally exposed children and adults.
A growing body of evidence suggests that white matter (WM) may be a specific target of alcohol teratogenesis. Archibald et al. (2001) found a disproportionate reduction in cerebral WM in children with full fetal alcohol syndrome (FAS), the most severe of the FASD, suggesting an effect on myelination that has also been observed in ethanol-exposed animals (Bichenkov and Ellingson, 2001; Zoeller et al., 1994). WM lesions have also been observed in preterm infants with heavy prenatal alcohol exposure (PAE) (Holzman et al., 1995) and in fetal alcohol exposed sheep (Watari et al., 2006). Studies with fetal alcohol exposed rodents have reported decreases in axon size, increased packing density and thinner myelin sheaths (Miller & Al-Rabiai, 1994), as well as abnormalities in the oligodendrocytes that produce the myelin sheath (Chiappelli et al., 1991; Guerri et al., 2001).
Effects on WM integrity have been examined in children (aged 5 years and older) and in adults using diffusion tensor imaging (DTI) (Sowell et al., 2008; Spottiswoode et al., 2011) and DTI-based tractography (Ma et al., 2005; Wozniak et al., 2006; Lebel et al., 2008a; Guerri et al., 2009; Wozniak et al., 2009; Wozniak & Muetzel, 2011). Most of the previous DTI studies have focused on the corpus callosum due to its relative ease of definition and known association of structural changes in this region with cognitive outcomes (Bookstein et al., 2002). One group has used a semi-automated deterministic tractographic method to delineate and examine effects of prenatal alcohol exposure on 11 major WM tracts across the brain (Lebel et al., 2008a). DTI measures and tractography have previously been used to examine WM structural integrity in healthy newborns at approximately 13 weeks of age (Dubois et al., 2006) but, to our knowledge, no previous DTI-tractography studies have been performed on infants with prenatal alcohol exposure.
DTI parameters, derived from the six independent tensor values, provide quantitative measures related to WM structure, integrity and environment (Basser and Pierpaoli, 1996; Hüppi and Dubois, 2006). The tensor’s three eigenvalues (L1, L2 and L3) quantify local diffusion in mutually orthogonal orientations in space. L1 is often called parallel or axial diffusivity (AD), representing the diffusivity along the axonal structure, while the average perpendicular diffusion is called radial diffusivity, RD = (L2+L3)/2. Mean diffusivity (MD) is the average of the three eigenvalues. Fractional anisotropy (FA) is their normalized standard deviation, representing the difference in magnitude of diffusion along the various eigenvectors; a higher FA is generally associated with the presence of more highly organized WM structure.
Tractography provides an important tool for estimating the locations of WM tracts and pathways for each individual, which is particularly important in studies of populations with potentially heterogeneous structural development, as well as those lacking a standard atlas. Probabilistic tractography was implemented, which, in contrast to deterministic tractography, includes information regarding noise and uncertainty of diffusion tensors during tract propagation. Because it incorporates likelihood and confidence estimates in the final WM estimates, probabilistic tractography is less susceptible to producing both false negatives and positives.
Research with animal models has demonstrated that myelin structure impedes perpendicular diffusivity, while some forms of injury to the axon itself impede axial diffusivity by reducing the continuity of the axonal cylinders and myelin sheaths. Although increased FA and AD and decreased RD are often considered indicators of myelin integrity (Beaulieu, 2002; Song et al., 2002), this distinction is not always clear. For example, Werring et al. (2000) showed that axonal degeneration can lead to increases in water diffusion in both the parallel and perpendicular directions, and Beaulieu (2002) has demonstrated significant anisotropy in non-myelinated nerves.
In this study, WM development was examined in a sample of newborn infants whose mothers were recruited during pregnancy. The infants were born either to women who drank very heavily during pregnancy or to controls who abstained or drank no more than minimally. All participants were recruited from the Cape Coloured (mixed ancestry) population in Cape Town, South Africa, among whom the incidence of heavy drinking during pregnancy and FASD is among the highest in the world (May et al., 2007). This population, which consists mainly of descendants of white European settlers, Malaysian slaves, Khoi-San aboriginals, and black Africans, has historically comprised the large majority of workers in the wine-producing region of the Western Cape, South Africa. Heavy alcohol use during pregnancy has persisted in both the urban and rural Cape Coloured communities, leading to the very high prevalence of FASD (Croxford and Viljoen, 1999; Jacobson et al., 2006; Jacobson et al., 2008).
We used DTI-based probabilistic tractography to identify localized regions of WM fiber bundles within three major WM classes: transcallosal tracts (corpus callosum, commissural left-right hemispheric connections and corona radiata), left and right projection fibers (connections between the cortex and the spinal cord, brainstem and thalamus), and left and right association fibers (mainly cortex-cortex connections). This methodology was used to identify tracts that were common to all infant brains. Local WM properties were quantified using DTI parameters and anatomical tissue parameters (T1 relaxation time, proton density (PD), and normalized volumes (NV)) that measure additional WM properties related to structure, water and chemical content (Welker and Patton, 2012). We then examined the relation of prenatal alcohol exposure to these measures of white matter structure, first on a network level for the major WM classes and then at regional locations within each network.
2. MATERIALS AND METHODS
2.1 Subjects
The sample consisted of 20 newborns: 11 prenatally alcohol exposed (PAE; 6 female; age range, 36–44 wk postconception; median, 42 wk) and 9 healthy controls (HC; 3 female; age range, 38–44 wk postconception; median, 42 wk). The MR scan for all but one of four infants born prior to 37 weeks gestational age (GA) was conducted after the infants had reached age 38 weeks postconception. The infants were born to women who were recruited from two antenatal clinics that serve an economically disadvantaged Cape Coloured community. Each mother was interviewed antenatally regarding her alcohol consumption using a 2-wk timeline follow-back interview (Jacobson et al., 2002; Jacobson et al., 2008). Volume was recorded for each type of beverage consumed each day and converted to oz absolute alcohol (AA). Two groups of women were recruited: (1) heavy drinkers, who consumed 14.0 or more standard drinks/week (≈1.0 oz absolute alcohol (AA)/day) and/or engaged in binge drinking (4 or more drinks/occasion); and (2) controls, who abstained or drank no more than minimally during pregnancy. Excluded were women <18 years of age and those with diabetes, epilepsy, or cardiac problems requiring treatment.
Timeline follow-back interviews were re-administered to recruited mothers at 4 and 12 wk after recruitment. Data from the three alcohol interviews were averaged to provide three continuous measures of drinking during pregnancy: average oz AA/day, AA/drinking occasion and frequency of drinking (days/wk). Prenatal alcohol exposure was represented by frequency of maternal drinking during pregnancy in the statistical analyses performed in this study. Smoking was measured as average cigarettes smoked per day during pregnancy.
Infant exclusionary criteria were major chromosomal anomalies, neural tube defects, multiple births, very low birthweight (< 1500 g), gestational age <32 wks and seizures. For the purposes of this DTI study we also excluded infants whose mothers reported using illicit drugs, such as crystal methamphetamine (“tik”) or cocaine, but not marijuana. Marijuana was used (in small quantities) by mothers of one PAE and two HC infants. During subsequent postnatal interviews, two PAE mothers reported using small amounts of methamphetamine during pregnancy, but the findings were not altered by their inclusion or exclusion from the analyses.
Human subjects approval was obtained from the Wayne State University and University of Cape Town institutional review boards. Informed consent was obtained both at time of recruitment and at time of scan. All women who reported drinking during pregnancy were advised to stop or reduce their intake and were offered referrals for treatment.
2.2 Scanning
Infants were not sedated during the MRI scans. A standard procedure developed by PW and S. Warfield (Boston Children’s Hospital, Boston, MA) was followed by a developmental pediatrician (CM), including physical and neonatal behavioral examinations, feeding and swaddling, which ensured that the infant was sleeping when placed in the scanner. Excessive movements during imaging were minimized by wrapping the newborns in an MRI-compatible vacuum cushion. Scanning was performed on a 3T Allegra (Siemens, Erlangen, Germany) using a custom-built, 170.9 mm (inner diameter) circularly polarized birdcage radiofrequency (RF) coil designed and constructed by L. Wald (Martinos Center for Brain Imaging, Massachusetts General Hospital, Boston, MA). Two diffusion weighted imaging (DWI) sets were acquired with opposite phase encoding directions (AP/PA) with a twice-refocused spin echo - echo planar imaging (SE-EPI) sequence. For the first 7 infants (3 PAE, 4 HC) the imaging parameters were: TR/TE 9500/86 ms; 50 slices; 80×80 planar voxels; 2×2×2 mm3. For the remaining infants (7 PAE, 6 HC), a volumetric navigated DTI sequence (vNav-DTI) was used (Alhamud et al. 2012), which performs real-time motion detection and correction, using the same imaging parameters except: TR=10026 ms. In order to assess whether changing the sequence may introduce a bias in the results, three adults were scanned with both sequences and processed using the same procedures (see below). In all cases, similar means and standard deviations, with no consistently higher value in either acquisition, were observed in DTI and tracking parameters. An intraclass correlation coefficient was calculated across the group for each parameter, resulting in uniformly high values: 0.91 for FA, 0.88 for MD, 0.92 for AD, 0.86 for RD and 0.94 for NV. For all infants, AP and PA acquisitions each contained 30 DW gradient directions with b=1000 s mm−2 and four b=0 s mm−2 reference scans (total acquisition times 5.4 and 5.7 mins, respectively). Scans acquired using the two sequences were processed identically (see description of motion correction, outlier rejection, etc. below) and were then tested for statistical differences in DTI parameters, with no significant differences found. Similar numbers of DWI images remained after eliminating motion-affected volumes with dropout signal, and including sequence as a regressor in analyses described below resulted in no significant changes to results.
Anatomical imaging was performed using a multiecho FLASH sequence (van der Kouwe et al., 2008). Two anatomical acquisitions were performed with flip angles of 5 and 20 degrees, respectively. Each data set contained eight echoes with echo times TE=1.46, 3.14, 4.82, 6.5, 8.18, 9.86, 11.54 and 13.22 ms, TR=20 ms. The procedure to reconstruct T1 and PD maps from these sets is described in Sec. 2.3. The image matrix contained 128×144×144 voxels with 1 mm isotropic resolution.
2.3 Data processing and parameter quantification
The DWI data were visually inspected for motion and dropout slices, with individual volumes discarded (>16 DWIs remained in all cases). Sets were motion corrected using FSL (Smith et al., 2004) and susceptibility-distortion corrected using a Matlab (Mathworks, Natick, MA) script (Andersson et al., 2003; Rohde et al., 2004). Outlier rejection was performed by converting DWIs to Z-scores based on 25- and 75-percentile limits and discarding points outside mean±3 standard deviations (SDs). Diffusion tensors (DTs) were estimated with nonlinear fits in AFNI (Cox, 1996).
Optimized anatomical images were generated from the FLASH sequence images using FreeSurfer (http://surfer.nmr.mgh.harvard.edu/) software. The mri_ms_fitparms command was used to estimate physical T1 and PD images from the multiecho volumes (Fischl et al., 2004; Deoni et al., 2005).
2.4 Region selection and tractographic analyses
The three major WM classes were investigated in five network groupings: one transcallosal, including the corpus callosum and corona radiata (CCCR); left and right hemispheric projection fibers (L-PROJ and R-PROJ, respectively); and left and right hemispheric association fibers (L-ASSOC and R-ASSOC, respectively). These were defined by initially placing spherical target (approximately 10–14 mm diameter) regions of interest (ROIs) in a single HC brain (Fig. 1). We placed 12 paired ROIs along the extent of the CCCR; 8 ROIs in the L-PROJ fibers, having both inferior-superior (I-S) and anterior-posterior (A-P) coverage; 8 homotopically located ROIs in the R-PROJ fibers; 10 ROIs in the L-ASSOC fibers, having wide medial-lateral, I-S and A-P coverage; and 10 homotopically located ROIs in the R-ASSOC fibers. Placement of spheres was chosen based on criteria of having 1) wide coverage of WM across each network and 2) targets with connections likely present among all subjects. To accomplish this, a novel combination of deterministic tractography plus DT uncertainty measures was used to make an initial estimate of “likely” white matter bundle locations. This “mini-probabilistic” tractography approach is described briefly in Appendix A. Following this placement, the target ROIs were mapped across subjects (using affine transformations among b=0 images in AFNI), resulting in five networks of homologous sets of target ROIs in each individual. Visualization of fiber structures was implemented with TrackVis (Wang et al., 2007).
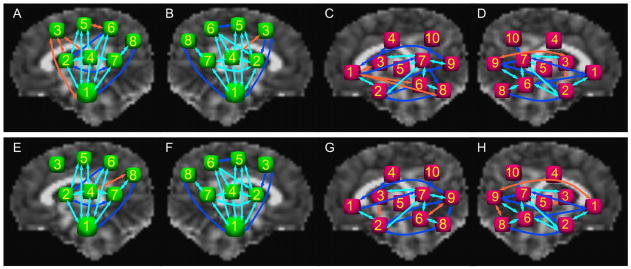
Fig. 1.

Initial locations of target ROIs, with example tractographic connections (top panels). A) Pairs of target ROIs for connections through the corpus callosum and corona radiata (CCCR). B) The top panel shows targets for R-projection fibers (R-PROJ), and the lower panel shows an axial view of both L- and R-PROJ. C) The top panel shows targets for R-association fibers (R-ASSOC), and the lower panel shows both L- and R-ASSOC. In all networks, mini-probabilistic tractography was required to find homologous target locations based on WM tracts (Sec. 2.4 and Appendix A for details). All sets of ROIs were mapped to each subject’s native diffusion weighted space for tractogaphy.
Probabilistic tractography was performed using the FATCAT software in AFNI (Taylor and Saad, 2013), which efficiently finds connections within ROI networks and provides quantitative measures for all identified WM regions. The local uncertainties in DT eigenvectors and FA were estimated using FATCAT, and M=5000 Monte Carlo iterations of whole brain, brute force tractography were then performed with the streamline FACTID algorithm (Taylor et al., 2012). At each iteration the algorithm finds locations of tracts connecting pairs of targets. Standard propagation parameters for this algorithm were used: 55 deg maximum angle of propagation confined to voxels with FA>0.1, which is the standard threshold using FA as a WM proxy in infants (see Dubois et al., 2006). We visually compared WM in segmented T1 maps with these FA>0.1 regions to verify application of the standard threshold in our data. The FA>0.1 region overlapped greatly with the T1 WM. The validity of this approach is further supported by high average FA values (>0.2) in the tractographically defined WM regions (see Table 3). By including all voxels through which a minimal number (defined as a fraction of Monte Carlo iterations, >0.01M) of tracts connecting a pair of targets passed, we created a set of WM-ROIs associated with each pair of targets.
TABLE 3.
Average network parameters.
| CCCR | L-PROJ | R-PROJ | L-ASSOC | R-ASSOC | ||||||
|---|---|---|---|---|---|---|---|---|---|---|
| HC | PAE | HC | PAE | HC | PAE | HC | PAE | HC | PAE | |
| FA | 0.23±0.02 | 0.23±0.01 | 0.21±0.01 | 0.21±0.01 | 0.21±0.01 | 0.21±0.01 | 0.20±0.01 | 0.20±0.01 | 0.19±0.01 | 0.20±0.01 |
| MD | 1.42±0.08 | 1.36±0.06 | 1.25±0.05 | 1.22±0.05 | 1.26±0.04 | 1.23±0.05 | 1.38±0.07 | 1.34±0.05 | 1.36±0.06 | 1.31±0.06† |
| AD | 1.77±0.09 | 1.70±0.06† | 1.53±0.06 | 1.49±0.05 | 1.54±0.04 | 1.50±0.05† | 1.67±0.06 | 1.62±0.05 | 1.64±0.06 | 1.58±0.06† |
| RD | 1.24±0.08 | 1.19±0.06 | 1.11±0.05 | 1.09±0.06 | 1.12±0.04 | 1.09±0.05 | 1.23±0.07 | 1.20±0.06 | 1.23±0.06 | 1.17±0.06† |
| T1 | 3.65±0.33 | 3.58±0.34 | 3.22±0.26 | 3.15±0.24 | 3.43±0.30 | 3.35±0.33 | 3.43±0.28 | 3.40±0.28 | 3.72±0.29 | 3.60±0.36 |
| PD | 7.13±1.31 | 7.90±0.92 | 7.20±1.38 | 7.90±0.84 | 7.38±1.40 | 8.07±0.93 | 7.19±1.42 | 7.93±0.91 | 7.37±1.31 | 8.08±0.97 |
HC = healthy control; PAE = prenatal alcohol exposure; values shown as mean±SD of subject network averages;
p<0.10.
The mean and standard deviation of the DTI parameters (FA, MD, AD and RD) for each WM-ROI are automatically calculated, as well as the volume. The volumes have been included in this study as normalized volumes (NV) by dividing by the subject’s whole brain volume (as defined in Sec. 2.5). Anatomical images were mapped to DW space (using affine transformations in AFNI), and the mean T1 and PD were calculated for each WM-ROI. Only those WM-ROIs found between the same targets in all subjects were selected for further analysis.
2.5 Statistical Analyses
The relation of prenatal alcohol exposure to total brain volume (intracranial measure from the DWI mask), WM volume (volume with FA>0.1) and WM fraction (WM volume divided by total volume) was examined using multiple regression analyses, which also included four other predictors: the infant’s postconception age at scan and sex, and the maternal age at delivery and smoking (mean number of cigarettes smoked per day) during pregnancy. For each of the five WM networks, the relation of prenatal alcohol and the other four predictors to each of the physical variables of interest (FA, MD, AD, RD, T1, PD and NV) was examined in a separate multivariate general linear model (Chen et al., 2014) in which the outcome was represented as a repeated measure across the WM-ROI tracts, using the package afex (Singmann, 2013) in R (R Core Team, 2013).
Where prenatal alcohol exposure was significantly related to an outcome of interest in a given network (p<0.05), the effect of alcohol on that outcome in each WM-ROI within that network was examined using multiple regression to adjust for the influence of the other four predictors. In addition, because older infant age was expected to be associated with higher FA during myelination stages, we performed multiple regressions relating age and the other four predictors to FA in each of the WM-ROIs. We note that T1 and NV did not show significant relations with any predictors at the network level and were excluded from further analysis; RD was highly correlated with both MD (r>0.97) and AD (r>0.92) but showed systematically lower significance relations than either, and therefore it was excluded from further analysis.
3. RESULTS
3.1 Sample Characteristics and whole-brain comparison
Sample characteristics are summarized in Table 1. There were no significant differences in birthweight, age at birth or postconception age at scan between the exposed and control newborns. As expected, head circumference was smaller in exposed newborns, although the difference fell just short of (p<0.05) significance in this small sample. There were somewhat fewer females than expected in the control group. Consistent with previous studies (May, 1991; J. Jacobson et al., 1996; S. Jacobson et al., 2004), mothers of alcohol exposed infants were older at delivery. As planned, groups differed in maternal alcohol consumption. All the mothers who met the 1 oz or more AA/day criterion engaged in heavy binge drinking, with doses ranging from 6.2–14.0 standard drinks per occasion (median=9.6) on two to three days per week. All but one of the control mothers abstained during pregnancy; this mother drank 2 drinks per occasion about twice per month. There was no significant difference between groups in the final number of DWIs that remained per subject after visual inspection and removal of volumes with motion artifacts or dropout slices.
TABLE 1.
Sample characteristics.
| HC (n = 9) | PAE (n = 11) | p-value | |||
|---|---|---|---|---|---|
| Mean/% | SD | Mean/% | SD | ||
| Infant characteristics | |||||
| Sex (% female) | 33.3 | 54.5 | 0.075† | ||
| Gestational age at birth (wk) | 38.7 | 1.9 | 38.6 | 2.0 | 0.939 |
| Postpartum age at scan (wk) | 3.0 | 1.6 | 2.6 | 1.5 | 0.589 |
| Postconception age at scan (wk) | 41.6 | 2.1 | 41.2 | 2.3 | 0.658 |
| Birthweight (g) | 2753.3 | 478.4 | 2754.1 | 413.5 | 0.997 |
| Head circumferencea (%ile for age) | 44.2 | 28.2 | 22.4 | 19.2 | 0.063† |
| Maternal characteristics | |||||
| Maternal age at delivery (yr) | 24.0 | 4.7 | 29.8 | 4.6 | 0.012 * |
| Parity | 1.2 | 1.2 | 2.3 | 1.5 | 0.105 |
| Educationb (yr) | 10.6 | 0.9 | 9.7 | 1.0 | 0.807 |
| Marital status (% married) | 33.3 | 18.2 | 0.176 | ||
| Smoking (cig/day) | 4.3 | 2.5 | 6.5 | 4.8 | 0.218 |
| Marijuana (days/wk) | 0.0 | 0.1 | 0.2 | 0.5 | 0.509 |
| Extent of alcohol consumption | |||||
| At conception | |||||
| oz AA/dayc | 0.02 | 0.05 | 2.25 | 1.89 | 0.002 ** |
| oz AA/occasionc | 0.13 | 0.38 | 4.70 | 3.51 | 0.001 ** |
| frequency (days/wk) | 0.02 | 0.05 | 0.42 | 0.30 | 0.001 *** |
| Across pregnancy | |||||
| oz AA/dayc | 0.01 | 0.03 | 1.68 | 1.52 | 0.004 ** |
| oz AA/occasionc | 0.13 | 0.40 | 4.66 | 1.35 | 0.000 *** |
| frequency (days/wk) | 0.01 | 0.03 | 0.33 | 0.26 | 0.001 ** |
| Infant global parameters | |||||
| Number of DWIsd | 21.7 | 4.4 | 22.4 | 3.6 | 0.698 |
| Total intracranial volume (cm3) | 469.4 | 60.8 | 434.6 | 43.5 | 0.152 |
| WM volume (cm3) | 200.7 | 23.0 | 182.9 | 25.6 | 0.123 |
| WM fraction | 0.43 | 0.04 | 0.42 | 0.03 | 0.535 |
HC = healthy control; PAE = prenatal alcohol exposure; SD = standard deviation; AA = absolute alcohol;
p<0.10;
p<0.05;
p<0.01;
p<0.001.
Measures from infant follow-up exam 6.5 months after scan; value missing for one PAE newborn.
Education missing for one HC mother.
Measures of oz AA for one PAE mother were winsorized.
Number of DWIs remaining after deletion of any dropout/motion-corrupted volumes
Table 2 shows the associations of total intracranial volume, WM volume, and WM fraction with alcohol exposure and the four other predictors considered here. After controlling for the potential confounding effects of other predictors, infant age (measured in weeks since conception) shows a significant relation to total volume and to WM volume, while more frequent prenatal alcohol exposure is associated with smaller intracranial volumes. No other significant association is observed between any predictor and WM fraction after controlling for confounders.
TABLE 2.
Associations of global brain properties with alcohol and four other predictors.
| Variable | alc | age | Predictors sex | cig | mat. age | |||||
|---|---|---|---|---|---|---|---|---|---|---|
| r | β | r | β | r | β | r | β | r | β | |
| Brain volume | −0.26 | −0.36* | 0.76*** | 0.77*** | −0.39 | −0.21 | −0.08 | −0.14 | −0.40 | −0.13 |
| WM volume | −0.30 | −0.21 | 0.65** | 0.54* | −0.35 | −0.24 | −0.07 | −0.03 | −0.51* | −0.23 |
| WM fraction | −0.14 | 0.12 | 0.03 | −0.15 | −0.04 | −0.09 | −0.04 | −0.11 | −0.30 | −0.52 |
For each predictor, r represents the simple correlation between each predictor and the outcome; β is the standardized regression coefficient after adjustment for all the other predictors;
p<0.05;
p<0.01;
p<0.001.
alc = frequency of maternal drinking; age = infant age since conception; sex: male=1, female=2; cig = maternal smoking (cig/day); mat. age
3.2 Whole brain examination
Example maps of the DTI and structural parameters are shown in Fig. 2 for one HC (left column) and one PAE (right column) infant. FA maps appear qualitatively similar. WM values of MD, AD and RD are typically higher for the HC newborn. For both subjects, T1 values in the WM are approximately 3s. PD measures (in arbitrary scaling from mri_ms_fitparms) have wide variation across WM. For each parameter, average WM network values are presented below in Sec. 3.3.
Fig. 2.

Examples of parameter maps and whole brain (mini-probabilistic) tractography for one HC (AG) and one PAE (H-N) infant (views by column: fronto-coronal, L-sagittal and supero-axial). Units of MD, AD and RD are 10−3 mm2 s−1; units of T1 are s; units of PD are arbitrary 103. Tractography coloration (G and N) is by local tract direction: left-right (red), anterior-posterior (green), inferior-superior (blue).
Whole brain tractography produced qualitatively similar results across all infants. Examples of estimated tract reconstructions (mini-probabilistic, see Appendix A) through all WM with FA>0.1 for one HC and one PAE newborn are shown in Fig. 2, panels G and N, respectively. Upon visual inspection, no major tractographic differences, such as missing regions or obvious major tract misdirection during propagation, were apparent between the groups.
3.3 Tractographic connections
Using probabilistic tractography, a large number of WM-ROI connections between target ROIs were common to all infants: in CCCR, 6 (specifically, all transcallosal pairs); in L-PROJ, 11; in R-PROJ, 13; in L-ASSOC, 7; and in R-ASSOC, 8. These are represented graphically in light blue for both hemispheres of the PROJ and ASSOC networks in Fig. 3, and average values from these locations were used in subsequent statistical analyses below. Also highlighted in the same figure are additional connections found in at least 80% of newborns in both groups. Only a small number of WM-ROI connections were found in at least 80% of one group but not in the other (Fig. 3).
Fig. 3.
Schematic representation and comparison of WM-ROI connections found among target ROIs in the majority of subjects in the HC and PAE groups for the projection and association networks. R-PROJ, L-PROJ, R-ASSOC and L-ASSOC are shown for HC in panels A–D, respectively, and for PAE in panels E–H. Arrows in light blue represent connections for all subjects in both groups; in dark blue, for connections in at least 80% of subjects in both groups; in orange, for at least 80% of subjects in one group but not the other.
An illustration of probabilistic WM-ROI volumes found for the CCCR network is shown for one HC and one PAE infant in Fig. 4. Blue circles represent the approximate cross sections of the target ROIs in the slices (highlighted in yellow), and red volumes show locations of voxels in the WM-ROI associated with pairwise connections of target ROIs. After accounting for the effects of other predictors, alcohol did not show significant association with the normalized volumes (NV) of the WM-ROIs.
Fig. 4.

Examples of WM-ROIs (red) connecting target ROI spheres (yellow circles) for transcallosal connections (CCCR network), calculated using probabilistic tractography. Panels show results for: A) one HC, and B) one PAE infant, in three matching axial (top row) and sagittal (bottom row) slices. Images are overlaid on FA maps.
The mean and standard deviation of average parameter values in each of the WM networks are shown in Table 3. For each infant, averages were calculated over all voxels in the set of network WM-ROIs (i.e., those observed in all newborns, as represented in light blue in Fig. 3). T-tests between the groups showed no statistical differences in average network values with significance of p<0.05.
3.4 Relations of alcohol exposure and other predictors to the DTI and physical outcome measures
The network level effects of frequency of maternal drinking during pregnancy and the other predictors considered as potential confounders are summarized in Table 4. These network-level analyses were followed by multiple regressions relating the five predictors to the DTI outcome measures for each WM-ROI within the networks that were related to any of the predictors at p<0.05. The directionality and magnitude of the associations between the predictors and outcomes within each of the networks are represented in Table 4 by the median standardized regression coefficients from the WM-ROI-specific regressions. At the network level, prenatal alcohol exposure is significantly related to FA only in the R-ASSOC network. By contrast, it is related to lower MD and particularly strongly to lower AD in all five networks. Exposure to smoking during pregnancy is consistently associated with higher PD in all five networks, although those associations fall short of conventional levels of statistical significance (in each case, p<0.10).
TABLE 4.
Relation of prenatal alcohol exposure and other predictors to the DTI and physical outcome measures in the WM-ROIs in each of the networks.
| FA | MD | AD | PD | ||||||||||
|---|---|---|---|---|---|---|---|---|---|---|---|---|---|
| Network | Pred. | βmed | F (dfN, dfD) | p | βmed | F (dfN, dfD) | p | βmed | F (dfN, dfD) | p | βmed | F (dfN, dfD) | p |
| CCCR | |||||||||||||
| alc | −0.70 | 8.6 (1, 14) | 0.011* | −0.72 | 14.0 (1, 14) | 0.002* | |||||||
| clg | −0.27 | 2.5 (6, 9) | 0.101 | 0.47 | 3.5 (1, 14) | 0.083 | |||||||
| mat. age | 0.56 | 5.5 (1, 14) | 0.034* | 0.53 | 6.3 (1, 14) | 0.025* | |||||||
| L-PROJ | |||||||||||||
| alc | −0.41 | 3.9 (10, 140) | 0.000*** | −0.52 | 4.1 (10, 140) | 0.000*** | |||||||
| clg | 0.12 | 4.2 (11, 4) | 0.091 | 0.52 | 4.0 (1, 14) | 0.066 | |||||||
| mat. age | 0.37 | 4.4 (1, 14) | 0.056 | 0.44 | 6.5 (1, 14) | 0.023* | |||||||
| R-PROJ | |||||||||||||
| alc | −0.41 | 1.9 (12, 168) | 0.035* | −0.45 | 2.7 (12, 168) | 0.002** | |||||||
| clg | 0.48 | 3.4 (1, 14) | 0.085 | ||||||||||
| age | 0.33 | 8.6 (13, 2) | 0.109 | −0.41 | 5.8 (1, 14) | 0.031* | −0.39 | 5.3 (1, 14) | 0.038* | ||||
| mat. age | −0.16 | 9.2 (13, 2) | 0.103 | ||||||||||
| sex | −0.20 | 4.3 (1, 14) | 0.056 | −0.39 | 5.9 (1, 14) | 0.029* | |||||||
| L-ASSOC | |||||||||||||
| alc | −0.65 | 6.0 (7, 8) | 0.011* | −0.66 | 8.1 (1, 14) | 0.013* | |||||||
| clg | 0.49 | 3.6 (1, 14) | 0.080 | ||||||||||
| age | −0.16 | 2.5 (6, 84) | 0.030* | ||||||||||
| mat. age | 0.44 | 3.8 (1, 14) | 0.071 | 0.43 | 4.7 (1, 14) | 0.048* | |||||||
| R-ASSOC | |||||||||||||
| alc | 0.23 | 1.8 (7, 98) | 0.090 | −0.62 | 10.2 (1, 14) | 0.007** | −0.67 | 14.1 (1, 14) | 0.002** | ||||
| clg | −0.29 | 3.9 (1, 14) | 0.068 | 0.5 | 3.5 (1, 14) | 0.082 | |||||||
| age | −0.05 | 5.5 (8, 7) | 0.018* | −0.22 | 5.6 (8, 7) | 0.018* | |||||||
| mat. age | −0.10 | 2.3 (7, 98) | 0.035* | 0.43 | 4.5 (1, 14) | 0.053 | 0.40 | 5.7 (1, 14) | 0.032* | ||||
| sex | 0.18 | 2.5 (7, 98) | 0.020* | 0.13 | 2.0 (7, 98) | 0.068 | |||||||
F-values are shown with final degrees of freedom of numerator (dfN) and denominator (dfD). Median standardized β-values were calculated from the additional multivariate regressions of each network’s individual WM-ROIs (Sec. 3.3). Only predictors exhibiting effects at p≤0.10 are shown.
p<0.05;
p<0.01;
p<0.001.
alc = frequency of maternal drinking; age = infant age since conception; sex: male=1, female = 2; cig = maternal smoking (cig/day); mat. age = maternal age at
Results from the WM-ROI-specific multiple regressions are shown in Fig. 5 for AD, for which the strongest alcohol-structure relations were observed in the network level tests. Greater prenatal alcohol exposure is related to lower AD in all six of the CCCR network WM-ROIs. In the PROJ networks, increased prenatal alcohol is related to lower AD bilaterally in tractographic connections in three regions: the corticospinal tracts (connecting ROIs 1-6), superior thalamic radiations (ROIs 4-6) and the posterior thalamic radiations (ROIs 7-8). In the ASSOC networks, greater prenatal alcohol is also associated with lower AD bilaterally in three regions: the uncinate fasciculus (connecting ROIs 1-2), superior longitudinal fasciculus (ROIs 3-7) and the inferior longitudinal fasciculus (ROIs 6-8).
Fig. 5.
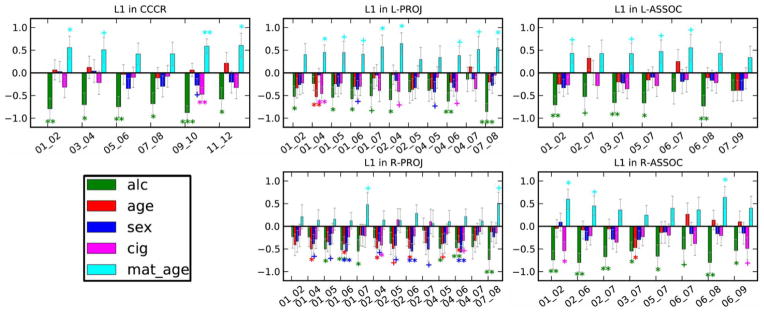
Relations of prenatal alcohol exposure (green) and the other predictors to AD within each of the WM-ROIs in each of the networks. Values are standardized regression coefficients ±SD. Alc = frequency of maternal drinking during pregnancy; age = infant age since conception; sex (1=male, 2=female); cig = maternal average of cigarettes smoked during pregnancy; mat. age = maternal age at delivery. + p≤0.10, * p<0.05, ** p<0.01, *** p<0.001. The predictor abbreviations are: alc-- maternal frequency of drinking; age-- infant weeks since conception at scan; cig-- mother’s average cigarette smoking during pregnancy; mat. age-- maternal age at delivery.
With respect to the other predictors, older age at scan is associated with lower MD in the R-PROJ network, lower AD in R-PROJ, L-ASSOC, and R-ASSOC, and lower PD in R-ASSOC (Table 4). Postconception age at scan is also associated with higher FA in the PROJ networks, particularly in the medial regions (see Fig. 6). Older maternal age is associated with lower FA and higher MD in the R-ASSOC network and lower AD in L-PROJ and L-ASSOC. Girls have higher FA in the R-ASSOC network and lower AD in R-PROJ. Maternal smoking during pregnancy is positively correlated with higher PD in all five networks although these associations fall short of statistical significance (Fig. 6).
Fig. 6.

Locations of trend and higher significance from multivariate analyses of each WM-ROI for FA (left column) and PD (right column). Values are standardized regression coefficients ±SD. Alc = frequency of maternal drinking during pregnancy; age = infant age since conception; sex (1=male, 2=female); cig = maternal average of cigarettes smoked during pregnancy; mat. age = maternal age at delivery. + p≤0.10, * p<0.05, ** p<0.01, *** p<0.001. The predictor abbreviations are: alc-- maternal frequency of drinking; age-- infant weeks since conception at scan; cig-- mother’s average cigarette smoking during pregnancy; mat. age-- maternal age at delivery.
4. DISCUSSION
This study is the first to use neuroimaging to compare structural brain development in newborns with prenatal alcohol exposure to that of healthy controls, and it is the first to use DTI and tractography to examine the effects of prenatal alcohol exposure in the neonatal period. This is also the first study to implement neuroimaging of nonsedated newborns in South Africa. Structural changes associated with PAE were investigated by dividing the major classes of WM into five networks and then using tractography to locate regions across all subjects. Comparisons of WM properties were made at whole brain, network and individual ROI levels. Infant sex and postconception age at scan and maternal age at delivery and smoking during pregnancy were included in the statistical models to rule out their potential confounding influences on observed associations with alcohol exposure.
DTI provides important physical measures of neuronal microstructure. The application of tractography permits the estimation and localization of extended WM structures, even in early stages of development. This is particularly useful when studying subject populations, such as newborns, for whom standard WM atlases are lacking and in which one would expect a diversity of fiber tract structures. In this study, diffusion information was supplemented with measures of T1, PD and (normalized) WM-ROI volume.
Healthy WM development begins in the early gestational period, with processes of fiber pruning, “pre-myelination” and myelination typically starting in the second half of pregnancy and continuing after birth. WM maturation generally occurs along caudo-rostral, medio-lateral and infero-superior gradients (Dubois et al., 2013). At birth, central WM and CC have higher FA than peripheral WM, with the latter parameter increasing at around 2 months (see Welker and Patton, 2012). FA changes occur relatively slowly, not reaching adult-like morphology until approximately 4 years of age, with anisotropy continuing to increase through 10 years of age (Hermoye et al., 2006) and beyond. PD and T1 also change with WM maturation, decreasing with myelination and the displacement of free water content (Barkovich, 2000). A decrease in MD is also associated with increased volumes of myelinated structures and neuronal maturation (Mukherjee et al., 2001; Lebel et al., 2008b).
Several DTI studies have examined physiological changes associated with prenatal alcohol exposure. To our knowledge, all previous DTI and tractography alcohol exposure studies have been of older subjects (>4 years), when WM is already at a very mature state in humans (e.g., Wozniak et al. 2006; Lebel et al., 2008a; Sowell et al. 2008; Fryer et al., 2009; Ma et al. 2005; Li et al. 2009). Previous FASD WM imaging studies have focused mainly on the corpus callosum (CC), due to its relative ease of definition and association of structural effects in this area with cognitive outcomes (Bookstein et al., 2002). Studies have shown effects on WM density, decreases in volume (though not always after accounting for effects on total brain volume) and alterations in shape (Sowell et al., 2001a; Sowell et al., 2001b). Using DTI, several studies have found lower FA and/or higher MD in the CC of children between the ages of 5–18 years (Wozniak et al. 2006; Lebel et al., 2008a; Sowell et al. 2008; Fryer et al., 2009) and of young adults aged 18–27 years (Ma et al. 2005; Li et al. 2009).
The aims of this study were to examine effects of heavy prenatal alcohol exposure on the developing WM in newborns, to investigate as much of the WM skeleton as possible, and to focus on localized segments, since maturation is known to vary spatiotemporally. Interestingly, the strongest effects of maternal alcohol consumption were observed in axial diffusivity, with higher alcohol exposure associated with lower AD throughout the brain. Based on previous DTI studies, maturation-dependent changes in AD are generally not expected in older subjects (Gao et al., 2009; Dubois et al., 2013), but in newborns AD levels may still depend on degree of myelination, fiber trimming, and chemical- and water-content changes. These effects on AD (and, to a lesser degree, on MD, which is linearly dependent on it) were observed on both network and regional levels, while accounting for possible age- and sex-dependent effects in the newborns, as well as for exposure to maternal smoking during gestation and maternal age at delivery.
While FA was related to infant age in this study, it was not significantly associated with alcohol exposure. Instead, the most significant parameter relations to alcohol exposure across all WM networks were observed in AD and, to a lesser extent, in MD. Decreases in AD have been observed previously in DTI studies of WM damage (Shepherd et al., 2001; Beaulieu, 2002; Wu et al., 2007). For example, Shepherd et al. (2001) reported that cytoskeletal disruption due to neurotoxin exposure reduced only axial and not perpendicular diffusivity. In that study, it was hypothesized that the axon itself, rather than the myelin, was the main locus of pathology, possibly due to neurofilament disruption, increased axonal tortuosity, increased protein content and potential changes in intracellular viscosity (Beaulieu, 2002; Wu et al., 2007). Thus, decreased AD and overall MD, with negligible effects on FA values, such as seen here, may indicates axonal damage with increased alcohol exposure.
Consistent with prior studies of older subjects, the callosal (CCCR) regions showed strong DTI effects in relation to prenatal alcohol exposure, though here with AD as the marker. Significant effects were also seen in the projection (both L- and R-PROJ) WM, typically in medial and inferior locations, in which myelination processes may be expected to be occurring at this age. Effects on frontal regions were observed, including in the uncinate, a region in which prenatal alcohol-related effects on WM were seen in a recent longitudinal study of 5- to 15-year-olds with FASD using FA and MD measures (Treit et al., 2013). In the lateral networks examined in the current study, alcohol exposure-related effects in the cortico-cortico association fibers were approximately L-R symmetric.
It is notable that, by contrast to studies of children and adults, prenatal alcohol exposure was not significantly related to FA or to normalized regional volumes in the newborn period. However, as might be expected, it was observed, for example, that FA was higher in older infants in medial regions in the PROJ networks, one of the areas where early myelination occurs. The data suggest that diffusion measures other than FA are more sensitive to neurotoxic insult during early development, before myelination is well established. These findings also illustrate the importance of investigating WM changes at various ages, particularly during early development, to understand how prenatal alcohol exposure interferes with normal brain development.
Studies of structural effects associated with prenatal alcohol exposure can inform our understanding of potential alterations to brain connectivity and function, behavior and cognition. Most previous DTI structural studies have focused on transcallosal connections, and the implications of these effects are seen in their associations with both poorer behavioral test scores (Bookstein et al., 2002) and decreased functional MRI (FMRI) and behavioral measures of interhemispheric connectivity in individuals with FASD (Dodge et al., 2009; Wozniak et al., 2011). Wozniak et al. (2013) have recently suggested that prenatal alcohol exposure may be associated with global connectivity disruptions. The results of the present study suggest that such these disruptions may already be manifest in early effects on WM structure.
Probabilistic tractography identifies WM connections that are observed between pairs of target regions, but one cannot determine whether missing connections are “false negatives” or truly not present in subjects. In this study the locations of structural connections found using tractography were both widespread across the brain and similar between groups. This finding is consistent with the similarity in ratios of WM to whole brain volumes between the PAE and HC groups. Notably, the differences in structural connectivity associated with prenatal alcohol exposure were observed primarily in the properties of the existing WM across all networks and not in an absence or deformation of physical WM structures.
T1 and PD parameter maps were calculated for all subjects. Neither parameter showed significant association with alcohol exposure. Observed T1 relaxation times in WM were higher than those recently reported (approximately 2 s) for infants in a developmental review by Dubois et al. (2013), which may be explained in part by the fact that their infants were older than those in this study (equivalent to 46 wks postconception age), and T1 tends to decrease with early development. Williams et al. (2005) reported T1 values 2.9±0.1 s in WM of preterm infants scanned at term, which are consistent with values of the current study. The PD values calculated from the multiecho acquisitions have arbitrary units, so comparisons were made within this study.
Tobacco, like alcohol, is a known teratogen, whose detrimental effects on fetal and infant postnatal growth (Jacobson et al., 1994a,b) and adolescent WM integrity (Jacobsen et al., 2007). However, to our knowledge, no DTI and tractography studies of smoking-exposed newborns have previously been performed. Our observation that prenatal exposure to maternal smoking was consistently (albeit not significantly) related to increased PD in all five networks suggests that an examination of effects of smoking on WM development in a larger sample is warranted.
In this study, several significant associations have been demonstrated between maternal alcohol consumption during pregnancy and physical variables of WM microstructure. Moreover, these results are consistent across network- and WM-ROI-levels. Results here have focused on the novel findings of axial diffusivity AD, as a highly significant marker of microstructural change in alcohol exposed newborns.
Significance levels in Table 3 were presented without corrections for multiple comparisons. In calculating the number of effects tested in relation to prenatal alcohol exposure, five networks and seven physical outcome variables were investigated. However, several outcome variables are both mathematically related and statistically highly correlated. For example, accounting for the high correlation of MD and RD with AD (r>0.95 and r>0.92, respectively), the critical value for Bonferroni correction with 5 × 5 = 25 associations is p<0.002. Even utilizing this strict adjustment factor (which ignores other correlations among variables as well as possible left-right hemispheric symmetry), a large proportion of the p-values for maternal drinking during pregnancy remain significant, particularly for AD.
The acquisition of DTI data from nonsedated newborns, whether healthy controls or other sample groups, is particularly difficult due to susceptibility of volumes with long TR and large diffusion gradients to even small amounts of motion. To limit these issues, we have wrapped the newborns in a MRI-compatible vacuum cushion, manually checked for and discarded dropout volumes, and then used a motion correction and a susceptibility-distortion post-processing step. One limitation of this study is the relatively small sample size. Nevertheless, despite these limitations, it was still possible to observe significant and consistent relations of WM structure with prenatal alcohol, as well as with other independent variables, at both the network and local ROI levels. Future studies of longitudinal changes in WM properties throughout infant development would be of interest, as would investigations of left-right asymmetries, to understand better the brain development in infants with PAE. Correlations of these WM changes with long-term development assessments will also be of interest to highlight which brain structures explain the impaired neurodevelopment of these children.
5. CONCLUSIONS
We have presented results from the first DTI and tractography examination of effects of prenatal alcohol exposure on the newborn brain. Microstructural effects were examined in relation to prenatal alcohol exposure in several major classes of WM, including transcallosal, projection and association fibers. After controlling for effects of infant postconception age and sex and maternal age and smoking, the maternal frequency of heavy drinking during pregnancy was associated with lower levels of axial diffusivity in all networks, with investigations of local regions indicating the largest effects in medial and inferior WM. While previous studies of older subjects have focused mainly on FA and MD values in the corpus callosum, this study demonstrates the importance of AD in the developing brain and the brain-wide nature of WM effects associated with prenatal alcohol exposure.
Supplementary Material
Fig. A1: Example comparisons of deterministic (A and C) and the novel mini-probabilistic (B and D) tractography. Panels in the top row show reconstructed tracts passing through a single target ROI (orange), with greater extent and volume of output apparent in the mini-probabilistic case (and very few obvious errors). Panels in the bottom row present the comparison of network-wide tracts (R-ASSOC network, AND logic; see main text) with full-probabilistic results (translucent surface). Again, mini-probabilistic tracts show greater volume and extent, with notably few false positives by comparison with full probabilistic tracking.
Acknowledgments
This research was supported by grants from the National Institute on Alcohol Abuse and Alcoholism and R01-AA016781 (SJ) and R21-AA020037 (SJ, EM, AvdK), FIC and NIAAA grant R21-AA017410 (AvdK, EM), NIMH grant R21MH096559 (Laughton, EM, AvdK), the NRF/DST South African Research Chairs Initiative (EM), the South African Medical Research Council, and supplemental funding from the Joseph Young, Sr., Fund, from the State of Michigan (SWJ and JLJ). Portions of this research were presented at the 2013 and 2014 meetings of the Organization for Human Brain Mapping. We thank Larry Wald, Aaron Hess and Ken Mbugua for their work in constructing the bird cage RF coil used in this study; Simon Warfield for his work with PW in developing the procedure for preparing the newborn scan that enabled us to obtain the scanning data; the Cape Universities Brain Imaging Centre radiographers Nailah Maroof and Alison Siljeur; and our UCT and WSU research staff Maggie September, Beverly Arendse, Moira Raatz, Patricia Soloman, and graduate research assistants Fleur Warton and Neil Dodge. We greatly appreciate the participation of the Cape Town mothers and infants in the study.
A1. APPENDIX
In order to make use of tractography, it is necessary to place target ROIs in locations with relevant intra-network connections. Subjects in this study did not have functional scans and, being newborns, standard atlases of WM connections were not readily available. In order to place targets at likely WM junctions of specific networks in an efficient and realistic (i.e., data driven) manner, a novel approach of tractography, termed “mini-probabilistic,” was implemented. We describe it here briefly.
A1.1 Mini-probabilistic methodology
The purpose of this approach is to use tractography itself to highlight relevant locations for target ROI placement within the separate networks to be investigated (here, transcallosal, projection and association fibers); particularly for examining extended WM tracts, merely using thresholded FA maps does not provide sufficient information. However, standard deterministic tractography is known to be susceptible to error accumulation and false negatives, in large part because it does not take into account the various noise sources and uncertainty included within voxelwise tensor fits. While probabilistic methods utilize model uncertainty, they generate volume maps without linear tract structure and also generally require much more time to run due to their computational complexity.
Here, we combine the speed and tract-preserving properties of the deterministic algorithm with the uncertainty inclusion of the probabilistic. In this “mini-probabilistic” form, a small number of iterations of whole brain, brute force tractography are performed, with tensor properties perturbed according to their estimated uncertainties after each iteration. This was performed using the AFNI-FATCAT software (Taylor and Saad, 2013), with tensor parameter uncertainty calculated using 3dDWUncert and the tracking using 3dTrackID in mini-probabilistic mode.
It was found that with as few as 5–7 total tractographic iterations, more robust tract locations and fewer false negatives (as verified with full probabilistic tracking) were found than using purely deterministic tracking with the same number of seeds. While small numbers of individual false positive tracts were observed, these were easily apparent visually and so discounted when placing targets (these would be filtered out in the full probabilistic thresholding). Moreover, due to the small number of iterations, mini-probabilistic results were still produced quickly (<5–10 seconds), simplifying interactive use.
A1.2 Mini-probabilistic examples
Mini-probabilistic examples are shown in Fig. A1 for a HC newborn subject from this study. Differences in the reconstructed tracts passing through a test ROI using A) purely deterministic tractography and B) mini-probability (5 iterations) are readily observable. Tract extent and volume of reconstructions tend to be greater with the mini-probabilistic approach, with very few extraneous tracts.
In the bottom panels of the same figure, differences when tracking through a network of targets (AND logic with the R-ASSOC network, see Fig. 1) are shown when using C) deterministic and D) mini-probabilistic tracking. The translucent overlay shows the surface volume of the fully probabilistic output for this network (as described in the Methods of the main text). The relative robustness of the mini-probabilistic approach is notable in producing fibers which fill the final volume to a much greater extent than purely deterministic results, with essentially no extraneous fibers in this case.
A1.3 Mini-probabilistic application and conclusions
The mini-probabilistic tracking plays a useful role in the placement of intra-network targets. In this study, whole-brain mini-probabilistic tracking was performed, and then a primary target was placed in an obvious location within a network of interest, i.e., within the left inferior brain stem for the L-PROJ network. Further target ROIs were placed based on the location of tracts through the initial target, and so forth, until much of the network had been covered. Thus, mini-probabilistic tracking provides a simple, efficient means for producing tractographic results, particularly for target ROI placement, with greater robustness than purely deterministic approaches alone.
Footnotes
CONFLICTS OF INTEREST: The authors declare no competing financial interests.
The authors declare no competing financial interests.
References
- Alhamud A, Tisdall MD, Hess AT, Hasan KM, Meintjes EM, van der Kouwe AJW. Volumetric navigators for real-time motion correction in diffusion tensor imaging. Magn Reson Med. 2012;68(4):1097–1108. doi: 10.1002/mrm.23314. [DOI] [PMC free article] [PubMed] [Google Scholar]
- Andersson JL, Skare S, Ashburner J. How to correct susceptibility distortions in spin-echo echo-planar images: application to diffusion tensor imaging. NeuroImage. 2003;20(2):870–88. doi: 10.1016/S1053-8119(03)00336-7. [DOI] [PubMed] [Google Scholar]
- Archibald SL, Fennema-Notestine C, Gamst A, Riley EP, Mattson SN, Jernigan TL. Brain dysmorphology in individuals with severe prenatal alcohol exposure. Dev Med Child Neurol. 2001;43:148–154. [PubMed] [Google Scholar]
- Basser PJ, Pierpaoli C. Microstructural and physiological features of tissues elucidated by quantitative-diffusion-tensor MRI. J Magn Reson B. 1996;111:209–219. doi: 10.1006/jmrb.1996.0086. [DOI] [PubMed] [Google Scholar]
- Beaulieu C. The basis of anisotropic water diffusion in the nervous system—A technical review. NMR Biomed. 2002;15:435–455. doi: 10.1002/nbm.782. [DOI] [PubMed] [Google Scholar]
- Bichenkov E, Ellingson JS. Ethanol exerts different effects on myelin basic protein and 2′,3′-cyclic nucleotide 3′-phosphodiesterase expression in differentiating CG-4 oligodendrocytes. Brain Research Developmental Brain Research. 2001;128:9–16. doi: 10.1016/s0165-3806(01)00142-0. [DOI] [PubMed] [Google Scholar]
- Bookstein FL, Streissguth AP, Sampson PD, Connor PD, Barr HM. Corpus callosum shape and neuropsychological deficits in adult males with heavy fetal alcohol exposure. NeuroImage. 2002;15:233–251. doi: 10.1006/nimg.2001.0977. [DOI] [PubMed] [Google Scholar]
- Chen G, Adleman NE, Saad ZS, Leibenluft E, Cox RW. Applications of multivariate modeling to neuroimaging group analysis: A comprehensive alternative to univariate general linear model. NeuroImage. 2014;99:571–588. doi: 10.1016/j.neuroimage.2014.06.027. [DOI] [PMC free article] [PubMed] [Google Scholar]
- Chen X, Coles CD, Lynch ME, Hu X. Understanding specific effects of prenatal alcohol exposure on brain structures in young adults. Hum Brain Mapp. 2012;33:1663–1676. doi: 10.1002/hbm.21313. [DOI] [PMC free article] [PubMed] [Google Scholar]
- Chiappelli F, Taylor AN, Espinosa de los Monteros A, de Vellis J. Fetal alcohol delays the development expression of myelin basic protein and transferring in rat primary oligodendrocyte cultures. International Journal of Developmental Neuroscience. 1991;9:67–75. doi: 10.1016/0736-5748(91)90074-v. [DOI] [PubMed] [Google Scholar]
- Chiodo LM, da Costa DE, Hannigan JH, Covington CY, Sokol RJ, Janisse J, Greenwald M, Ager J, Delaney-Black V. The impact of maternal age on the effects of prenatal alcohol exposure on attention. Alc Clin Exp Res. 2010;34(10):1813–21. doi: 10.1111/j.1530-0277.2010.01269.x. [DOI] [PMC free article] [PubMed] [Google Scholar]
- Cox RW. AFNI: software for analysis and visualization of functional magnetic resonance neuroimages. Comput Biomed Res. 1996;29:162–173. doi: 10.1006/cbmr.1996.0014. [DOI] [PubMed] [Google Scholar]
- Croxford J, Viljoen D. Alcohol consumption by pregnant women in the Western Cape. S Afr Med J. 1999;89(9):962–5. [PubMed] [Google Scholar]
- Deoni SC, Peters TM, Rutt BK. High-resolution T1 and T2 mapping of the brain in a clinically acceptable time with DESPOT1 and DESPOT2. Magn Reson Med. 2005;53(1):237–41. doi: 10.1002/mrm.20314. [DOI] [PubMed] [Google Scholar]
- Diwadkar VA, Meintjes EM, Goradia D, Dodge NC, Warton C, Molteno CD, Jacobson SW, Jacobson JL. Differences in cortico-striatal-cerebellar activation during working memory in syndromal and nonsyndromal children with prenatal alcohol exposure. Hum Brain Mapp. 2013;34:1931–1945. doi: 10.1002/hbm.22042. [DOI] [PMC free article] [PubMed] [Google Scholar]
- Dodge NC, Jacobson JL, Molteno CD, Meintjes EM, Bangalore S, Diwadkar V, Hoyme EH, Robinson LK, Khaole N, Avison MJ, Jacobson SW. Prenatal alcohol exposure and interhemispheric transfer of tactile information: Detroit and Cape Town findings. Alc Clin Exp Res. 2009;33:1628–1637. doi: 10.1111/j.1530-0277.2009.00994.x. [DOI] [PMC free article] [PubMed] [Google Scholar]
- Dubois J, Hertz-Pannier L, Dehaene-Lambertz G, Cointepas Y, Le Bihan D. Assessment of the early organization and maturation of infants’ cerebral white matter fiber bundles: a feasibility study using quantitative diffusion tensor imaging and tractography. NeuroImage. 2006;30(4):1121–32. doi: 10.1016/j.neuroimage.2005.11.022. [DOI] [PubMed] [Google Scholar]
- Dubois J, Dehaene-Lambertz G, Kulikova S, Poupon C, Hüppi PS, Hertz-Pannier The early development of brain white matter: A review of imaging studies in fetuses, newborns and infants. Neuroscience. 2013 doi: 10.1016/j.neuroscience.2013.12.044. S0306-4522(13)01069-5 Epub ahead of print. [DOI] [PubMed] [Google Scholar]
- Fischl B, Salat DH, van der Kouwe AJ, Makris N, Ségonne F, Quinn BT, Dale AM. Sequence-independent segmentation of magnetic resonance images. Neuroimage. 2004;23(Suppl 1):S69–84. doi: 10.1016/j.neuroimage.2004.07.016. [DOI] [PubMed] [Google Scholar]
- Fryer SL, Tapert SF, Mattson SN, Paulus MP, Spadoni AD, Riley EP. Prenatal alcohol exposure affects frontal-striatal BOLD response during inhibitory control. Alc Clin Exp Res. 2007;31:1415–1424. doi: 10.1111/j.1530-0277.2007.00443.x. [DOI] [PubMed] [Google Scholar]
- Fryer SL, Schweinsburg BC, Bjorkquist OA, Frank LR, Mattson SN, Spadoni AD, Riley EP. Characterization of white matter microstructure in fetal alcohol spectrum disorders. Alcohol Clin Exp Res. 2009;33(3):514–521. doi: 10.1111/j.1530-0277.2008.00864.x. [DOI] [PMC free article] [PubMed] [Google Scholar]
- Gao W, Lin W, Chen Y, Gerig G, Smith JK, Jewells V, Gilmore JH. Temporal and spatial development of axonal maturation and myelination of white matter in the developing brain. AJNR Am J Neuroradiol. 2009;30(2):290–6. doi: 10.3174/ajnr.A1363. [DOI] [PMC free article] [PubMed] [Google Scholar]
- Guerri C, Pascual M, Renau-Piqueras J. Glia and fetal alcohol syndrome. Neurotoxicology. 2001;22:593–599. doi: 10.1016/s0161-813x(01)00037-7. [DOI] [PubMed] [Google Scholar]
- Guerri C, Bazinet A, Riley EP. Foetal Alcohol Spectrum Disorders and alterations in brain and behaviour. Alcohol and Alcoholism. 2009;44:108–114. doi: 10.1093/alcalc/agn105. [DOI] [PMC free article] [PubMed] [Google Scholar]
- Hermoye L, Saint-Martin C, Cosnard G, Lee SK, Kim J, Nassogne MC, Menten R, Clapuyt P, Donohue PK, Hua K, Wakana S, Jiang H, van Zijl PC, Mori S. Pediatric diffusion tensor imaging: normal database and observation of the white matter maturation in early childhood. Neuroimage. 2006;29(2):493–504. doi: 10.1016/j.neuroimage.2005.08.017. [DOI] [PubMed] [Google Scholar]
- Holzman C, Paneth N, Little R, Pinto-Martin J. Perinatal brain injury in premature infants born to mothers using alcohol in pregnancy. Pediatrics. 1995;95:66–73. [PubMed] [Google Scholar]
- Hüppi PS, Dubois J. Diffusion tensor imaging of brain development. Semin Fetal Neonatal Med. 2006;11:489–497. doi: 10.1016/j.siny.2006.07.006. [DOI] [PubMed] [Google Scholar]
- Jacobsen LK, Picciotto MR, Heath CJ, Frost SJ, Tsou KA, Dwan RA, Jackowski MP, Constable RT, Mencl WE. Prenatal and adolescent exposure to tobacco smoke modulates the development of white matter microstructure. J Neurosci. 2007;27(49):13491–8. doi: 10.1523/JNEUROSCI.2402-07.2007. [DOI] [PMC free article] [PubMed] [Google Scholar]
- Jacobson JL, Jacobson SW, Sokol RJ, Martier SS, Ager JW, Shankaran S. Effects of alcohol use, smoking, and illicit drug use on fetal growth in black infants. The Journal of Pediatrics. 1994a;124:757–764. doi: 10.1016/s0022-3476(05)81371-x. [DOI] [PubMed] [Google Scholar]
- Jacobson JL, Jacobson SW, Sokol RJ. Effects of prenatal exposure to alcohol, smoking, and illicit drugs on postpartum somatic growth. Alcoholism: Clinical and Experimental Research. 1994b;18:317–323. doi: 10.1111/j.1530-0277.1994.tb00020.x. [DOI] [PubMed] [Google Scholar]
- Jacobson JL, Jacobson SW, Sokol RJ. Increased vulnerability to alcohol-related birth defects in the offspring of mothers over 30. Alcohol Clin Exp Res. 1996;20:359–363. doi: 10.1111/j.1530-0277.1996.tb01653.x. [DOI] [PubMed] [Google Scholar]
- Jacobson JL, Jacobson SW, Molteno CD, Odendaal H. A prospective examination of the incidence of heavy drinking during pregnancy among Cape Coloured South African women. Alcohol Clin Exp Res. 2006;30:233A. [Google Scholar]
- Jacobson SW, Chiodo LM, Jacobson JL, Sokol RJ. Validity of maternal report of alcohol, cocaine, and smoking during pregnancy in relation to infant neurobehavioral outcome. Pediatrics. 2002;109:815–825. doi: 10.1542/peds.109.5.815. [DOI] [PubMed] [Google Scholar]
- Jacobson SW, Jacobson JL, Sokol RJ, Chiodo LM, Corobana R. Maternal age, alcohol abuse history, and quality of parenting as moderators of the effects of prenatal alcohol exposure on 7.5-year intellectual function. Alc Clin Exp Res. 2004;28:1732–1745. doi: 10.1097/01.alc.0000145691.81233.fa. [DOI] [PubMed] [Google Scholar]
- Jacobson SW, Stanton ME, Molteno CD, Burden MJ, Fuller DS, Hoyme HE, Robinson LK, Khaole N, Jacobson JL. Impaired eyeblink conditioning in children with fetal alcohol syndrome. Alcohol Clin Exp Res. 2008;32:365–372. doi: 10.1111/j.1530-0277.2007.00585.x. [DOI] [PubMed] [Google Scholar]
- Jones KL, Smith DW. Recognition of the fetal alcohol syndrome in early infancy. Lancet. 1973;2:999–1001. doi: 10.1016/s0140-6736(73)91092-1. [DOI] [PubMed] [Google Scholar]
- Lebel C, Rasmussen C, Wyper K, Walker L, Andrew G, Yager J, Beaulieu C. Brain diffusion abnormalities in children with fetal alcohol spectrum disorder. Alcohol Clin Exp Res. 2008a;32(10):1732–40. doi: 10.1111/j.1530-0277.2008.00750.x. [DOI] [PubMed] [Google Scholar]
- Lebel C, Walker L, Leemans A, Phillips L, Beaulieu C. Microstructural maturation of the human brain from childhood to adulthood. Neuroimage. 2008b;40:1044–1055. doi: 10.1016/j.neuroimage.2007.12.053. [DOI] [PubMed] [Google Scholar]
- Lemoine P, Harousseau H, Borteyru JP, Menuet JC. Les enfants de parents alcooliques: anomalies observées. A propos de 127 cas [Children of alcoholic parents: abnormalities observed in 127 cases] Ouest Medical. 1968;21:476–482. [Google Scholar]
- Li LC, Coles CD, Lynch ME, Hu X. Voxelwise and skeleton-based region of interest analysis of fetal alcohol syndrome and fetal alcohol spectrum disorders in young adults. Hum Brain Mapp. 2009;30:3265–3274. doi: 10.1002/hbm.20747. [DOI] [PMC free article] [PubMed] [Google Scholar]
- Ma X, Coles CD, Lynch ME, Laconte SM, Zurkiya O, Wang D, Hu X. Evaluation of corpus callosum anisotropy in young adults with fetal alcohol syndrome according to diffusion tensor imaging. Alcohol Clin Exp Res. 2005;29(7):1214–22. doi: 10.1097/01.alc.0000171934.22755.6d. [DOI] [PubMed] [Google Scholar]
- Mattson SN, Crocker N, Nguyen TT. Fetal alcohol spectrum disorders: Neuropsychological and behavioral features. Neuropsychology Rev. 2011;21(2):81–101. doi: 10.1007/s11065-011-9167-9. [DOI] [PMC free article] [PubMed] [Google Scholar]
- May PA. Fetal alcohol effects among North American Indians: evidence and implications for society. Alcohol Health Res World. 1991;15:239–247. [Google Scholar]
- May PA, Gossage JP, Marais AS, Adnams CM, Hoyme HE, Jones KL, Robinson LK, Khaole NC, Snell C, Kalberg WO, Hendricks L, Brooke L, Stellavato C, Viljoen DL. The epidemiology of fetal alcohol syndrome and partial FAS in a South African community. Drug and Alcohol Dependence. 2007;88:259–271. doi: 10.1016/j.drugalcdep.2006.11.007. [DOI] [PMC free article] [PubMed] [Google Scholar]
- Meintjes EM, Jacobson JL, Molteno CD, Gatenby JC, Warton C, Cannistraci CJ, Hoyme HE, Robinson LK, Khaole N, Gore JC, Jacobson SW. An FMRI study of number processing in children with fetal alcohol syndrome. Alc Clin Exp Res. 2010;34:1450–1464. doi: 10.1111/j.1530-0277.2010.01230.x. [DOI] [PubMed] [Google Scholar]
- Miller MW, Al-Rabiai S. Effects of prenatal exposure to ethanol on the number of axons in the pyramidal tract of the rat. Alc Clin Exp Res. 1994;18:346–354. doi: 10.1111/j.1530-0277.1994.tb00024.x. [DOI] [PubMed] [Google Scholar]
- Mukherjee P, Miller JH, Shimony JS, Conturo TE, Lee BC, Almli CR, McKinstry RC. Normal brain maturation during childhood: developmental trends characterized with diffusion-tensor MR imaging. Radiology. 2001;221:349–358. doi: 10.1148/radiol.2212001702. [DOI] [PubMed] [Google Scholar]
- R Core Team. R: A language and environment for statistical computing. R Foundation for Statistical Computing; Vienna, Austria: 2013. URL http://www.R-project.org/ [Google Scholar]
- Rohde GK, Barnett AS, Basser PJ, Marenco S, Pierpaoli C. Comprehensive approach for correction of motion and distortion in diffusion-weighted MRI. Magn Reson Med. 2004;51:103–114. doi: 10.1002/mrm.10677. [DOI] [PubMed] [Google Scholar]
- Shepherd TM, Thelwall PE, Wirth ED. Non-lethal disruption of the axonal cytoskeleton alters water diffusion in spinal cord white matter. Proc Intl Soc Mag Reson Med. 2001;9:1624. [Google Scholar]
- Singmann H. afex: Analysis of Factorial Experiments. R package version 0.5-71. 2013 http://CRAN.Rproject.org/package=afex.
- Smith SM, Jenkinson M, Woolrich MW, Beckmann CF, Behrens TE, Johansen-Berg H, Bannister PR, De Luca M, Drobnjak I, Flitney DE, Niazy RK, Saunders J, Vickers J, Zhang Y, De Stefano N, Brady JM, Matthews PM. Advances in functional and structural MR image analysis and implementation as FSL. NeuroImage. 2004;23(S1):S208–S219. doi: 10.1016/j.neuroimage.2004.07.051. [DOI] [PubMed] [Google Scholar]
- Song SK, Sun SW, Ramsbottom MJ, Chang C, Russell J, Cross AH. Dysmyelination revealed through MRI as increased radial (but unchanged axial) diffusion of water. NeuroImage. 2002;17:1429–1436. doi: 10.1006/nimg.2002.1267. [DOI] [PubMed] [Google Scholar]
- Sowell ER, Johnson A, Kan E, Lu LH, Van Horn JD, Toga AW, O’Connor MJ, Bookheimer SY. Mapping white matter integrity and neurobehavioral correlates in children with fetal alcohol spectrum disorders. J Neurosci. 2008;28(6):1313–9. doi: 10.1523/JNEUROSCI.5067-07.2008. [DOI] [PMC free article] [PubMed] [Google Scholar]
- Sowell ER, Mattson SN, Thompson PM, Jernigan TL, Riley EP, Toga AW. Mapping callosal morphology and cognitive correlates: effects of heavy prenatal alcohol exposure. Neurology. 2001a;57(2):235–244. doi: 10.1212/wnl.57.2.235. [DOI] [PubMed] [Google Scholar]
- Sowell ER, Thompson PM, Mattson SN, Tessner KD, Jernigan TL, Riley EP, Toga AW. Voxel-based morphometric analyses of the brain in children and adolescents prenatally exposed to alcohol. NeuroReport. 2001b;12(3):515–523. doi: 10.1097/00001756-200103050-00018. [DOI] [PubMed] [Google Scholar]
- Spottiswoode BS, Meintjes EM, Anderson AW, Molteno CD, Stanton ME, Dodge NC, Gore JC, Peterson BS, Jacobson JL, Jacobson SW. Diffusion tensor imaging of the cerebellum and eyeblink conditioning in fetal alcohol spectrum disorder. Alcohol Clin Exp Res. 2011;35:2174–83. doi: 10.1111/j.1530-0277.2011.01566.x. [DOI] [PMC free article] [PubMed] [Google Scholar]
- Streissguth AP, Sampson PD, Olson HC, Bookstein FL, Barr HM, Scott M, Feldman J, Mirsky AF. Maternal drinking during pregnancy: attention and short-term memory in 14-year-old offspring-a longitudinal prospective study. Alc Clin Exp Res. 1994;18:202–218. doi: 10.1111/j.1530-0277.1994.tb00904.x. [DOI] [PubMed] [Google Scholar]
- Taylor PA, Cho KH, Lin CP, Biswal BB. Improving DTI tractography by including diagonal tract propagation. PLoS One. 2012;7(9):e43415. doi: 10.1371/journal.pone.0043415. [DOI] [PMC free article] [PubMed] [Google Scholar]
- Taylor PA, Saad ZS. FATCAT: (an efficient) Functional And Tractographic Connectivity Analysis Toolbox. Brain Connectivity. 2013;3(5):523–535. doi: 10.1089/brain.2013.0154. [DOI] [PMC free article] [PubMed] [Google Scholar]
- Treit S, Lebel C, Baugh L, Rasmussen C, Andrew G, Beaulieu C. Longitudinal MRI Reveals Altered Trajectory of Brain Development during Childhood and Adolescence in Fetal Alcohol Spectrum Disorders. J Neuroscience. 2013;33(24):10098–10109. doi: 10.1523/JNEUROSCI.5004-12.2013. [DOI] [PMC free article] [PubMed] [Google Scholar]
- van der Kouwe AJW, Benner T, Salat DH, Fischl B. Brain morphometry with multiecho MPRAGE. Neuroimage. 2008;40:559–569. doi: 10.1016/j.neuroimage.2007.12.025. [DOI] [PMC free article] [PubMed] [Google Scholar]
- Wang R, Benner T, Sorensen AG, Wedeen VJ. Diffusion Toolkit: A Software Package for Diffusion Imaging Data Processing and Tractography. Proc Intl Soc Mag Reson Med. 2007;15:3720. [Google Scholar]
- Watari H, Born DE, Gleason CA. Effects of first trimester binge alcohol exposure on developing white matter in fetal sheep. Pediatric Research. 2006;59:560–564. doi: 10.1203/01.pdr.0000203102.01364.de. [DOI] [PubMed] [Google Scholar]
- Welker KM, Alice Patton A. Assessment of Normal Myelination with Magnetic Resonance Imaging. Semin Neurol. 2012;32:15–28. doi: 10.1055/s-0032-1306382. [DOI] [PubMed] [Google Scholar]
- Werring DJ, Toosy AT, Clark CA, Parker GJ, Barker G, Miller D, Thompson A. Diffusion tensor imaging can detect and quantify corticospinal tract degeneration after stroke. J Neurol Neurosurg Psychiatry 2000. 2000;69:269–72. doi: 10.1136/jnnp.69.2.269. [DOI] [PMC free article] [PubMed] [Google Scholar]
- Williams LA, Gelman N, Picot PA, Lee DS, Ewing JR, Han VK, Thompson RT. Neonatal brain: regional variability of in vivo MR imaging relaxation rates at 3.0 T – initial experience. Radiology. 2005;235(2):595–603. doi: 10.1148/radiol.2352031769. [DOI] [PubMed] [Google Scholar]
- Wozniak JR, Mueller BA, Chang PN, Muetzel RL, Caros L, Lim KO. Diffusion tensor imaging in children with fetal alcohol spectrum disorders. Alcohol Clin Exp Res. 2006;30(10):1799–1806. doi: 10.1111/j.1530-0277.2006.00213.x. [DOI] [PMC free article] [PubMed] [Google Scholar]
- Wozniak JR, Muetzel RL, Mueller BA, McGee CL, Freerks MA, Ward EE, Nelson ML, Chang PN, Lim KO. Microstructural corpus callosum anomalies in children with prenatal alcohol exposure: an extension of previous diffusion tensor imaging findings. Alc Clin Exp Res. 2009;33(10):1825–35. doi: 10.1111/j.1530-0277.2009.01021.x. [DOI] [PMC free article] [PubMed] [Google Scholar]
- Wozniak JR, Muetzel RL. What Does Diffusion Tensor Imaging Reveal About the Brain and Cognition in Fetal Alcohol Spectrum Disorders? Neuropsychol Rev. 2011;21:133–147. doi: 10.1007/s11065-011-9162-1. [DOI] [PubMed] [Google Scholar]
- Wozniak JR, Mueller BA, Bell CJ, Muetzel RL, Hoecker HL, Nelson ML, Chang PN, Lim KO. Inter-hemispheric functional connectivity disruption in children with prenatal alcohol exposure. Alc Clin Exp Res. 2011;35:849–861. doi: 10.1111/j.1530-0277.2010.01415.x. [DOI] [PMC free article] [PubMed] [Google Scholar]
- Wozniak JR, Mueller BA, Bell CJ, Muetzel RL, Hoecker HL, Boys CJ, Lim KO. Global functional connectivity abnormalities in children with fetal alcohol spectrum disorders. Alc Clin Exp Res. 2013;37(5):748–56. doi: 10.1111/acer.12024. [DOI] [PMC free article] [PubMed] [Google Scholar]
- Wu Q, Butzkueven H, Gresle M, Kirchoff F, Friedhuber A, Yang Q, Wang H, Fang K, Hei H, Egan GF, Kilpatrick TJ. MR diffusion changes correlate with ultra-structurally defined axonal degeneration in murine optic nerve. NeuroImage. 2007;37:1138–1147. doi: 10.1016/j.neuroimage.2007.06.029. [DOI] [PubMed] [Google Scholar]
- Zoeller RT, Butnariu OV, Fletcher DL, Riley EP. Limited postnatal ethanol exposure permanently alters the expression of mRNAS encoding myelin basic protein and myelin-associated glycoprotein in cerebellum. Alc Clin Exp Res. 1994;8:909–916. doi: 10.1111/j.1530-0277.1994.tb00059.x. [DOI] [PubMed] [Google Scholar]
Associated Data
This section collects any data citations, data availability statements, or supplementary materials included in this article.
Supplementary Materials
Fig. A1: Example comparisons of deterministic (A and C) and the novel mini-probabilistic (B and D) tractography. Panels in the top row show reconstructed tracts passing through a single target ROI (orange), with greater extent and volume of output apparent in the mini-probabilistic case (and very few obvious errors). Panels in the bottom row present the comparison of network-wide tracts (R-ASSOC network, AND logic; see main text) with full-probabilistic results (translucent surface). Again, mini-probabilistic tracts show greater volume and extent, with notably few false positives by comparison with full probabilistic tracking.