Abstract
Lung cancer continues to be one the most prevalent and life threatening cancers worldwide. In order to study the gene regulation pattern in lung cancer for new therapeutics discovery, gene expression profiling using human lung cancer tissues was conducted. The gene expression profiles were established using Affymetrix Human Exon 1.0 ST Array with RNA extracts from six clinical patients (five lung cancer samples and one normal control). The raw data were analyzed with Affymetrix Expression Console and Affymetrix Transcriptome Analysis Console 2.0. The regulation of several genes were further validated using real-time reverse transcription quantitative polymerase chain reaction (RT-qPCR). Here we provide detailed experimental methods and analysis for the microarray data, which have been deposited into Gene Expression Omnibus (GEO) under GSE63571.
Experimental Design, Materials and Methods
Tissue samples
Tissue samples from clinical patients were acquired from the Clinical and Translational Science Institute (CTSI) Biorepository at University of Florida, including four subtypes of lung cancer samples (adenocarcinoma, large cell carcinoma, stromal sarcoma, and synovial sarcoma) as well as one normal tissue sample. All the human tissue samples were stored at −80 °C before RNA extraction.
RNA preparation
Total RNA was isolated and purified from 10 mg of frozen tissue samples using Qiagen RNeasy Mini Kit, QIAshredder kit and RNase-Free DNase Set kit (Qiagen, Valencia, CA) following manufacturer’s recommendations. The RNA extracts were first analyzed by Nanodrop 2000 (Thermo Fisher Scientific, Waltham, MA) and gel electrophoresis. RNA quality was determined by the ratios of A260/A280 (close to 2) and A260/A230 (close to 2), and the presence of two distinct ribosomal bands on gel electrophoresis. Qualified RNAs were further tested using Agilent 2100 Bioanalyzer (Agilent Technologies, Santa Clara, CA), and samples with 28S/18S RNA ratio > 1 were selected.1 Six samples (C308, C433, C688, C696, C699, and N687) were finally subjected to the gene microarray test, including five lung cancer samples (C308, C433, C688, C696, C699) and one normal control (N687). Two samples C688 and N687 were from the same patient, others are unmatched samples. The detailed sample information is given in Table 1.
Table 1.
Information of the six RNA samples for gene expression microarray
| Sample ID | Sex | Age | Pathology Status | Histologic Type |
|---|---|---|---|---|
| C308 | Female | 58 | Primary Cancer | Adenocarcinoma, NOS |
| C433 | Male | 50 | Primary Cancer | Large cell carcinoma, NOS |
| C688 | Male | 70 | Primary Cancer | Adenocarcinoma |
| C696 | Female | 66 | Metastatic cancer | Stromal sarcoma, NOS |
| C699 | Male | 31 | Metastatic cancer | Synovial sarcoma, NOS |
| N687 | Male | 70 | Normal | Adenocarcinoma |
Gene expression microarray
200 ng of each RNA sample was processed using Affymetrix GeneChip Whole Transcript (WT) PLUS Reagent Kit. 15 μg of cRNA were input into the second cycle cDNA reaction. 5.5 μg of ss-cDNA were input for fragmentation. Each DNA fragment was end labeled with biotin using terminal deoxynucleotidyl transferase2 before being hybridized to the arrays. Hybridization cocktails containing fragmented, end-labeled cDNA were prepared and applied to GeneChip Human Exon 1.0 ST arrays. Hybridization was performed at 60 rpm for 16 h at 45 °C using the FS450_0001 fluidics protocol. Arrays were scanned using Affymetrix GeneChip Command Console Software (AGCC) to produce .CEL intensity files.
Gene expression analysis
Affymetrix Expression Console was used to process the original .CEL files using HuEx-1_0-st-v2 library file from Affymetrix. The .chp files were generated using the RMA-sketch workflow after signal summarization (Median polish) and data normalization (Sketch-Quantile method). Genome reference consortium GRCh37 and hg19 (Feb. 2009) were used here for analysis (genome.ucsc.edu). Gene level analysis was further conducted with Affymetrix Transcriptome Analysis Console 2.0 software. Both core level gene analysis and extended level gene analysis were conducted. Core level limits analysis to exons that consist of BLAT alignments of mRNA with annotated full-length CDS regions, while extended level also includes transcripts that are defined by exon-level probe sets that map to cDNA alignments and their annotations based on cDNA alignments (see Affymetrix Exon Probeset Annotations and Transcript Cluster Groupings for detailed explanation, http://www.affymetrix.com/support/technical/whitepapers.affx).
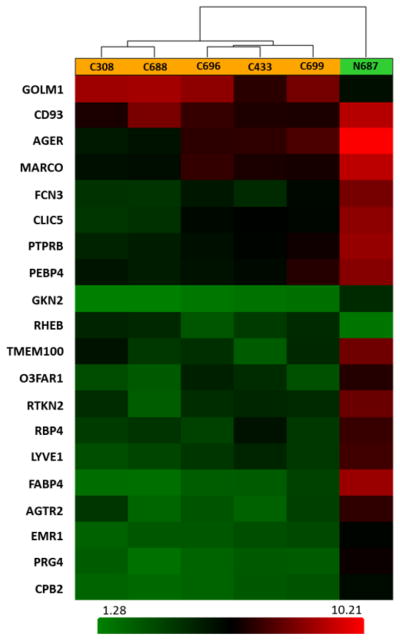
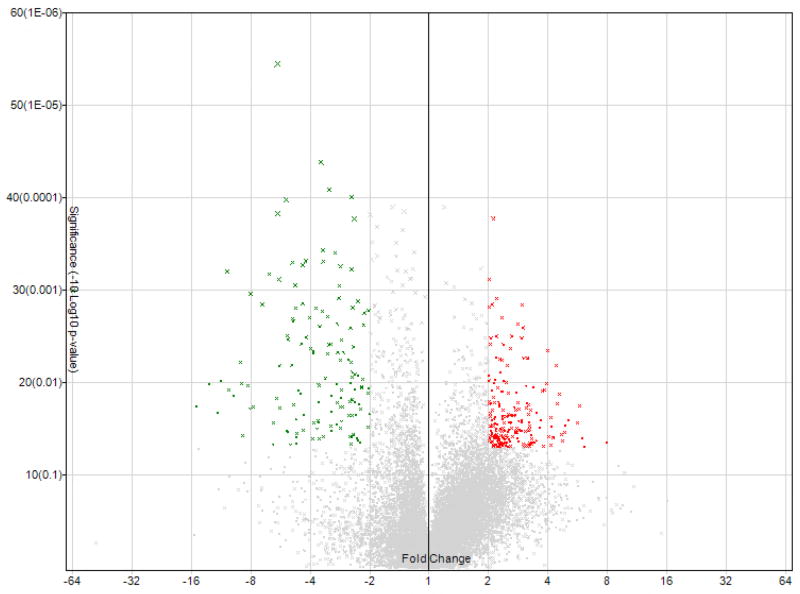
A total of 17,881 genes were tested at core level to compare their expression between two groups of lung cancer and normal control. 345 genes were found to be differentially expressed with absolute fold change > 2 and ANOVA p-value < 0.05 (One-Way Between-Subject ANOVA (unpaired) method).3 According to the algorithm of Affymetrix Transcriptome Analysis Console 2.0, ANOVA was the method to apply here for calculating the p-value (see Transcriptome Analysis Console (TAC) 2.0 user manual, page 128). Volcano plot, representing the distribution of the fold changes and p-values of the above 17,881 genes, is shown in Fig. 1. Furthermore, 20 genes were identified as the most significantly deregulated genes in lung cancer when the cutoff of absolute fold change was increased to 6. The heat map for these 20 genes is displayed in Fig. 2.
Fig. 1.
Volcano plots showing the distribution of gene expression fold changes and p-values. A total number of 17,811 genes in the core gene category were tested. Genes with fold change > 2 and p-value < 0.05 (203 genes) are indicated in red, and genes with fold change < −2 and p-value < 0.05 (142 genes) are indicated in green. Positive fold changes indicate up-regulation compared with normal control, while negative fold changes indicate down-regulation.
Fig. 2.

Heat map showing different expression patterns of 20 top genes with ANOVA p-value < 0.05 and absolute fold change > 6 in lung cancer based on core level gene expression analysis. The heat map indicates up-regulation (red), down-regulation (green), and mean gene expression (black). The columns represent individual tissue samples including five lung cancer samples and one normal control. The rows are labeled with individual gene symbols.
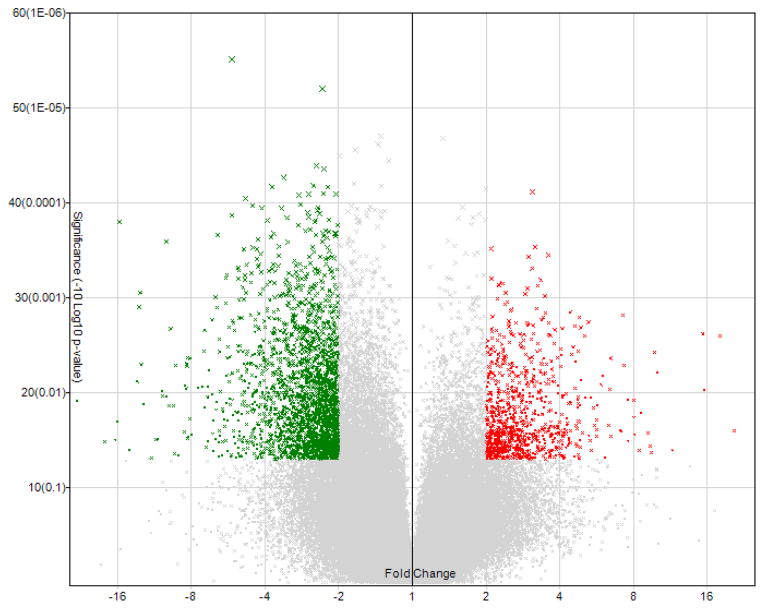
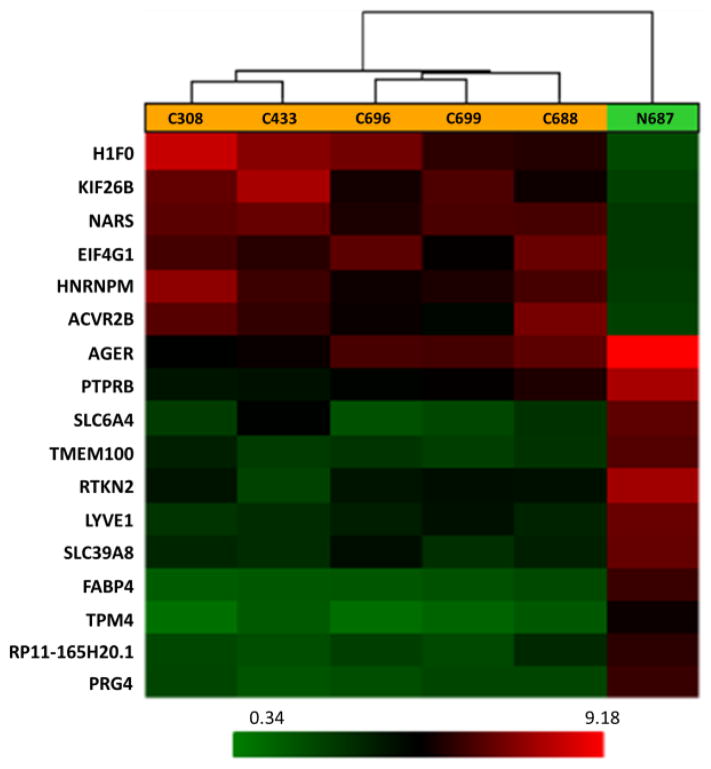
As many as 129,542 genes were analyzed at extended level, and 3,411 genes were found to be differentially expressed with absolute fold change > 2 and p-value < 0.05 compared with normal control (Fig. 3). Adjustment of the absolute fold change cutoff to 8 results in a group of 50 genes. Because the detailed information for some of the genes is not available even using the latest Affymetrix annotation file, only 17 genes with designated gene symbols are included in the heat map in Fig. 4.
Fig. 3.
Volcano plots showing the distribution of gene expression fold changes and p-values. A total of 129,542 genes in the extended gene category were tested. Genes with fold change > 2 and p-value < 0.05 (900 genes) are indicated in red, and genes with fold change < −2 and p-value < 0.05 (2,511 genes) are indicated in green.
Fig. 4.
Heat map showing different expression patterns of 17 top genes with ANOVA p-value < 0.05 and absolute fold change > 8 in lung cancer based on extended level gene expression analysis. The heat map indicates up-regulation (red), down-regulation (green), and mean gene expression (black). The columns represent individual tissue samples including five lung cancer samples and one normal control. The rows are labeled with individual gene symbols.
Real-time RT-qPCR validation
cDNA was generated using SuperScriptR VILO MasterMix (Invitrogen, Grand Island, NY) from the six same RNA extracts as used for gene microarray. All primers required were designed using Primer Premiere 6 software, and purchased from Integrated DNA Technologies (IDT, Coralville, IA). The real-time RT-qPCR reactions were prepared using SYBR® Select Master Mix (Life Technologies, Grand Island, NY), and performed using BioRad CXF96 Real-Time PCR Detection System. The following conditions were used: 95 °C for 2 minutes, 40 cycles of 95 °C for 10 seconds and 60 °C for 1 min. Fold change of gene expression was calculated with the 2−ΔΔCT method,4 using β-actin as the house keeping gene.
Three genes were selected for qPCR validation, including AGER (advanced glycosylation end product-specific receptor), GOLM1 (Golgi membrane protein 1), and NARS (asparaginyl-tRNA synthetase). Consistent with reported results5,6 and gene microarray analysis data (Fig. 2, Fig. 4), the down-regulation of AGER in lung cancer was validated using RT-qPCR (Fig. 5A). GOLM1 has been well documented as a biomarker in prostate cancer with increased expression level.7,8 Both of our microarray (Fig. 2) and qPCR results (Fig. 5B) indicate that GOLM1 is also up-regulated in lung cancer. In accordance with the microarray results (Fig. 4), NARS, one member of the aminoacyl tRNA synthetase family, was also confirmed up-regulated using RT-qPCR (Fig. 5C), suggesting its potential role as a novel biomarker in lung cancer. The role of NARS in lung cancer has not been reported, although there is now accumulating evidence supporting the functions of aminoacyl tRNA synthetases in cancer etiology.9,10 Quantitative and statistical data of RT-qPCR validation is demonstrated in Table 2 using AGER as an example to assess the quality of RT-qPCR experiments.
Fig. 5.

Real-time RT-qPCR validation of expression levels of (A) AGER, (B) GOLM1, and (C) NARS. Fold changes of gene expression were calculated with the 2−ΔΔCT method, using β-actin as the house keeping gene. Results are shown as mean ± SEM from triplicates (n = 3).
Table 2.
Quantitative and statistical assessment of RT-qPCR validation on AGER
| Sample ID | Relative Expression Value ± SEMa |
|---|---|
| C308 | 0.0744 ± 0.00833 |
| C433 | 0.181 ± 0.0212 |
| C688 | 0.177 ± 0.0262 |
| C696 | 0.0603 ± 0.0237 |
| C699 | 0.128 ± 0.0272 |
| N687 | 1 ± 0.227 |
Data are shown as mean ± SEM from triplicates, p-value < 0.05 vs. normal.
Conclusion
The identification of novel prognostic and predictive biomarkers in lung cancer is of great significance.11 Herein we described the study of gene regulation patterns for lung cancer using Affymetrix Human Exon 1.0 ST Array, which led to the discovery of several significantly deregulated genes.
Acknowledgments
This work was supported by grants from UF Interdisciplinary Center for Biotechnology Research (ICBR) Agilent Microarray Program Award to XQ, American Cancer Society Chris DiMarco Institutional Research Grant to XQ and in part by the NIH/NCATS Clinical and Translational Science Award to the University of Florida UL1 TR00064.
Footnotes
Disclosures
The authors declare no conflicts of interest.
Publisher's Disclaimer: This is a PDF file of an unedited manuscript that has been accepted for publication. As a service to our customers we are providing this early version of the manuscript. The manuscript will undergo copyediting, typesetting, and review of the resulting proof before it is published in its final citable form. Please note that during the production process errors may be discovered which could affect the content, and all legal disclaimers that apply to the journal pertain.
References
- 1.Fu J, Allen W, Xia A, Ma Z, Qi X. Identification of biomarkers in breast cancer by gene expression profiling using human tissues. Genomics Data. 2014;2:299–301. doi: 10.1016/j.gdata.2014.09.004. [DOI] [PMC free article] [PubMed] [Google Scholar]
- 2.Michelson AM, Orkin SH. Characterization of the homopolymer tailing reaction catalyzed by terminal deoxynucleotidyl transferase. Implications for the cloning of cDNA. J Biol Chem. 1982;257(24):14773–14782. [PubMed] [Google Scholar]
- 3.Algina J, Olejnik S. Conducting power analyses for ANOVA and ancova in between-subjects designs. Eval Health Prof. 2003;26(3):288–314. doi: 10.1177/0163278703255248. [DOI] [PubMed] [Google Scholar]
- 4.Livak KJ, Schmittgen TD. Analysis of relative gene expression data using real-time quantitative PCR and the 2(−Delta Delta C(T)) method. Methods. 2001;25(4):402–408. doi: 10.1006/meth.2001.1262. [DOI] [PubMed] [Google Scholar]
- 5.Jing R, Cui M, Wang J, Wang H. Receptor for advanced glycation end products (RAGE) soluble form (sRAGE): a new biomarker for lung cancer. Neoplasma. 2010;57(1):55–61. doi: 10.4149/neo_2010_01_055. [DOI] [PubMed] [Google Scholar]
- 6.Jing RR, Wang HM, Jiang SY, Zhang ZQ. Up-regulation of the Receptor for Advanced Glycation End Product (RAGE) in Esophageal Cancer and Down-regulation in Lung Cancer and Their Relationship to Clinicopathological Features. Labmedicine. 2008;39(11):661–667. [Google Scholar]
- 7.Kojima S, Enokida H, Yoshino H, Itesako T, Chiyomaru T, Kinoshita T, Fuse M, Nishikawa R, Goto Y, Naya Y, Nakagawa M, Seki N. The tumor-suppressive microRNA-143/145 cluster inhibits cell migration and invasion by targeting GOLM1 in prostate cancer. J Hum Genet. 2014;59(2):78–87. doi: 10.1038/jhg.2013.121. [DOI] [PubMed] [Google Scholar]
- 8.Varambally S, Laxman B, Mehra R, Cao Q, dhanasekaran s, Tomlins SA, Granger J, Vellaichamy A, Sreekumar A, Yu J, Gu W, Shen R, Ghosh D, Wright LM, Kladney RD, Kuefer R, Rubin MA, Fimmel CJ, Chinnaiyan AM. Golgi protein GOLM1 is a tissue and urine biomarker of prostate cancer. Neoplasia. 2008;10(11):1285–1294. doi: 10.1593/neo.08922. [DOI] [PMC free article] [PubMed] [Google Scholar]
- 9.Kim S, You S, Hwang D. Aminoacyl-tRNA synthetases and tumorigenesis: more than housekeeping. Nat Rev Cancer. 2011;11(10):708–718. doi: 10.1038/nrc3124. [DOI] [PubMed] [Google Scholar]
- 10.Park SG, Schimmel P, Kim S. Aminoacyl tRNA synthetases and their connections to disease. Proc Natl Acad Sci U S A. 2008;105(32):11043–11049. doi: 10.1073/pnas.0802862105. [DOI] [PMC free article] [PubMed] [Google Scholar]
- 11.Thunnissen E, van der Oord K, den Bakker M. Prognostic and predictive biomarkers in lung cancer. A review. Virchows Arch. 2014;464(3):347–358. doi: 10.1007/s00428-014-1535-4. [DOI] [PubMed] [Google Scholar]


