

Abstract
Phase regression exploits the temporal evolution of phase in individual voxels to suppress blood oxygenation level dependent (BOLD) signal fluctuations caused by larger vessels and draining veins while preserving signal changes from microvascular effects. However, this process does not perform well when phase time series have low signal-to-noise ratios because of high levels of physiological noise. We demonstrate that Savitzky-Golay filters may be used to recover the underlying change in phase and completely restore the efficacy of phase regression. We do not make a priori assumptions regarding phase evolution and perform a data-driven exploration of parameter space to select the Savitzky-Golay filter parameters that minimize temporal variance in each voxel after phase regression. This approach is shown to work well on data acquired with single-shot and multi-shot pulse sequences, and should therefore be useful for both human and animal gradient-echo fMRI at high spatial resolutions at high fields. The ability to improve the spatial specificity of BOLD activation may be especially advantageous for clinical applications of fMRI that rely upon the accuracy of individual subject's activation maps to assist with presurgical planning and clinical decision-making. Enhanced phase regression with Savitzky-Golay filtering may also find other uses in analyses of resting state functional connectivity.
Keywords: functional magnetic resonance imaging (fMRI), blood oxygenation level dependent (BOLD) contrast, phase regression, 7 Tesla, high resolution imaging, Savitzky-Golay filtering
Introduction
Functional magnetic resonance imaging (fMRI) based upon blood oxygenation level dependent (BOLD) contrast (Ogawa et al., 1990b) remains the primary technique for non-invasive investigation of human brain function (Kwong et al., 1992; Ogawa et al., 1992; Bandettini et al., 1992). Although the majority of fMRI is still conducted at 1.5T or 3T, the greater-than-linear increase in BOLD contrast with increasing magnetic field strength (Ogawa et al., 1993; Gati et al., 1997) has been a clear impetus for the steady increase in ultra-high-field (≥ 7T) sites worldwide (Uğurbil, 2012). The order-of-magnitude increase in BOLD sensitivity at high fields can be exploited for functional imaging at higher spatial resolutions (ranging from 1-3 cubic millimeters, e.g., Menon and Goodyear, 1999; Yacoub et al., 2001; Polimeni et al., 2010; Stringer et al., 2011) down to less than a cubic millimeter (e.g., Harel et al., 2006; Koopmans et al., 2011; Petridou et al., 2013) to reduce partial volume averaging effects and improve the specificity of activation and functional connectivity maps. However, gradient-echo acquisitions are also sensitive to large vessels and draining veins (Ogawa et al., 1990a) that can be several millimeters away from the primary site of neural activation (Turner, 2002). Such degradation in spatial specificity is obviously undesirable, and efforts have been made in both acquisition and post-processing methods to improve sensitivity and specificity to signal changes in gray matter. Spin-echo fMRI is known to be relatively more specific to BOLD changes in the parenchyma (e.g., Duong et al., 2003; Zhao et al., 2004), but technical challenges and physiological limitations of spin-echo imaging at ultra-high fields, such as achieving spatially uniform 180° pulses (Vaughan et al., 2001) and adhering to safety limits of specific absorption rate (SAR) in the brain (ICNIRP, 1998), currently accounts for the use of T2*-weighted gradient-echo sequences for routine fMRI at 7T.
Although MR data are inherently complex, phase information is irrecoverably discarded in the vast majority of fMRI studies despite the well-known fact that phase contains unique and useful information. Phase time series have been characterized (Rowe 2005; Rowe et al., 2007), and several groups have investigated the use of complex data to construct or improve activation maps (Lai & Glover, 1997; Nan & Nowak, 1999; Rowe & Logan, 2004; Hahn et al., 2009, 2012). In fact, activation can be detected directly from k-space (Rowe et al., 2009). The unique information in the phase time series can also be exploited to suppress BOLD signal fluctuations from large vessels and draining veins (Menon, 2002; Nencka & Rowe, 2007), thereby increasing the spatial specificity of BOLD activation. The algorithm proposed by Menon (2002) is referred to as phase regression, and has since found additional uses to mitigate false positive activations (Martin et al., 2004; Barry et al. 2010) and increase activation map reproducibility (Barry et al., 2012).
With respect to its original utility of suppressing BOLD signal fluctuations originating from voxels containing large vessels or draining veins, phase regression (PR) was originally applied to 4T data and shown to work well when the phase time series exhibits high signal-to-noise ratio (SNR). However, our experience with PR on 7T data acquired using both 2D single-shot echo-planar imaging (EPI) (Mansfield, 1977; Mansfield et al., 1994) and 3D multi-shot sequences such as fast field echo (FFE) (van der Meulen et al., 1985, 1988; Barry et al., 2011; Swisher et al., 2012) and PRESTO (PRinciples of Echo-Shifting with a Train of Observations) (Liu et al., 1993; Golay et al., 2000; Neggers et al., 2008; Barry et al., 2011; Swisher et al., 2012) has uncovered many instances in which the stability of the phase time series is insufficient to obtain adequate suppression of many large vessels.
Numerous studies have investigated and quantified the manifestation and/or obviation of physiological noise in the magnitude time series of fMRI data (e.g., Krüger & Glover, 2001; Triantafyllou et al., 2005; Bodurka et al., 2007; Murphy et al., 2007; Gonzalez-Castillo et al., 2011) but only recently has the impact and mitigation of physiological noise on phase time series been explored (e.g., Hagberg et al., 2008; Petridou et al., 2009; Hagberg et al., 2012). Hagberg et al. (2008) considered three models to account for variance in the time series of phase images. The first model assumes that physiological noise is negligible and thus MR data are only contaminated by thermal noise. The standard deviation of the phase time series (tSDφ) in model I is therefore expressed as where SNR0 the SNR of a magnitude image. In other words, if physiological noise did not exist (and MR images contained only thermal noise), then resting state functional images with a high image SNR0 = 100 would contain individual voxels exhibiting an approximate 1/100 = 0.01 = 1% fluctuation in either the magnitude or phase time series. However, numerous studies have established that this model is not appropriate for in vivo noise measurements, and thus a scaling factor must be introduced to account for the increase in temporal variance due to physiological noise (e.g., Krüger & Glover, 2001; Triantafyllou et al., 2005). The second (more realistic) model accounts for the impact of physiological noise and introduces the scaling factor λ, to represent increased temporal variance. In model II the expression is expanded to where λ, is calculated from magnitude time series and assumed to be the same for phase time series. Finally, the third model extends model II by permitting the scaling factor to be different between phase and magnitude images, resulting in the expression . The intriguing possibility that λφ > λ, directly implies that certain physiological processes can lead to increased instability in phase but not magnitude images. Hagberg et al. (2008) tested these three models and found strong evidence to support model III (i.e., λφ ≫ λ) regardless of the method used to unwrap phase images. In gray matter at 3T, Hagberg et al. (2008) measured λφ ≈ 13* λ for temporal phase unwrapping and λφ ≈ 6* λ for spatiotemporal phase unwrapping. If we assume a linear relationship between main field strength and temporal phase instabilities, then λφ for gray matter at 7T may lie between 14* λ and 30* λ – and possibly higher if this scaling is greater-than-linear or phase unwrapping is particularly challenging (e.g., in regions of high susceptibility near the auditory canals and sinuses). Furthermore, several studies have concluded that these additional phase instabilities are dominated by global field fluctuations resulting from normal subject respiration (Hagberg et al., 2008; Petridou et al., 2009; Hagberg et al., 2012).
Figure 1 presents an example of a 7T complex time series with high magnitude SNR but low phase SNR. The low-SNR phase time series is shown as the blue curve in Fig. 1D, and its use in PR without filtering results in incomplete vessel suppression (blue curve in Fig. 1E). The underlying modulation of phase due to BOLD signal changes is, however, still obvious upon visual inspection, and may be recovered with an appropriate low-pass filter. Thus, we aimed to investigate the use of Savitzky-Golay filters (Savitzky & Golay, 1964) to recover the underlying change in phase (e.g., red curve in Fig. 1D) and enhance the efficacy of PR (red curve in Fig. 1E). Savitzky-Golay filters were selected for this particular application because they are robust filters that have been used in a wide range of signal processing applications from forensics (Schneider & Kovar, 2003) to fMRI (Geissler et al., 2007) to neurogastroenterology (Paskaranandavadivel et al., 2013). As temporal variance in both magnitude and phase time series is dependent upon factors such as acquisition strategy and spatial resolution, we validate the robustness of enhanced PR using 7T data from 88 functional runs across 11 subjects acquired with four different pulse sequences at two in-plane (and temporal) resolutions.
Figure 1.
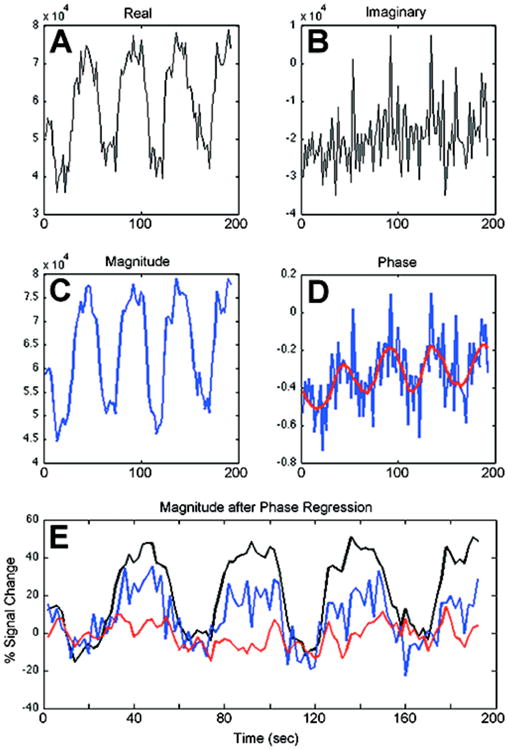
Time series for a single voxel containing a vein. The (A) real and (B) imaginary time series add in quadrature to form the (C) magnitude. In (D) the blue curve is the noisy, unfiltered phase time series and the red curve is this phase time series after Savitzky-Golay filtering. In (E) the magnitude curve before phase regression exhibits a 38.8% signal change relative to baseline. The blue curve is the magnitude after phase regression using the unfiltered time series; the BOLD signal change is partially suppressed, but still exhibits a 16.8% signal change. Finally, the red curve is the magnitude after Savitzky-Golay filtered phase regression and exhibits complete suppression with a -0.55% BOLD signal change.
Methods
Data Acquisition
Imaging data were acquired with a Philips Achieva 7T scanner with a quadrature transmit coil and 16-channel receive-only head coil (Nova Medical, Wilmington, MA). A detailed description of data acquisition has been published (Barry et al., 2011). In brief, twelve healthy volunteers were studied under a protocol approved by the Vanderbilt University Institutional Review Board. Data from one subject was not included in the current analyses due to inconsistent performance across all runs. The visual paradigm was a block design with four alternating segments of 24 sec baseline (central fixation) and 24 sec activation (stationary 8 Hz flashing checkerboard wedge in the left visual field). Twelve 2-mm slices were planned parallel to the calcarine sulcus with the shim volume situated over the occipital lobe. Eight functional runs were acquired while cycling through four sequences (2D EPI with 2.83 mm3 voxels, 2D EPI with 9.59 mm3 voxels, 3D FFE with 2.83 mm3 voxels, and 3D PRESTO with 9.59 mm3 voxels) in pseudo-random order. A T1-weighted anatomical volume (1.19 × 1.19 × 2 mm3 voxels, acquisition time = 51.1 sec) with identical placement as the functional runs was also acquired to facilitate accurate registration between anatomic and functional images.
Data Preprocessing
Data workflow was handled using software written in Matlab (MathWorks, Natick, MA), and preprocessing steps were implemented using scripts in Matlab and AFNI (Cox, 1996). Where appropriate, function names and parameters are listed in parentheses for easy reference. Physiological noise correction via RETROICOR (Glover et al., 2000) ( afni_proc.py in AFNI using despike and –ricor_polort 4) was applied to each run before PR. The order of these preprocessing steps was reversed from our previous work (Barry et al., 2012) to minimize physiological fluctuations in magnitude images as much as possible before PR, thereby focusing this study on the efficacy of vessel suppression; RETROICOR is, however, performed on magnitude images, so unwrapped phase images were saved separately before RETROICOR and then used to reconstruct complex images afterwards.
Functional data were then processed using either standard PR (without phase filtering) or “enhanced” PR with Savitzky-Golay filtering (SGF). SGF ( sgolayfilt in Matlab) requires two parameters to be specified (frame size, N, and polynomial order, p). Selecting a smaller frame size (or window) with higher-order polynomials will perform less smoothing whereas larger windows with lower-order polynomials will output a more smoothed signal. The optimal values for N and p are unknown and vary from one voxel to the next, so we implemented an exploratory implementation of SGF that considered many possible combinations of polynomial order and frame size (117 for EPI and FFE, and 486 for PRESTO) for every voxel. Our intent was not to perform an exhaustive search through all possible combinations of N and p but rather to explore a large subset of the parameter space to find a combination that is optimal or close to optimal. We define ‘optimal’ as the combination of N and p that minimizes the temporal variance of the magnitude time series and thus produces the highest R2 (where the goodness of fit metric R2 = 1 – σPR/σorig where σorig denotes temporal standard deviation of a voxel before processing and σPR denotes the temporal standard deviation of the same voxel after PR). For EPI and FFE data (with 96 time points), we considered 11 values of p (2, 3, 4, …, 11, 12) and up to 12 values of N (5, 9, 13, …, 45, 49) with the condition that N > p. For PRESTO data (with 192 time points because improved temporal efficiency via echo shifting doubles the sampling rate), we considered 23 values of p (2, 3, 4, …, 23, 24) and up to 24 values of N (5, 9, 13, …, 93, 97) with N > p. The effective use of phase regression is based upon an assumption that BOLD-related phase changes in gray matter voxels are small relative to physiological noise in the phase time series, which is an important point that is reviewed in detail in the Discussion.
Phase time course SNR will vary naturally from one voxel to the next – a few voxels may have sufficiently high phase SNR and not require filtering before PR whereas the vast majority of voxels (per Fig. 2) are expected to benefit from exploratory Savitzky-Golay filtering. It may be possible to estimate this phase SNR threshold (that determines whether or not filtering is required) a priori through simulations, although the reliability of this result would be dependent upon the accuracy of the simulations while considering numerous complex factors (spatial resolution, rigid-body motion, partial volume effects, etc.) and thus may be highly suspect. We therefore propose a simple and effective 3-step implementation of PR with SGF. For each voxel: (1) standard PR is performed with the unwrapped but not temporally filtered phase time course and is calculated; (2) PR with data-driven filtering is performed for all 117 (or 486 for PRESTO) combinations of N and p, and the highest R2 across combinations is selected to be ; (3) if then the resultant time series after standard PR is retained, otherwise the time series after PR with filtering (using the N and p that produced ) is retained. Thus, the ‘enhancement’ reflects the option of using the filtered phase time course in the regression whenever it is shown to produce a better fit to the magnitude time series. This approach obviates the need for complex simulations to estimate a phase SNR threshold and is effective because it provides the best possible fit both when phase SNR is high (and thus filtering may not be required) and when phase SNR is low (and thus filtering is required).
Figure 2.
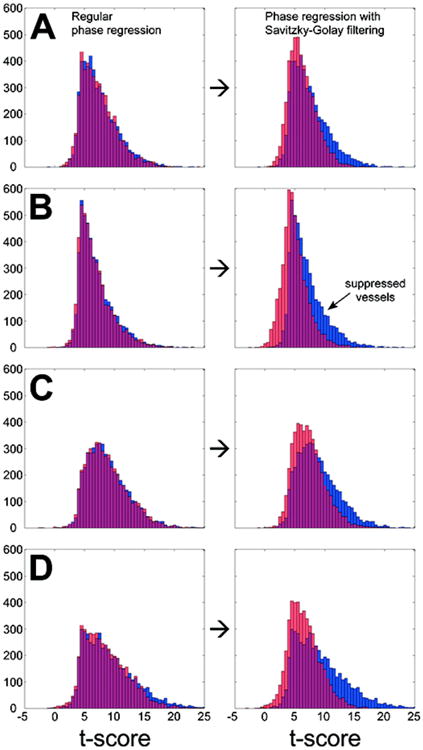
Histograms of t-scores for 4971 voxels from 11 subjects before (in blue) and after (in pink) phase regression without filtering (left column) and with Savitzky-Golay filtering (right column) for data acquired with (A) high-resolution EPI (2.83 mm3 voxels), (B) high-resolution FFE (2.83 mm3 voxels), (C) lower resolution EPI (9.59 mm3 voxels), and (D) lower resolution PRESTO (9.59 mm3 voxels). The overlapping region between pairs of histograms is represented in magenta. Although standard phase regression does suppress some higher t-scores that are indicative of vessels, Savitzky-Golay filtering suppresses the majority of voxels with t > 10 (more likely vessels) while preserving most voxels with t < 8 (more likely gray matter).
For each subject, resultant functional data were registered ( 3dAllineate) to the skull-stripped ( 3dAutomask) anatomical with six degrees of freedom (in-plane translation, rotation, scaling, and shearing). For lower resolution functional data, this step included resampling to the resolution of the anatomical images. To ensure accurate registration between anatomic and functional images (which can be challenging at any field strength but especially so at higher fields), a spatial weighting function was constructed (and then passed to 3dAllineate) to emphasize the unique anatomic features of each subject's occipital pole and guide the registration algorithm. This weighting function was constructed by aligning (for each posterior-anterior column of each slice) 1D exponential decay curves with a maximal value of ‘1’ at the edge of the occipital pole that quickly decayed to zero toward anterior regions. The accuracy of each registration was visually and carefully verified using MRIcron (www.mccauslandcenter.sc.edu/mricro/mricron). Spatial smoothing was not applied to maintain the highest resolution possible and facilitate single-subject analyses with respect to interpretation of BOLD signal changes in larger veins and gray matter.
Data Analysis
Twelve activation maps were computed for each subject – one for data acquired with each of the four pulse sequences for each of the three preprocessing pipelines (no PR, standard PR, and PR with SGF). Linear and quadratic drifts were removed from all functional runs before pairs of runs (for each acquisition/preprocessing permutation) were combined in deconvolution analyses ( 3dDeconvolve) with autoregressive moving average, i.e., ARMA(1,1), correction for temporally correlated noise ( 3dREMLfit). To protect against consideration of false positive activations, only voxels with t > 4 across all four acquisition sequences (without or with either implementation of PR) were considered in the histogram analyses described below (Fig. 2).
Results
Figure 2 displays t-score histograms for voxels exhibiting consistent activation before and after PR. Each histogram contains 4971 t-scores representing active voxels from all 11 subjects (with a median contribution of 492 voxels per subject). For each acquisition sequence (row), the left column represents standard PR (without filtering the phase) and the right column represents PR with per-voxel optimal implementation of SGF. Several authors have observed that the largest signal changes in BOLD fMRI can occur around larger vessels and draining veins (e.g., Gati et al., 1997; Yacoub et al., 2005; Harel et al., 2006), and so it follows that voxels containing larger vessels may also tend to have the highest t-scores. We therefore consider voxels with the top 20% of t-scores before PR as a proxy for the expected efficacy of PR to suppress BOLD signal changes caused by larger vessels. Percentages of suppressed high t-score voxels are calculated as ratios of reduction in histogram counts after PR to histogram counts before PR. For high-resolution EPI (Fig. 2A), standard PR suppresses 8.56% of high t-score voxels and PR with SGF suppresses 63.0%; for FFE (Fig. 2B) it is 10.1% vs. 73.2%, for low-resolution EPI (Fig. 2C) it is 1.38% vs. 62.8%, and for PRESTO (Fig. 2D) it is 24.6% vs. 85.0%.
To visualize how PR without and with SGF affects single-subject activation maps, Fig. 3 presents statistical parametric maps for each acquisition sequence (row) using data from four different subjects. The far left column displays the underlying anatomy and the other labeled columns overlay the statistical parametric maps at appropriate thresholds. Regions of completely suppressed activation (indicated with arrows in the far right column) are located within sulci (where veins lie) and regions of remaining activation tend to be more localized to surrounding gray matter. Furthermore, active regions completely suppressed after PR with SGF are, if at all, only partial suppressed with standard PR, which highlights the benefit of filtering the phase before regression. We note that the main region of ‘surviving’ activation in Fig. 3C expands across both gray matter and a sulcus, which is likely attributable to partial volume averaging effects from the lower resolution acquisition.
Figure 3.
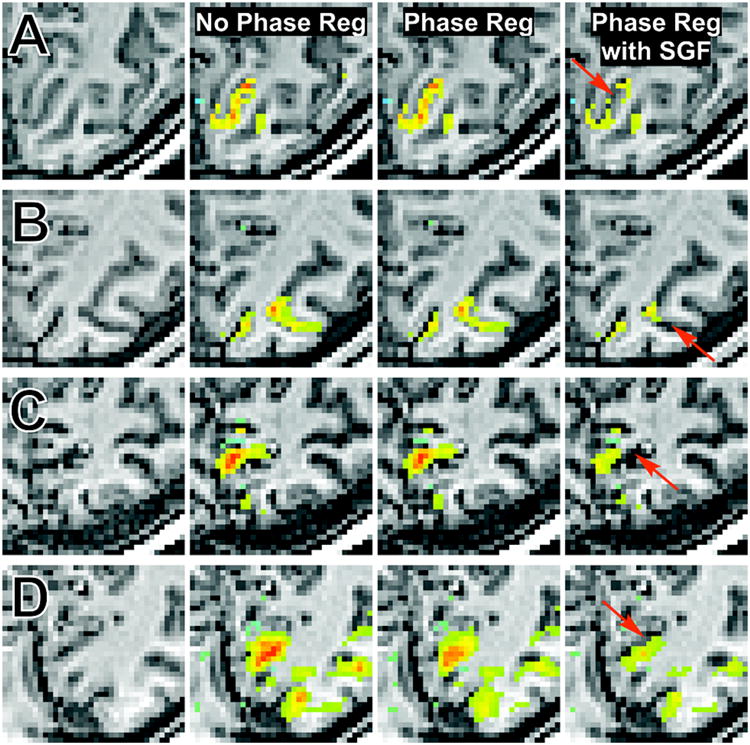
Statistical parametric maps for four subjects constructed from data acquired with (A) high-resolution EPI (t > 5), (B) FFE (t > 4), (C) lower resolution EPI (t > 5), and (D) PRESTO (t > 6). The far left column displays the underlying anatomy and the adjacent columns present activation maps without phase regression, after standard phase regression, and after phase regression with Savitzky-Golay filtering. Arrows identify regions that are only partially suppressed after phase regression but completely suppressed after phase regression with Savitzky-Golay filtering.
Discussion
Phase regression suppresses BOLD signal changes caused by large vessels and draining veins in high-resolution gradient-echo data, thereby selectively emphasizing signal changes from microvascular activation (Menon, 2002). However, standard PR at 7T does not work well when the phase time series exhibits low SNR (e.g., Fig. 1D) due to an increase in physiological noise (Hagberg et al., 2008; Petridou et al., 2009; Hagberg et al., 2012). We have demonstrated that the underlying modulation of phase can be recovered via Savitzky-Golay filtering, thus restoring the ability to suppress unwanted signal changes caused by large vessels and draining veins. We do not make a priori assumptions regarding the evolution of phase in any voxel because it can be modulated by both ΔR2* and spatiotemporally varying B0 inhomogeneities (Barry et al., 2010). We therefore adopt an aggressive data-driven approach to identify the SGF parameters that minimize temporal variance (i.e., noise) for each voxel. In this context, ‘noise’ refers to any modulation of phase with a physiologic origin, be it BOLD fluctuations or respiration. Our implementation of PR with SGF preserves signal changes in the majority of voxels with lower t-scores (Fig. 2, right column), which is what we hypothesized to observe because gray matter tends to have smaller magnitude signal changes (Gati et al., 1997; Yacoub et al., 2005; Harel et al., 2006) and negligible BOLD-related phase changes (Menon, 2002).
It is theoretically possible that PR may not attenuate BOLD signal changes in voxels with a vein at the magic angle (approximately 54.7 degrees). Menon (2002) investigated this potential confound by examining the BOLD signal change in 2868 voxels with a phase fitting parameter (A) that was not significantly different from zero (and thus could represent gray matter or veins orientated at the magic angle). Based upon the argument that vessels typically have high percent signal changes and the observation that a subset of these 2868 voxels residing within the brain exhibited relatively low magnitude BOLD changes, Menon reasoned that this subset most likely represented microvascular structures and concluded that the potential problem of not suppressing vessels at the magic angle is, in practice, minimal (Menon, 2002; p. 6). Indeed, we qualitatively examined activation maps from each subject before and after PR with SGF and did not observe any obvious veins that were not at least partially attenuated after phase regression.
Further consideration of the histograms reveals that high-resolution data (Fig. 2, top two rows) have slightly higher peaks and most suppressed voxels are redistributed to the left of this peak (where t < ∼6). In comparison, lower-resolution data (Fig. 2, bottom two rows) exhibit broader peaks and suppressed voxels are redistributed to a wider range of t-values (< ∼8). This pronounced incomplete vessel suppression for both lower spatial resolution acquisitions is due to increased partial volume averaging that dilutes or otherwise distorts the phase time series of a large vessel with phase time series of surrounding gray matter, white matter and/or cerebrospinal fluid. The partial volume averaging effects are also evident in the activation maps. In the higher resolution acquisitions (Figs. 3A and 3B), activation after PR with SGF neatly follows the cortical ribbon whereas in lower resolution acquisitions (Figs. 3C and 3D) the activation is, as to be expected, more diffuse; however, the spatial specificity of lower resolution activation maps is still noticeably improved after PR with SGF.
Recent work by Feng et al. (2009) and Zhao et al. (2007) is relevant to the application of PR at high fields because they explore the possibility that gray matter voxels may exhibit small but non-zero BOLD-related phase changes. Feng et al. (2009) reported a maximum BOLD-related phase change of 0.017 radians in gray matter at 3T. Similarly, Menon (2002) observed a phase change of 0.03 radians in a voxel without an obvious vein at 4T, which was five times smaller than the phase change from an adjacent voxel containing a visible vessel. Although such small phase changes reflect a theoretical confound given sufficiently high SNR, they seem unlikely to represent a significant confound in practice due to the high level of physiological noise expected in phase time series. If we assume high functional image SNR of SNR0 = 100, λ, = 0.01 at 7T (Triantafyllou et al., 2005), and a conservative estimate that λφ =10* λ = 0.1 (Hagberg et al., 2008), then , , and . Thus, the expected temporal standard deviation of the phase time course (due to physiological noise) may be 3-6 times higher than the maximum BOLD phase change in a gray matter voxel at 3T or 4T (0.10 vs. 0.02-0.03). Even if the maximum BOLD phase change in gray matter increases up to 0.05 radians, this is still a factor of two below the expected noise level in the phase time series. Therefore, although small BOLD phase changes in predominantly gray matter voxels are theoretically possible (Zhao et al., 2007; Feng et al., 2009) and have indeed been observed in humans in vivo (Menon, 2002; Feng et al., 2009), such phase changes seem unlikely to be a widespread confound in practice because they should be smaller than the temporal phase variance due to physiological noise by at least a factor or two and as much as an order of magnitude. However, future work at even higher fields (9.4T+) in both humans and animals should continue to investigate this potential confound in vivo – especially with improved phase unwrapping techniques (Hagberg et al., 2008) and other methods to mitigate sources of variance in phase time series (e.g., Petridou et al., 2009; Hagberg et al., 2012) that cause λφ → λ, and thus .
In summary, we have identified that increased physiological noise at ultra-high fields can significantly impede the efficacy of vessel suppression via phase regression, but that this efficacy can be restored after low-pass filtering the phase time series with a Savitzky-Golay filter. We make no a priori assumptions regarding the evolution of phase and for each voxel perform a data-driven exploration of parameter space to select the two filter parameters that minimize temporal variance after PR. We demonstrate that PR with SGF works on fMRI data acquired with single-shot and multi-shot pulse sequences at two resolutions (2.83 mm3 and 9.59 mm3 voxels), which shows that this technique is robust, does not necessitate a specific pulse sequence to be effective, and can be retroactively applied to previously acquired complex data. Enhanced PR should therefore be useful for both human and animal gradient-echo fMRI at high spatial resolutions, and especially in applications where standard PR did not perform as expected (Barry et al., 2013). The ability to improve the spatial specificity of BOLD activation (as shown in Fig. 3) may be especially advantageous for clinical investigations that rely upon the accuracy of individual subject's activation maps to assist with presurgical planning (Sunaert, 2006) and clinical decision-making (Bartsch et al., 2006). Finally, phase regression may also find new applications in analyses of functional connectivity, which is an intriguing avenue that has only begun to be explored (Curtis et al., 2013).
Acknowledgments
This research was supported by NIH grant 5R01EB000461.
References
- Bandettini PA, Wong EC, Hinks RS, Tikofsky RS, Hyde JS. Time course EPI of human brain function during task activation. Magn Reson Med. 1992;25:390–397. doi: 10.1002/mrm.1910250220. [DOI] [PubMed] [Google Scholar]
- Barry RL, Coaster M, Rogers BP, Newton AT, Moore J, Anderson AW, Zald DH, Gore JC. On the origins of signal variance in FMRI of the human midbrain at high field. PLoS One. 2013;8:e62708. doi: 10.1371/journal.pone.0062708. [DOI] [PMC free article] [PubMed] [Google Scholar]
- Barry RL, Strother SC, Gatenby JC, Gore JC. Data-driven optimization and evaluation of 2D EPI and 3D PRESTO for BOLD fMRI at 7 Tesla: I. Focal coverage. Neuroimage. 2011;55:1034–1043. doi: 10.1016/j.neuroimage.2010.12.086. [DOI] [PMC free article] [PubMed] [Google Scholar]
- Barry RL, Strother SC, Gore JC. Complex and magnitude-only preprocessing of 2D and 3D BOLD fMRI data at 7 T. Magn Reson Med. 2012;67:867–871. doi: 10.1002/mrm.23072. [DOI] [PMC free article] [PubMed] [Google Scholar]
- Barry RL, Williams JM, Klassen LM, Gallivan JP, Culham JC, Menon RS. Evaluation of preprocessing steps to compensate for magnetic field distortions due to body movements in BOLD fMRI. Magn Reson Imaging. 2010;28:235–244. doi: 10.1016/j.mri.2009.07.005. [DOI] [PMC free article] [PubMed] [Google Scholar]
- Bartsch AJ, Homola G, Biller A, Solymosi L, Bendszus M. Diagnostic functional MRI: Illustrated clinical applications and decision-making. J Magn Reson Imaging. 2006;23:921–932. doi: 10.1002/jmri.20579. [DOI] [PubMed] [Google Scholar]
- Bodurka J, Ye F, Petridou N, Murphy K, Bandettini PA. Mapping the MRI voxel volume in which thermal noise matches physiological noise — implications for fMRI. Neuroimage. 2007;34:542–549. doi: 10.1016/j.neuroimage.2006.09.039. [DOI] [PMC free article] [PubMed] [Google Scholar]
- Cox RW. AFNI: software for analysis and visualization of functional magnetic resonance neuroimages. Comput Biomed Res. 1996;29:162–173. doi: 10.1006/cbmr.1996.0014. [DOI] [PubMed] [Google Scholar]
- Curtis AT, Hutchison RM, Menon RS. Venous suppression in resting state fMRI: implications for correlation analysis. Proc Int Soc Magn Reson Med. 2013;21:2231. [Google Scholar]
- Duong TQ, Yacoub E, Adriany G, Hu X, Uğurbil K, Kim SG. Microvascular BOLD contribution at 4 and 7 T in the human brain: gradient-echo and spin-echo fMRI with suppression of blood effects. Magn Reson Med. 2003;49:1019–1027. doi: 10.1002/mrm.10472. [DOI] [PubMed] [Google Scholar]
- Feng Z, Caprihan A, Blagoev KB, Calhoun VD. Biophysical modeling of phase changes in BOLD fMRI. Neuroimage. 2009;47:540–548. doi: 10.1016/j.neuroimage.2009.04.076. [DOI] [PMC free article] [PubMed] [Google Scholar]
- Gati JS, Menon RS, Uğurbil K, Rutt BK. Experimental determination of the BOLD field strength dependence in vessels and tissue. Magn Reson Med. 1997;38:296–302. doi: 10.1002/mrm.1910380220. [DOI] [PubMed] [Google Scholar]
- Geissler A, Gartus A, Foki T, Tahamtan AR, Beisteiner R, Barth M. Contrast-to-noise ratio (CNR) as a quality parameter in fMRI. J Magn Reson Imaging. 2007;25:1263–1270. doi: 10.1002/jmri.20935. [DOI] [PubMed] [Google Scholar]
- Glover GH, Li TQ, Ress D. Image-based method for retrospective correction of physiological motion effects in fMRI: RETROICOR. Magn Reson Med. 2000;44:162–167. doi: 10.1002/1522-2594(200007)44:1<162::aid-mrm23>3.0.co;2-e. [DOI] [PubMed] [Google Scholar]
- Golay X, Pruessmann KP, Weiger M, Crelier GR, Folkers PJM, Kollias SS, Boesiger P. PRESTO-SENSE: an ultrafast whole-brain fMRI technique. Magn Reson Med. 2000;43:779–786. doi: 10.1002/1522-2594(200006)43:6<779::aid-mrm1>3.0.co;2-4. [DOI] [PubMed] [Google Scholar]
- Gonzalez-Castillo J, Roopchansingh V, Bandettini PA, Bodurka J. Physiological noise effects on the flip angle selection in BOLD fMRI. Neuroimage. 2011;54:2764–2778. doi: 10.1016/j.neuroimage.2010.11.020. [DOI] [PMC free article] [PubMed] [Google Scholar]
- Hagberg GE, Bianciardi M, Brainovich V, Cassarà AM, Maraviglia B. The effect of physiological noise in phase functional magnetic resonance imaging: from blood oxygen level-dependent effects to direct detection of neuronal currents. Magn Reson Imaging. 2008;26:1026–1040. doi: 10.1016/j.mri.2008.01.010. [DOI] [PubMed] [Google Scholar]
- Hagberg GE, Bianciardi M, Brainovich V, Cassara AM, Maraviglia B. Phase stability in fMRI time series: effect of noise regression, off-resonance correction and spatial filtering techniques. Neuroimage. 2012;59:3748–3761. doi: 10.1016/j.neuroimage.2011.10.095. [DOI] [PubMed] [Google Scholar]
- Hahn AD, Nencka AS, Rowe DB. Improving robustness and reliability of phase-sensitive fMRI analysis using temporal off-resonance alignment of single-echo timeseries (TOAST) Neuroimage. 2009;44:742–752. doi: 10.1016/j.neuroimage.2008.10.001. [DOI] [PMC free article] [PubMed] [Google Scholar]
- Hahn AD, Nencka AS, Rowe DB. Enhancing the utility of complex-valued functional magnetic resonance imaging detection of neurobiological processes through postacquisition estimation and correction of dynamic B0 errors and motion. Hum Brain Mapp. 2012;33:288–306. doi: 10.1002/hbm.21217. [DOI] [PMC free article] [PubMed] [Google Scholar]
- Harel N, Lin J, Moeller S, Ugurbil K, Yacoub E. Combined imaging-histological study of cortical laminar specificity of fMRI signals. Neuroimage. 2006;29:879–887. doi: 10.1016/j.neuroimage.2005.08.016. [DOI] [PubMed] [Google Scholar]
- International commission on non-ionizing radiation protection (ICNIRP) Guidelines for limiting exposure to time-varying electric, magnetic and electromagnetic fields (up to 300 GHz) Health Phys. 1998;74:494–522. [PubMed] [Google Scholar]
- Koopmans PJ, Barth M, Orzada S, Norris DG. Multi-echo fMRI of the cortical laminae in humans at 7 T. Neuroimage. 2011;56:1276–1285. doi: 10.1016/j.neuroimage.2011.02.042. [DOI] [PubMed] [Google Scholar]
- Krüger G, Glover GH. Physiological noise in oxygen-sensitive magnetic resonance imaging. Magn Reson Med. 2001;46:631–637. doi: 10.1002/mrm.1240. [DOI] [PubMed] [Google Scholar]
- Kwong KK, Belliveau JW, Chesler DA, Goldberg IE, Weisskoff RM, Poncelet BP, Kennedy DN, Hoppel BE, Cohen MS, Turner R, Cheng HM, Brady TJ, Rosen BR. Dynamic magnetic resonance imaging of human brain activity during primary sensory stimulation. Proc Natl Acad Sci USA. 1992;89:5675–5679. doi: 10.1073/pnas.89.12.5675. [DOI] [PMC free article] [PubMed] [Google Scholar]
- Lai S, Glover GH. Detection of BOLD fMRI signals using complex data. Proc Int Soc Magn Reson Med. 1997;5:1671. [Google Scholar]
- Liu G, Sobering G, Duyn J, Moonen CTW. A functional MRI technique combining principles of echo-shifting with a train of observations (PRESTO) Magn Reson Med. 1993;30:764–768. doi: 10.1002/mrm.1910300617. [DOI] [PubMed] [Google Scholar]
- Mansfield P. Multi-planar image formation using NMR spin echoes. J Phys C: Solid State Phys. 1977;10:L55–L58. [Google Scholar]
- Mansfield P, Coxon R, Glover P. Echo-planar imaging of the brain at 3.0 T: first normal volunteer results. J Comput Assist Tomogr. 1994;18:339–343. doi: 10.1097/00004728-199405000-00001. [DOI] [PubMed] [Google Scholar]
- Martin RE, MacIntosh BJ, Smith RC, Barr AM, Stevens TK, Gati JS, Menon RS. Cerebral areas processing swallowing and tongue movement are overlapping but distinct: a functional magnetic resonance imaging study. J Neurophysiol. 2004;92:2428–2443. doi: 10.1152/jn.01144.2003. [DOI] [PubMed] [Google Scholar]
- Menon RS. Postacquisition suppression of large-vessel BOLD signals in high-resolution fMRI. Magn Reson Med. 2002;47:1–9. doi: 10.1002/mrm.10041. [DOI] [PubMed] [Google Scholar]
- Menon RS, Goodyear BG. Submillimeter functional localization in human striate cortex using BOLD contrast at 4 Tesla: implications for the vascular point-spread function. Magn Reson Med. 1999;41:230–235. doi: 10.1002/(sici)1522-2594(199902)41:2<230::aid-mrm3>3.0.co;2-o. [DOI] [PubMed] [Google Scholar]
- Murphy K, Bodurka J, Bandettini PA. How long to scan? The relationship between fMRI temporal signal to noise ratio and necessary scan duration. Neuroimage. 2007;34:565–574. doi: 10.1016/j.neuroimage.2006.09.032. [DOI] [PMC free article] [PubMed] [Google Scholar]
- Nan FY, Nowak RD. Generalized likelihood ratio detection for fMRI using complex data. IEEE Trans Med Imaging. 1999;18:320–329. doi: 10.1109/42.768841. [DOI] [PubMed] [Google Scholar]
- Neggers SFW, Hermans EJ, Ramsey NF. Enhanced sensitivity with fast three-dimensional blood-oxygen-level-dependent functional MRI: comparison of SENSE-PRESTO and 2D-EPI at 3T. NMR Biomed. 2008;21:663–676. doi: 10.1002/nbm.1235. [DOI] [PubMed] [Google Scholar]
- Nencka AS, Rowe DB. Reducing the unwanted draining vein BOLD contribution in fMRI with statistical post-processing methods. Neuroimage. 2007;37:177–188. doi: 10.1016/j.neuroimage.2007.03.075. [DOI] [PubMed] [Google Scholar]
- Ogawa S, Lee TM, Kay AR, Tank DW. Brain magnetic resonance imaging with contrast dependent on blood oxygenation. Proc Natl Acad Sci USA. 1990b;87:9868–9872. doi: 10.1073/pnas.87.24.9868. [DOI] [PMC free article] [PubMed] [Google Scholar]
- Ogawa S, Lee TM, Nayak AS, Glynn P. Oxygenation-sensitive contrast in magnetic resonance image of rodent brain at high magnetic fields. Magn Reson Med. 1990a;14:68–78. doi: 10.1002/mrm.1910140108. [DOI] [PubMed] [Google Scholar]
- Ogawa S, Menon RS, Tank DW, Kim SG, Merkle H, Ellermann JM, Ugurbil K. Functional brain mapping by blood oxygenation level-dependent contrast magnetic resonance imaging: a comparison of signal characteristics with a biophysical model. Biophys J. 1993;64:803–812. doi: 10.1016/S0006-3495(93)81441-3. [DOI] [PMC free article] [PubMed] [Google Scholar]
- Ogawa S, Tank DW, Menon R, Ellermann JM, Kim SG, Merkle H, Ugurbil K. Intrinsic signal changes accompanying sensory stimulation: functional brain mapping with magnetic resonance imaging. Proc Natl Acad Sci USA. 1992;89:5951–5955. doi: 10.1073/pnas.89.13.5951. [DOI] [PMC free article] [PubMed] [Google Scholar]
- Paskaranandavadivel N, O'Grady G, Du P, Cheng LK. Comparison of filtering methods for extracellular gastric slow wave recordings. Neurogastroenterol Motil. 2013;25:79–83. doi: 10.1111/nmo.12012. [DOI] [PMC free article] [PubMed] [Google Scholar]
- Petridou N, Italiaander M, van de Bank BL, Siero JCW, Luijten PR, Klomp DWJ. Pushing the limits of high-resolution functional MRI using a simple high-density multielement coil design. NMR Biomed. 2013;26:65–73. doi: 10.1002/nbm.2820. [DOI] [PubMed] [Google Scholar]
- Petridou N, Schäfer A, Gowland P, Bowtell R. Phase vs. magnitude information in functional magnetic resonance imaging time series: toward understanding the noise. Magn Reson Imaging. 2009;27:1046–1057. doi: 10.1016/j.mri.2009.02.006. [DOI] [PubMed] [Google Scholar]
- Polimeni JR, Fischl B, Greve DN, Wald LL. Laminar analysis of 7 T BOLD using an imposed spatial activation pattern in human V1. Neuroimage. 2010;52:1334–1346. doi: 10.1016/j.neuroimage.2010.05.005. [DOI] [PMC free article] [PubMed] [Google Scholar]
- Rowe DB. Modeling both the magnitude and phase of complex-valued fMRI data. Neuroimage. 2005;25:1310–1324. doi: 10.1016/j.neuroimage.2005.01.034. [DOI] [PubMed] [Google Scholar]
- Rowe DB, Hahn AD, Nencka AS. Functional magnetic resonance imaging brain activation directly from k-space. Magn Reson Imaging. 2009;27:1370–1381. doi: 10.1016/j.mri.2009.05.048. [DOI] [PMC free article] [PubMed] [Google Scholar]
- Rowe DB, Logan BR. A complex way to compute fMRI activation. Neuroimage. 2004;23:1078–1092. doi: 10.1016/j.neuroimage.2004.06.042. [DOI] [PubMed] [Google Scholar]
- Rowe DB, Meller CP, Hoffmann RG. Characterizing phase-only fMRI data with an angular regression model. J Neurosci Methods. 2007;161:331–341. doi: 10.1016/j.jneumeth.2006.10.024. [DOI] [PMC free article] [PubMed] [Google Scholar]
- Savitzky A, Golay MJE. Smoothing and differentiation of data by simplified least squares procedures. Anal Chem. 1964;36:1627–1639. [Google Scholar]
- Schneider RC, Kovar KA. Analysis of ecstasy tablets: comparison of reflectance and transmittance near infrared spectroscopy. Forensic Sci Int. 2003;134:187–195. doi: 10.1016/s0379-0738(03)00125-7. [DOI] [PubMed] [Google Scholar]
- Stringer EA, Chen LM, Friedman RM, Gatenby C, Gore JC. Differentiation of somatosensory cortices by high-resolution fMRI at 7T. Neuroimage. 2011;54:1012–1020. doi: 10.1016/j.neuroimage.2010.09.058. [DOI] [PMC free article] [PubMed] [Google Scholar]
- Sunaert S. Presurgical planning for tumor resectioning. J Magn Reson Imaging. 2006;23:887–905. doi: 10.1002/jmri.20582. [DOI] [PubMed] [Google Scholar]
- Swisher JD, Sexton JA, Gatenby JC, Gore JC, Tong F. Multishot versus single-shot pulse sequences in very high field fMRI: a comparison using retinotopic mapping. PLoS One. 2012;7:e34626. doi: 10.1371/journal.pone.0034626. [DOI] [PMC free article] [PubMed] [Google Scholar]
- Triantafyllou C, Hoge RD, Krueger G, Wiggins CJ, Potthast A, Wiggins GC, Wald LL. Comparison of physiological noise at 1.5 T, 3 T and 7 T and optimization of fMRI acquisition parameters. Neuroimage. 2005;26:243–250. doi: 10.1016/j.neuroimage.2005.01.007. [DOI] [PubMed] [Google Scholar]
- Turner R. How much cortex can a vein drain? Downstream dilution of activation-related cerebral blood oxygenation changes. Neuroimage. 2002;16:1062–1067. doi: 10.1006/nimg.2002.1082. [DOI] [PubMed] [Google Scholar]
- Uğurbil K. The road to functional imaging and ultrahigh fields. Neuroimage. 2012;62:726–735. doi: 10.1016/j.neuroimage.2012.01.134. [DOI] [PMC free article] [PubMed] [Google Scholar]
- van der Meulen P, Groen JP, Cuppen JJM. Very fast MR imaging by field echoes and small angle excitation. Magn Reson Imaging. 1985;3:297–299. doi: 10.1016/0730-725x(85)90362-5. [DOI] [PubMed] [Google Scholar]
- van der Meulen P, Groen JP, Tinus AMC, Bruntink G. Fast field echo imaging: an overview and contrast calculations. Magn Reson Imaging. 1988;6:355–368. doi: 10.1016/0730-725x(88)90472-9. [DOI] [PubMed] [Google Scholar]
- Vaughan JT, Garwood M, Collins CM, Liu W, DelaBarre L, Adriany G, Andersen P, Merkle H, Goebel R, Smith MB, Ugurbil K. 7T vs. 4T: RF power, homogeneity, and signal-to-noise comparison in head images. Magn Reson Med. 2001;46:24–30. doi: 10.1002/mrm.1156. [DOI] [PubMed] [Google Scholar]
- Yacoub E, Shmuel A, Pfeuffer J, Van De Moortele PF, Adriany G, Andersen P, Vaughan JT, Merkle H, Ugurbil K, Hu X. Imaging brain function in humans at 7 Tesla. Magn Reson Med. 2001;45:588–594. doi: 10.1002/mrm.1080. [DOI] [PubMed] [Google Scholar]
- Yacoub E, Van De Moortele PF, Shmuel A, Uğurbil K. Signal and noise characteristics of Hahn SE and GE BOLD fMRI at 7 T in humans. Neuroimage. 2005;24:738–750. doi: 10.1016/j.neuroimage.2004.09.002. [DOI] [PubMed] [Google Scholar]
- Zhao F, Jin T, Wang P, Hu X, Kim SG. Sources of phase changes in BOLD and CBV-weighted fMRI. Magn Reson Med. 2007;57:520–527. doi: 10.1002/mrm.21159. [DOI] [PubMed] [Google Scholar]
- Zhao F, Wang P, Kim SG. Cortical depth-dependent gradient-echo and spin-echo BOLD fMRI at 9.4T. Magn Reson Med. 2004;51:518–524. doi: 10.1002/mrm.10720. [DOI] [PubMed] [Google Scholar]