

Abstract
The molecular mechanisms underlying neuronal death are poorly understood. One of the most widely used models to study neuronal death are cultured cerebellar granule neurons (CGNs) which undergo apoptosis when switched from a medium containing depolarizing levels of potassium (HK) to a medium with low non-depolarizing levels of potassium (LK). Previously, other labs have used DNA microarray analysis to characterize gene expression changes in LK-treated CGNs. However, microarray analysis is only capable of measuring the status of known transcripts, and expression of low-abundance mRNAs is often not detected by the hybridization-based approach. We have used RNA-Sequencing to conduct a more detailed and comprehensive analysis of gene expression changes in CGNs induced to die by LK treatment. RNA-seq investigates the status of both known transcripts as well as exploring new ones and is substantially more sensitive than the microarray approach. We have found that the expression of 4,334 genes is significantly altered in LK treated CGNs with 2,199 being up-regulated while 2,135 are down-regulated. Genes functioning in cell death and survival regulation, cell growth and proliferation and molecular transport were most affected by LK treatment. Further, a large number of genes involved in nervous system development and function were also deregulated. Analysis of signaling pathways that were affected in LK-induced death included but were not limited to mitochondrial dysfunction and oxidative phosphorylation, consistent with a number of studies showing perturbations of these pathways in neurodegenerative disorders. Thus, our study identifies a large number of new genes that are affected during the process of neuronal death. While a majority of these changes may reflect consequences of the induction of neuronal death, many of the genes that we have identified are likely to be critical and potentially novel mediators of neuronal death, including death associated with neurodegenerative disease.
Keywords: Cerebellar granule neurons, RNA-Seq, Neuronal death, Gene expression, Transcriptome profiling, Potassium withdrawal
INTRODUCTION
During the development of the vertebrate nervous system about half of all the neurons that are produced are eliminated. This large scale death of neurons serves to ensure proper formation of the nervous system by matching neurons to the target that they innervate and to match innervation to target size1. While necessary during nervous system development, abnormal loss of neurons is a characterizing feature of neurodegenerative diseases such as Alzheimer’s disease, Parkinson’s disease, Huntington’s disease and amyotrophic lateral sclerosis2. Although the molecular events that lead to neuronal death in each of these neurodegenerative diseases is distinct, the downstream apoptotic process through which neurons die in these disorders are believed to share commonalities to each other as well as to developmentally-regulated neuronal death3. Definitely, the mechanisms underlying neuronal death will therefore not only help to understand how neurons die during development, but also the mechanisms regulating neuronal death in various degenerative brain disorders.
Cultures of cerebellar granule neurons (CGNs) have been widely used to study the molecular mechanisms underlying neuronal viability. These neurons are kept healthy and alive by the addition of depolarizing levels of potassium4–7. A switch of the medium to low, non-depolarizing levels of potassium induces apoptosis. Survival by elevated potassium, or HK, mimics the survival-promoting effect of neuronal activity during normal neurodevelopment8. As in other model systems of neuronal apoptosis9,10, cell death in this model is believed to require new gene because treatment with transcriptional and translational inhibitors can protect neurons from LK-induced death11. Other investigators have used DNA microarray analysis with the CGN model to identify transcriptional alterations that are associated with neuronal death12,13, however, this method is only capable of measuring the status of known transcripts and does not allow for studying changes in global gene expression. Moreover, expression of mRNAs that are expressed at low levels is often not detected by the hybridization-based microarray analysis. To conduct a more detailed and comprehensive analysis of transcriptome alterations during neuronal death, we have used RNA-Seq analysis, a technique that investigates the status of both known transcripts and allows for exploring new ones14. Because of low background signal, RNA-Seq can detect expression and alterations of expression of low abundance transcripts14–17. Consistent with these advantages, using RNA-Seq we report that the extent of transcriptional changes during neuronal apoptosis is much larger than previously described using microarray technology12,13. We have also looked at the signaling network and pathways that are affected during neuronal death as well as upstream regulators that are likely to be involved. We believe that this study identifies molecules that have thus far not been described as regulators of neuronal death, and may play a key role during developmentally-regulated neuronal death or in the pathogenesis of neurodegenerative disease.
MATERIALS AND METHODS
Primary Neuronal Culture, Treatments and viability assay
Cultures enriched in CGNs were prepared from cerebella of 7 day old rat pups and were plated in basal Eagle’s minimal medium supplemented with 10% fetal bovine serum, 2 mM L- glutamine, 0.2% gentamycin and 25 mM KCl as described previously5. To prevent proliferation of non-neuronal cells, 10μM cytosine arabinoforanoside was added to the culture medium 18–22 h after plating. At 7 days in vitro, CGN cultures were washed and incubated in the serum-free basal Eagle’s Minimal medium supplemented with either 25 mM KCl (high potassium, HK) or without KCl (low potassium, LK) for 6 hours, a time, when almost half of the neurons are committed to die and can no longer be rescued. For viability assay, cells were fixed, immunocytochemistry was performed, and viability was quantified by cell morphology using 4′6-diamidino-2-phenylindole hydrochloride (DAPI) staining. Cells with condensed or fragmented nuclei were scored as dead. Unless mentioned otherwise, all viability experiments were performed in duplicate and each experiment was repeated three times. For each experiment, ≥200 cells were counted.
RNA preparation and RT-PCR
Total RNA was isolated from the cultured neurons treated with either HK or LK using Trizol reagent (Life Technologies) according to the manufacturer’s guidelines. For reverse transcription, 3 μg of total RNA was used and cDNA was prepared using Superscript cDNA synthesis Kit (Life Technologies). Resulting cDNA was used as a template for PCR to validate the expression data obtained from RNA sequencing analysis. All the Primer pairs were designed using Primer Blast and sequences are mentioned in supplementary table 1.
RNA Sequencing
For sequencing, total RNA was used from either HK or LK treated primary neurons. After an initial quality check on Bioanalyzer (Agilent Technologies), 1μg of total RNA was used and library was constructed using the Trueseq RNA sample preparation kit from Illumina according to the manufacturer’s protocol. Triplicate samples of each condition (HK and LK; S1, S2 and S3) were amplified and profile checked for size distribution and peak concentration on Bioanalyzer. Amplified cDNA fragment libraries were sequenced on an Illumina HiSeq2000 at the University of Southwestern Medical Center sequencing facility using default parameters (single end, forward sequencing).
Differential Gene Expression Analysis
Quality assessment of the raw sequencing reads was done using NGS-QC-Toolkit18. Sequencing reads with quality score under Phred Score < 20 were discarded. The quality filtered reads were then aligned to rat reference genome RGSC_v3.4 (rn4) using Bowtie2 (v 2.0.6) aligner19. Differential gene expression analysis was done using DESeq (v 1.10.1)20 following the protocols outlined in21. Read counts are normalized by taking the median of each gene count across samples and dividing each sample gene count by the relative ratio of library sizes between the calculated median and sample size. Gene counts are scaled to counts per million. Fold change values, raw p-values, and p-values adjusted for multiple testing using Benjamini-Hochberg are calculated for each gene. Genes were considered significantly differentially expressed if they had a false discovery rate (FDR) of less than 5%.
Significant Gene Ontology (GO) and Pathway Enrichment Analysis
DAVID as well as IPA gene functional annotation and classification tool was used to annotate the list of differentially expressed genes with respective GO terms and GO enrichment analysis was performed for molecular and biological functional categories22. A Rattus norvegicus specific set of 3797 genes was used as background to calculate the enriched GO functional categories for the differentially expressed genes identified through the RNA-Seq experiment. Functional Gene Ontology groups were selected for significance by using a false discovery rate (FDR) cutoff of 5%.
Significant pathway enrichment analysis was performed using Ingenuity Pathways Analysis (IPA; Ingenuity® Systems, CA, USA). Differentially expressed genes from the RNA expression data are associated with a biological function supported by at least one publication in the Ingenuity Pathways Knowledge Base. Fisher’s exact test is then used to calculate the P-value and determine the probability that each biological function is enriched in the dataset due to chance alone. Statistically significant biological pathways were then identified by selection for pathways with Benjamini-Hochberg adjusted p-values < 0.05.
Upstream regulator analysis was done to identify common transcriptional regulators that can explain the observed gene expression data. The analysis was based on using prior knowledge of expected effects between transcriptional regulators and their target genes stored in the Ingenuity Knowledge Base. The analysis examines how many known targets of each transcriptional regulator are present in the RNA expression data and also compares the direction of expression as expected from literature of the relevant transcriptional regulator. Observed gene expression changes can be consistent with the expected direction of expression of which can be in one of two transcriptional regulator activity states: activated or inhibited. Molecules classified as upstream transcriptional regulators include transcription factors, microRNA, kinases and drugs. Functional significance of upstream transcriptional regulators is determined by using a z-score value that measures how well the observed gene expression data matches the literature-derived regulation direction. The absolute value of the z-score determines the likelihood that the regulator predicts the observed expression data was not by chance with positive z-score values indicating regulatory activation and negative z-score values for regulatory inhibition. Fisher’s exact test is used in a similar manner as the biological pathway analysis to calculate the p-value and identify statistically significant upstream regulators (p-value<0.05).
RESULTS
RNA-Seq analysis and global gene expression profiles in neurons primed to die
Switching cultured CGNs from HK medium to LK medium induces neuronal apoptosis. Although cell death is not observed until 12 h, the neurons are committed to death between 4 – 6 hours of LK-treatment23–25. We have therefore conducted our RNA-Seq analysis using RNA from HK and LK treated cultures prepared at 6 h after treatment. Three RNA samples from three separate CGN cultures were used. We confirmed by RT-PCR analysis that expression of c-jun, a widely recognized marker of neuronal death, was robustly induced in the three RNA samples before RNA-Seq was conducted (data not shown). The three sets of HK and LK samples were sequenced on one lane of the Illumina HiSeq 2000 platform (Illumina, San Diego, CA). Raw reads were mapped to the reference rat genome (rn4). Around 70% of total reads were successfully mapped to the reference genome. Detailed mapping statistics are listed in Table 1. First, clustering analysis of the expression data shows the samples are grouped according to their HK or LK classification. Correlation matrix of the six samples from the three sets of CGN cultures are given in supplementary data (Fig. S1). Using criteria of FDR adjusted p-value of less than 0.05, a total number of 4334 genes were identified to be differentially expressed in the two conditions (Table 1.2). Out of these differentially expressed genes 2,199 genes were up-regulated and 2,135 genes were down-regulated under LK condition. The 10 most up- and down-regulated genes in LK are listed in Table 2. A complete list of genes that are significantly regulated is provided in supplementary data (Table S2–4). To validate our sequencing data, we performed RT-PCR analysis using RNA from HK and LK-treated CGN cultures for 4 genes which, based on our RNA-Seq results, were up-regulated in LK (Trim 17, Slc6a7, Btbd17, Stmn4), and 4 more that were found to be down-regulated (Npas4, Igfbp3, Tmem 196, Car7) (Fig.1). These genes were chosen because they are potentially relevant to neuronal death but had not been previously focused as neuronal death-causing molecule. For example, Slc6a7 (Solute Carrier Family 6 (Neurotransmitter Transporter), Member 7), is a member of GABA neurotransmitter gene family and functions as a Proline transporter. Stmn4 (Stathmin like 4) exhibits microtubule-destabilizing activity. The IGFBP family (insulinlike growth factor binding proteins) represents a family of conserved proteins that share the ability to bind IGF-I and IGF-II and are known to either inhibit or potentiate the action of IGF26. Npas4 is an activity dependent neuronal transcription factor with a key role in social and cognitive functions relevant to developmental disorders. Although the extent of alteration was not as much as indicated by RNA-Seq, we confirmed using RT-PCR that the expressions of these genes were either up- or down-regulated in accordance with the RNA-Seq data. We further validated our RNA-Seq data by examining whether our list of differentially-expressed genes included those already known in the literature to be deregulated during neuronal death. For example, c-Jun, Igfbp1, Egr-1, Caspase-3, Caspase-6 and p73, which are known to be up-regulated27–31, showed a significantly increased expression in our RNA seq data (Table S3). On the other hand expression of Igfbp5, c-Fos and Npas4, previously reported to be down-regulated32,33, was in the list significantly down-regulated genes (Table S4). These results provide confidence that the RNA-Seq analysis was successful in identifying genes that are differentially-expressed in CGNs during LK-induced death.
Table 1.
RNA from three separate sets of CGN cultures treated with HK or LK were used for RNA-Seq. Raw reads were mapped to the reference rat genome (rn4). Table 1.1 shows detailed mapping statistics of the sequencing reads obtained from the three sets of RNA samples in either condition. Differential expression analysis was performed using DEseq. Table 1.2 shows the numbers of genes differentially expressed after LK treatment of CGNs, calculated after applying FDR cutoff of adjusted p-value < 0.05
| 1.1
| |||||||||
|---|---|---|---|---|---|---|---|---|---|
| High Potasium (+25mM KCI, HK) | |||||||||
| Mapped | Uniquely mapped | % of Total mapped | |||||||
| 1 | 2 | 3 | 1 | 2 | 3 | 1 | 2 | 3 | |
| Exon-exon | 4757117 | 4495316 | 3736405 | 4313864 | 4079542 | 3385667 | 16.91 | 16.87 | 16.01 |
| Exon-intron | 226170 | 199771 | 201238 | 215838 | 190137 | 192172 | 0.8 | 0.75 | 0.86 |
| Total exon | 23908062 | 22694951 | 19824076 | 22084046 | 20997447 | 18393002 | 84.96 | 85.19 | 84.97 |
| Total intron | 4231747 | 3944936 | 3507883 | 3460041 | 3206800 | 2897428 | 15.04 | 14.81 | 15.03 |
| Total gene | 28139809 | 26639887 | 23331959 | 25544087 | 24204247 | 21290430 | 100 | 100 | 100 |
| Low Potasium (+5mM KCI, LK) | |||||||||
| Mapped | Uniquely mapped | % of Total mapped | |||||||
| 1 | 2 | 3 | 1 | 2 | 3 | 1 | 2 | 3 | |
| Exon-exon | 4328289 | 4105310 | 3853533 | 3924946 | 3738989 | 3493850 | 16.27 | 16.11 | 15.29 |
| Exon-intron | 210037 | 199432 | 203481 | 199715 | 189776 | 193824 | 0.79 | 0.78 | 0.81 |
| Total exon | 22578563 | 21682543 | 21465130 | 20960096 | 20195084 | 20021671 | 84.89 | 85.08 | 85.2 |
| Total intron | 4018031 | 3802487 | 3729792 | 3184725 | 3000245 | 2983964 | 15.11 | 14.92 | 14.8 |
| Total gene | 26596594 | 25485030 | 25194922 | 24144821 | 23195329 | 23005635 | 100 | 100 | 100 |
| 1.2
| |
|---|---|
| Differential Expression | Gene Count |
| Up-regulated | 2199 |
| Down-regulated | 2135 |
| Total | 4334 |
Table 2.
RNA from three separate sets of CGN cultures treated with HK or LK were used for RNA-Seq. List of top 10 (A) up-regulated genes and (B) down-regulated genes after LK treatment. Fold change values, raw p-values and p-values adjusted for multiple testing were calculated using Benjamini-Hochberg test. Genes were considered significantly differentially expressed if they had a false discovery rate of less than 5%.
| A) Up-regulated Genes in LK | B) Down-regulated Genes in LK | ||||
|---|---|---|---|---|---|
| Gene | Fold Change | FDR | Gene | Fold Change | FDR |
| Klrd1 | 82.48 | 1.94E-07 | Npas4 | 50.83 | 5.02E-04 |
| Slcl7a1 | 79.85 | 2.33E-07 | Pthlh | 27.06 | 3.47E-74 |
| Ccin | 74.27 | 3.21E-06 | Txlnb | 19.86 | 3.87E-07 |
| Calhm1 | 71.54 | 1.92E-07 | Bag2 | 15.25 | 1.37E-90 |
| Sohlh1 | 50.58 | 3.44E-04 | Car7 | 14.61 | 7.46E-14 |
| Stra6 | 47.56 | 1.14E-07 | Cacng6 | 13.82 | 7.95E-29 |
| Slcl7a3 | 46.26 | 4.76E-54 | Cytip | 13.25 | 5.32E-29 |
| Dusp9 | 41.64 | 6.65E-08 | Igfbp3 | 13.20 | 7.25E-35 |
| Kcnj15 | 38.81 | 7.71E-04 | Irx3 | 12.43 | 4.21E-16 |
| Gpr113 | 36.52 | 5.43E-38 | RGD1304931 | 11.61 | 1.04E-69 |
Figure 1.
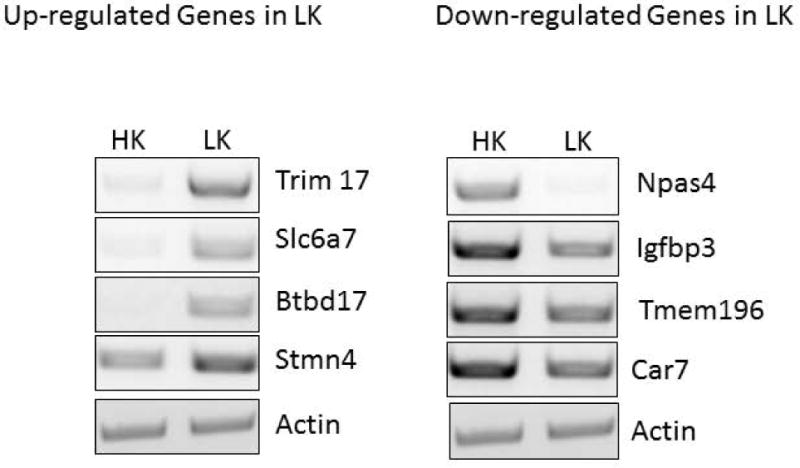
RT-PCR validation of up-regulated and down-regulated genes after LK treatment. Primary cultures of CGN were treated with HK or LK for 6h on day 7 in vitro and RNA was used for RT-PCR. Actin was used as a normalization control. Primer pairs used to amplify cDNA are given in supplementary data (Table S1).
Functional annotation of the global gene expression profile and pathway analysis
To investigate the physiological processes targeted by the differentially expressed genes in response to LK-treatment, we carried out a GO classification analysis of the differentially expressed genes using IPA. Fig.2 lists the functional categories with significant p-value < 0.01. Based on the GO analysis, a particularly large number of differentially expressed genes are found to be associated with “Cell Death and Survival” (154 genes up-regulated and 125 genes down-regulated). The second highest group of significant functional categories is related to ion transport and molecular secretion. When looked at the list of up- and down-regulated genes in LK (Table 3), highly significant annotations were found to be “Molecular Transport”, and “Cellular Growth and Proliferation”, where 147 and 132 genes, respectively, were found to be up-regulated in LK. On the other hand functional annotations enriched in down-regulated genes category were “Nucleic Acid Metabolism”, “Small Molecule Biochemistry”, and “Energy Production”. Categories such as “Cell Death and Survival” were more or less equally represented in both up-regulated and down-regulated genes (Table 3). When we looked at the physiological system development and functions, most significant annotations were in “Behavior” and “Nervous System Development and Function” in the up-regulated and down-regulated gene categories, respectively (Table 3). A complete list of all the Gene Ontology term enrichments is provided as supplementary data (Table S5–S7).
Figure 2.
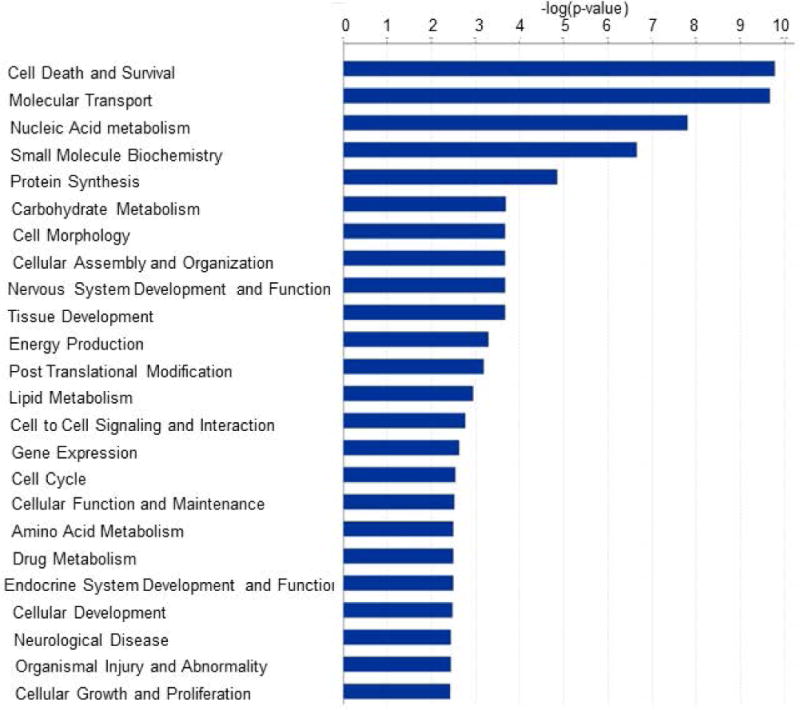
Graphical representation of biological functions derived from GO enrichment of differentially expressed genes in CGNs treated with HK and LK. DAVID and IPA gene functional annotation and classification tool was used to annotate the list of differentially expressed genes with respective GO terms. Bars represent –log (p-value) in each functional category. Functional GO enrichments were selected for significance by using a false discovery rate FDR cutoff of 5%.
Table 3.
List of the top 5 functional annotations derived from GO enrichment analysis of differentially expressed up-regulated and down-regulated genes in primary CGN cultures after LK treatment. GO enrichments were classified into two categories i) Molecular and Cellular Function, ii) Physiological System development and function. Table also shows the number of molecules associated with each category.
| Up-regulated in LK | ||
|---|---|---|
| Molecular and Cellular Functions | p- value | # molecules |
| Molecular Transport | 7.52E-09 – 4.87E-02 | 147 |
| Cellular growth and Proliferation | 2.04E-07 – 3.86E-02 | 132 |
| Cell death and Survival | 4.28E-07 – 4.64E-02 | 154 |
| Gene Expression | 4.25E-05 – 3.49E-02 | 83 |
| Amino Acid Metabolism | 1.24E-04 – 4.20E-02 | 29 |
| Physiological system Development and Function | ||
| Behavior | 171E-05 – 4.20E-02 | 45 |
| Endocrine System Development and Function | 1.24E-04 – 2.62E-02 | 22 |
| Cardiovascular System Development and Function | 1.32E-03 – 3.86E-02 | 34 |
| Organismal Development | 1.32E-03 – 4.41E-02 | 45 |
| Tissue Morphology | 1.32E-03 – 3.86E-02 | 13 |
| Down-regulated in LK | ||
| Molecular and Cellular Functions | ||
| Nucleic Acid Metabolism | 2.97E-09 – 1.27E-02 | 55 |
| Small Molecule Biochemistry | 2.97E-09 – 4.44E-02 | 91 |
| Energy Production | 2.96E-07 – 1.27E-02 | 20 |
| Cell Death and Survival | 1.40E-05 – 4.76E-02 | 125 |
| Cellular Function and Maintenance | 5.01E-05 – 3.80E-02 | 95 |
| Physiological system Development and Function | ||
| Nervous System Development and Function | 2.56E-03 – 4.25E-02 | 87 |
| Tissue Development | 2.56E-03 – 4.25E-02 | 67 |
| Endocrine System Development and Function | 5.25E-03 – 5.25E-03 | 3 |
| Embryonic Development | 6.25E-03 – 3.54E-02 | 23 |
| Organ Morphology | 1.20E-02 – 1.20E-02 | 3 |
In order to investigate pathways involved in neuronal death after potassium deprivation, the differentially expressed gene data set was processed through IPA. Table 4 lists the top five significantly dysregulated pathways under LK condition. The two most significantly dysregulated canonical pathways in the down-regulated genes category include mitochondrial dysfunction and oxidative phosphorylation. Contrary to this, “Protein Kinase A Signaling” was the most perturbed pathway in the up-regulated genes category (Table 4). One interesting finding was that the “Ubiquitination Pathway” also appeared to be significantly dysregulated where 47 out of 232 molecules were down-regulated after LK-treatment (Table 4). We also performed network analysis using IPA to identify significantly enriched networks based on the RNA-Seq data. The 2 most significant networks are shown in Fig.3 for genes that are up-regulated (A and B) and down-regulated (C and D) in LK. The up-regulated genes category was largely associated with “Nervous System Development and Function” and “Energy Production”. On the other hand, networks like “Cell Death and Survival”, “Tumor Morphology”, “Neurological Diseases”, “Molecular Transport” and “Cell Signaling” was associated with the category of genes down-regulated after LK treatment. Detailed lists of all the pathways and networks are given in supplementary data (Table S8–S13).
Table 4.
List of the top 5 canonical pathways derived from IPA analysis of differentially expressed up- and down-regulated genes in primary CGN cultures after LK treatment. Fisher’s exact test was used to calculate the P-value and determine the probability that each biological function is enriched in the dataset due to chance alone. Statistically significant biological pathways were then identified by selection for pathways with Benjamini-Hochberg adjusted p-values < 0.05.
| Top Canonical Pathways | p- value | Ratio |
|---|---|---|
| Mitochondrial Dysfunction | 1.30E-11 | 74/156 |
| Oxidative Phosphorylation | 474E-11 | 53/100 |
| TCA Cycle II (Eukaryotic) | 2.59E-05 | 14/21 |
| Protein Kinase A Signaling | 3.86E-05 | 113/354 |
| Dopamine-DARP32 Feedback in cAMP signalling | 5.27E-05 | 57/156 |
| Pathways Formed under Up-regulated Genes inLK | ||
| Protein Kinase A Signaling | 5.40E-06 | 70/354 |
| Tweak signaling | 5.85E-06 | 14/35 |
| Role of PKR in interferon induction and Antiviral Response | 1.81E-05 | 15/43 |
| Axonal guidance signaling | 2.25E-05 | 74/406 |
| Hepatic cholestasis | 7.80E-05 | 31/133 |
| Pathways formed under Down-regulated Genes in LK | ||
| Mitochondrial dysfunction | 5.18E-25 | 68/156 |
| Oxidative Phosphorylation | 6.11E-25 | 53/100 |
| TCA Cycle II (Eukaryotic) | 2.77E-09 | 14/21 |
| Protein Ubiquitination Pathway | 3.60E-05 | 47/232 |
| Glutaryl-CoA Degradation | 5.02E-05 | 7/11. |
Figure 3.
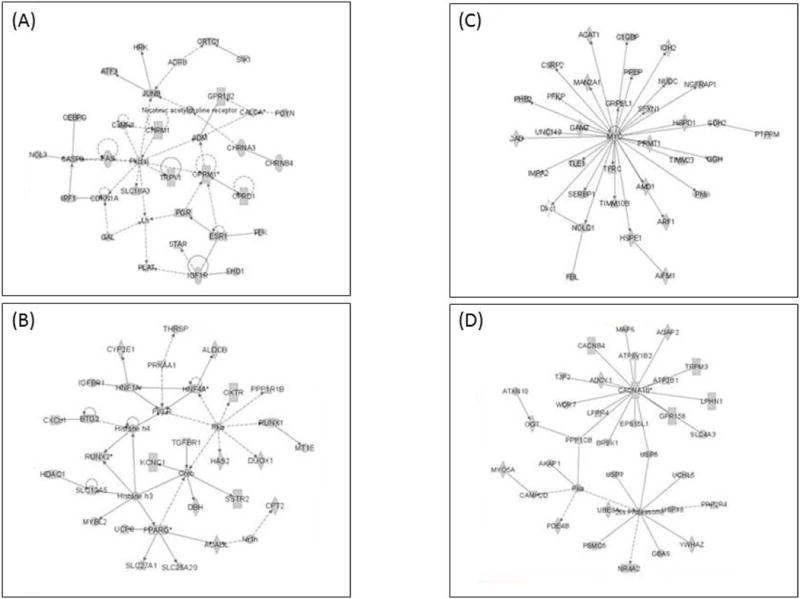
Top 2 significant networks developed from the differentially expressed up-regulated (A and B) and down-regulated (C and D) genes in primary CGN cultures after LK treatment. (A) Network associated with “Organismal Injury and Abnormalities”, “Nervous System Development and Function” and “Inflammatory Response” (B) Network associated with “Energy Production”, “Lipid Metabolism” and “Small Molecule Biochemistry” (C) Network associated with “Cell Death and Survival”, “Tumor Morphology” and “Energy Production”. (D) Network associated with “Neurological Disease”, “Molecular Transport” and “Cell Signaling”.
Identification of upstream regulators involved in gene regulation
To identify the different molecules that mediate the observed transcriptional changes, we performed an upstream regulator analysis with IPA. Factors that can be identified as potential upstream regulators include kinases, nuclear receptors, other transcription factors and some micro RNAs. A list of top 8 upstream molecules in up-and down-regulated category are listed in Table 5. Most notable upstream regulator in the up-regulated gene category was found to be protein kinase A (PKA). Other important molecules include Ephrin receptor B1 (EPHB1) and Upstream Transcription factor 1 (USF1). Under down-regulated genes, the most important upstream molecule was predicted to be Myc and adrenergic receptor beta. Upstream regulator analysis also revealed micro RNA 221 (miR-221) as a regulatory molecule targeting cyclin dependent kinase inhibitor1 (Cdkn1). A complete list of all the upstream regulators is provided in the supplementary data (Table S14–S16).
Table 5.
List of the top 8 upstream regulator molecules derived from IPA analysis of differentially expressed up- and down-regulated genes in primary CGN cultures after LK treatment. Functional significance of upstream transcriptional regulators is determined by using a Z-score value. Fisher’s exact test was used to calculate the p-value and identify statistically significant upstream regulators.
| Upstream regulators | p-value |
|---|---|
| Up-regulated in LK | |
| Pka | 9.54E-07 |
| EPHB1 | 1.31E-04 |
| USF1 | 7.51E-04 |
| SP3 | 7.51E-04 |
| HNF1A | 7.51E-04 |
| P38 MAPK | 9.68E-04 |
| PRKAA2 | 1.46E-03 |
| AGTR2 | 2.05E-03 |
| Down-regulated in LK | |
| Myc | 1.28E-04 |
| ADRB | 1.10E-02 |
| KAT5 | 3.26E-02 |
| Hsp90 | 3.33E-02 |
| NRF1 | 3.33E-02 |
| PPP1CC | 3.33E-02 |
| Setd3 | 3.33E-02 |
| FSHR | 4.91E-02 |
DISCUSSION
We have used RNA-Seq to obtain a global overview of changes in gene expression that occur during neuronal apoptosis. The paradigm we used, LK-treated CGNs, is one of the most commonly used experimental systems to study neuronal death and significant insight into the mechanism of neuronal death, including death associated with neurodegenerative diseases, has come from this model. We find that a total of 4,334 genes are differentially expressed after LK-treatment, with 2,199 genes being up-regulated and 2,135 genes being down-regulated. These numbers of genes showing up or downregulation during neuronal apoptosis is much more than what others have found earlier12,13. For example, Desagher et al., 2005, using microarray could find only 368 genes to be differentially expressed. Out of these, 278 genes were significantly upregulate and 90 genes were significantly down-regulated in apoptotic neurons. Similarly, Chiang et al., 2001, again using a cDNA array analysis could pick only 790 genes showing down regulation. Similarly, using other paradigms of neuronal death such as NGF-deprived sympathetic neurons34 a relatively smaller number of genes were identified as differentially-expressed. For example, Kristiansen et al. (2011) described using NGF-deprived sympathetic neurons and the same FDR value as we did, that 813 genes were down-regulated by NGF-deprivation compared with 415 that were up-regulated. However, again these results were obtained using microarray technology.
Although both microarray analyses and RNA-Seq can pull up false hits, based on our analysis we are confident that our screen has identified genes that are actually differentially regulated. Before our RNA samples were used for RNA-Seq, we made sure that expression of c-jun was up-regulated in all three sets of RNA from LK-treated samples. Once RNA-Seq data was obtained, we confirmed that genes previously shown to be regulated by LK-treatment were in the list of genes identified in our RNA-Seq experiment. Moreover, we validated by RT-PCR analyses that other genes not previously documented to display altered expression in paradigms of neuronal death but identified in the RNA-Seq analyses we conducted, were in fact differentially expressed. Not surprisingly, alterations were most abundantly observed among genes that function in the regulation of cell death and survival. Genes functioning in the regulation of molecular transport or cell proliferation also showed extensive deregulation. Our analysis also reveals that expression of genes connected to signaling pathways mediating mitochondrial dysfunction and oxidative phosphorylation are also affected. This is consistent with numerous reports showing that key roles for mitochondrial dysfunction and oxidative stress in experimental models neuronal death and in neurodegenerative disorders35–40.
One very interesting finding from our RNA-seq analysis was dysregulation of the protein ubiquitination pathway following LK-treatment of CGNs. Involvement of ubiquitin/proteasome system (UPS) impairment has been known to be of much significance in neurodegenerative disorders41. Even in non-neuronal systems, a large amount of data has been published showing a link between the UPS and cell death (see42 for review). A large number of molecules involved in apoptosis are known to be regulated by the ubiquitin–proteasome43–46. Analysis of the present data also revealed that a number of cell cycle related genes were deregulated following potassium withdrawal. This was not surprising considering the fact that deregulation of cell cycle control leads to an abortive reentry of mature differentiated post mitotic neurons and results in apoptosis rather than neuronal proliferation47–51.
Previously, studies related to neuronal death involved in most of the neurodegenerative disorders has largely focused on the roles of protein-coding genes; however, further studies have shown that disease pathogenesis can also be modulated through regulatory mechanisms mediated by small non-coding RNAs (reviewed in52). Our study further supports the idea that micro RNAs can also be a therapeutic targets in neuronal death as we found micro RNA as an upstream regulatory molecule affecting changes in the expression of genes downstream. Specifically miR-221 was found to be a regulatory molecule targeting cyclin dependent kinase inhibitor1 (Cdkn1). Selective Cdk inhibitors have earlier been shown to limit neuroinflammation and progressive neurodegeneration after brain injury53. In addition to miR-221, miR-183 was also found a regulatory molecule targeting EGR1 (Early Growth Response 1) and IRS1 (Insulin Receptor Substrate 1). EGR1 belongs to the EGR family of proteins and functions as a transcriptional regulator, playing an important role in mitogenesis and differentiation. On the other hand, IRS1 is associated with the AKT signaling pathway.
To summarize, our study identifies a large number of genes previously unconnected to the regulation of neuronal death. While a majority of these changes may reflect consequences of the induction of neuronal death, many of the genes that we have identified are likely to be critical mediators of neuronal death. It is tempting to speculate that these genes may contribute to the pathogenesis of neurodegenerative diseases and could represent molecules that can be targeted in the development of therapies for these fatal brain disorders.
Supplementary Material
Acknowledgments
This research was supported by a grant from the NIH (R01 NS040408) to SRD. We thank Dr. Michael Zhang and Dr. Yunfei Wang from the University of Texas at Dallas for their suggestions and help in the discussion of our data.
Footnotes
SUPPLEMENTAL DATA-Table S1–Table S16.
AUTHOR CONTRIBUTIONS
Experiment was conceived and designed by SRD, DS. Experiments performed by DS. Data was analyzed by MSK, DS. Manuscript was written by DS, MSK, SRD.
References
- 1.Pettmann B, Henderson CE. Neuronal cell death. Neuron. 1998 Apr;20(4):633–647. doi: 10.1016/s0896-6273(00)81004-1. [DOI] [PubMed] [Google Scholar]
- 2.Mattson MP. Apoptosis in neurodegenerative disorders. Nat Rev Mol Cell Biol. 2000 Nov;1(2):120–129. doi: 10.1038/35040009. [DOI] [PubMed] [Google Scholar]
- 3.Johnson K, Liu L, Majdzadeh N, Chavez C, Chin PC, Morrison B, et al. Inhibition of neuronal apoptosis by the cyclin-dependent kinase inhibitor GW8510: identification of 3′ substituted indolones as a scaffold for the development of neuroprotective drugs. J Neurochem. 2005 May;93(3):538–548. doi: 10.1111/j.1471-4159.2004.03004.x. [DOI] [PubMed] [Google Scholar]
- 4.Gallo V, Giovannini C, Levi G. Modulation of non-N-methyl-D-aspartate receptors in cultured cerebellar granule cells. J Neurochem. 1990 May;54(5):1619–1625. doi: 10.1111/j.1471-4159.1990.tb01213.x. [DOI] [PubMed] [Google Scholar]
- 5.D’Mello SR, Galli C, Ciotti T, Calissano P. Induction of apoptosis in cerebellar granule neurons by low potassium: inhibition of death by insulin-like growth factor I and cAMP. Proc Natl Acad Sci U S A. 1993 Dec 1;90(23):10989–10993. doi: 10.1073/pnas.90.23.10989. [DOI] [PMC free article] [PubMed] [Google Scholar]
- 6.Miller TM, Johnson EM., Jr Metabolic and genetic analyses of apoptosis in potassium/serum-deprived rat cerebellar granule cells. J Neurosci. 1996 Dec 1;16(23):7487–7495. doi: 10.1523/JNEUROSCI.16-23-07487.1996. [DOI] [PMC free article] [PubMed] [Google Scholar]
- 7.Verma P, Pfister JA, Mallick S, D’Mello SR. HSF1 protects neurons through a novel trimerization- and HSP-independent mechanism. J Neurosci. 2014 Jan 29;34(5):1599–1612. doi: 10.1523/JNEUROSCI.3039-13.2014. [DOI] [PMC free article] [PubMed] [Google Scholar]
- 8.Ikonomidou C, Bosch F, Miksa M, Bittigau P, Vockler J, Dikranian K, et al. Blockade of NMDA receptors and apoptotic neurodegeneration in the developing brain. Science. 1999 Jan 1;283(5398):70–74. doi: 10.1126/science.283.5398.70. [DOI] [PubMed] [Google Scholar]
- 9.Martin DP, Schmidt RE, DiStefano PS, Lowry OH, Carter JG, Johnson EM., Jr Inhibitors of protein synthesis and RNA synthesis prevent neuronal death caused by nerve growth factor deprivation. J Cell Biol. 1988 Mar;106(3):829–844. doi: 10.1083/jcb.106.3.829. [DOI] [PMC free article] [PubMed] [Google Scholar]
- 10.Schulz JB, Weller M, Klockgether T. Potassium deprivation-induced apoptosis of cerebellar granule neurons: a sequential requirement for new mRNA and protein synthesis, ICE-like protease activity, and reactive oxygen species. J Neurosci. 1996 Aug 1;16(15):4696–4706. doi: 10.1523/JNEUROSCI.16-15-04696.1996. [DOI] [PMC free article] [PubMed] [Google Scholar]
- 11.D’Mello SR. Molecular regulation of neuronal apoptosis. Curr Top Dev Biol. 1998;39:187–213. doi: 10.1016/s0070-2153(08)60456-1. [DOI] [PubMed] [Google Scholar]
- 12.Chiang LW, Grenier JM, Ettwiller L, Jenkins LP, Ficenec D, Martin J, et al. An orchestrated gene expression component of neuronal programmed cell death revealed by cDNA array analysis. Proc Natl Acad Sci U S A. 2001 Feb 27;98(5):2814–2819. doi: 10.1073/pnas.051630598. [DOI] [PMC free article] [PubMed] [Google Scholar]
- 13.Desagher S, Severac D, Lipkin A, Bernis C, Ritchie W, Le Digarcher A, et al. Genes regulated in neurons undergoing transcription-dependent apoptosis belong to signaling pathways rather than the apoptotic machinery. J Biol Chem. 2005 Feb 18;280(7):5693–5702. doi: 10.1074/jbc.M408971200. [DOI] [PubMed] [Google Scholar]
- 14.Zhao S, Fung-Leung WP, Bittner A, Ngo K, Liu X. Comparison of RNA-Seq and microarray in transcriptome profiling of activated T cells. PLoS One. 2014 Jan 16;9(1):e78644. doi: 10.1371/journal.pone.0078644. [DOI] [PMC free article] [PubMed] [Google Scholar]
- 15.Wang L, Wang X, Wang X, Liang Y, Zhang X. Observations on novel splice junctions from RNA sequencing data. Biochem Biophys Res Commun. 2011 Jun 3;409(2):299–303. doi: 10.1016/j.bbrc.2011.05.005. [DOI] [PubMed] [Google Scholar]
- 16.Wang Z, Gerstein M, Snyder M. RNA-Seq: a revolutionary tool for transcriptomics. Nat Rev Genet. 2009 Jan;10(1):57–63. doi: 10.1038/nrg2484. [DOI] [PMC free article] [PubMed] [Google Scholar]
- 17.Mooney M, Bond J, Monks N, Eugster E, Cherba D, Berlinski P, et al. Comparative RNA-Seq and microarray analysis of gene expression changes in B-cell lymphomas of Canis familiaris. PLoS One. 2013 Apr 4;8(4):e61088. doi: 10.1371/journal.pone.0061088. [DOI] [PMC free article] [PubMed] [Google Scholar]
- 18.Patel RK, Jain M. NGS QC Toolkit: a toolkit for quality control of next generation sequencing data. PLoS One. 2012;7(2):e30619. doi: 10.1371/journal.pone.0030619. [DOI] [PMC free article] [PubMed] [Google Scholar]
- 19.Li H, Durbin R. Fast and accurate short read alignment with Burrows-Wheeler transform. Bioinformatics. 2009 Jul 15;25(14):1754–1760. doi: 10.1093/bioinformatics/btp324. [DOI] [PMC free article] [PubMed] [Google Scholar]
- 20.Anders S, Huber W. Differential expression analysis for sequence count data. Genome Biol. 2010;11(10) doi: 10.1186/gb-2010-11-10-r106. R106-2010-11-10-r106. Epub 2010 Oct 27. [DOI] [PMC free article] [PubMed] [Google Scholar]
- 21.Anders S, McCarthy DJ, Chen Y, Okoniewski M, Smyth GK, Huber W, et al. Count-based differential expression analysis of RNA sequencing data using R and Bioconductor. Nat Protoc. 2013 Sep;8(9):1765–1786. doi: 10.1038/nprot.2013.099. [DOI] [PubMed] [Google Scholar]
- 22.Huang da W, Sherman BT, Tan Q, Kir J, Liu D, Bryant D, et al. DAVID Bioinformatics Resources: expanded annotation database and novel algorithms to better extract biology from large gene lists. Nucleic Acids Res. 2007 Jul;35:W169–75. doi: 10.1093/nar/gkm415. Web Server issue. [DOI] [PMC free article] [PubMed] [Google Scholar]
- 23.Borodezt K, D’Mello SR. Decreased expression of the metabotropic glutamate receptor-4 gene is associated with neuronal apoptosis. J Neurosci Res. 1998 Sep 1;53(5):531–541. doi: 10.1002/(SICI)1097-4547(19980901)53:5<531::AID-JNR3>3.0.CO;2-A. [DOI] [PubMed] [Google Scholar]
- 24.Galli C, Meucci O, Scorziello A, Werge TM, Calissano P, Schettini G. Apoptosis in cerebellar granule cells is blocked by high KCl, forskolin, and IGF-1 through distinct mechanisms of action: the involvement of intracellular calcium and RNA synthesis. J Neurosci. 1995 Feb;15(2):1172–1179. doi: 10.1523/JNEUROSCI.15-02-01172.1995. [DOI] [PMC free article] [PubMed] [Google Scholar]
- 25.Nardi N, Avidan G, Daily D, Zilkha-Falb R, Barzilai A. Biochemical and temporal analysis of events associated with apoptosis induced by lowering the extracellular potassium concentration in mouse cerebellar granule neurons. J Neurochem. 1997 Feb;68(2):750–759. doi: 10.1046/j.1471-4159.1997.68020750.x. [DOI] [PubMed] [Google Scholar]
- 26.Murphy LJ. Insulin-like growth factor-binding proteins: functional diversity or redundancy? J Mol Endocrinol. 1998 Oct;21(2):97–107. doi: 10.1677/jme.0.0210097. [DOI] [PubMed] [Google Scholar]
- 27.Harris CA, Johnson EM., Jr BH3-only Bcl-2 family members are coordinately regulated by the JNK pathway and require Bax to induce apoptosis in neurons. J Biol Chem. 2001 Oct 12;276(41):37754–37760. doi: 10.1074/jbc.M104073200. [DOI] [PubMed] [Google Scholar]
- 28.Ginham R, Harrison DC, Facci L, Skaper S, Philpott KL. Upregulation of death pathway molecules in rat cerebellar granule neurons undergoing apoptosis. Neurosci Lett. 2001 Apr 20;302(2–3):113–116. doi: 10.1016/s0304-3940(01)01687-1. [DOI] [PubMed] [Google Scholar]
- 29.Le-Niculescu H, Bonfoco E, Kasuya Y, Claret FX, Green DR, Karin M. Withdrawal of survival factors results in activation of the JNK pathway in neuronal cells leading to Fas ligand induction and cell death. Mol Cell Biol. 1999 Jan;19(1):751–763. doi: 10.1128/mcb.19.1.751. [DOI] [PMC free article] [PubMed] [Google Scholar]
- 30.D’Mello SR, Kuan CY, Flavell RA, Rakic P. Caspase-3 is required for apoptosis-associated DNA fragmentation but not for cell death in neurons deprived of potassium. J Neurosci Res. 2000 Jan 1;59(1):24–31. [PubMed] [Google Scholar]
- 31.Catania MV, Copani A, Calogero A, Ragonese GI, Condorelli DF, Nicoletti F. An enhanced expression of the immediate early gene, Egr-1, is associated with neuronal apoptosis in culture. Neuroscience. 1999;91(4):1529–1538. doi: 10.1016/s0306-4522(98)00544-2. [DOI] [PubMed] [Google Scholar]
- 32.Roschier M, Kuusisto E, Suuronen T, Korhonen P, Kyrylenko S, Salminen A. Insulin-like growth factor binding protein 5 and type-1 insulin-like growth factor receptor are differentially regulated during apoptosis in cerebellar granule cells. J Neurochem. 2001 Jan;76(1):11–20. doi: 10.1046/j.1471-4159.2001.00002.x. [DOI] [PubMed] [Google Scholar]
- 33.Bloodgood BL, Sharma N, Browne HA, Trepman AZ, Greenberg ME. The activity-dependent transcription factor NPAS4 regulates domain-specific inhibition. Nature. 2013 Nov 7;503(7474):121–125. doi: 10.1038/nature12743. [DOI] [PMC free article] [PubMed] [Google Scholar]
- 34.Kristiansen M, Menghi F, Hughes R, Hubank M, Ham J. Global analysis of gene expression in NGF-deprived sympathetic neurons identifies molecular pathways associated with cell death. BMC Genomics. 2011 Nov 8;12 doi: 10.1186/1471-2164-12-551. 551-2164-12-551. [DOI] [PMC free article] [PubMed] [Google Scholar]
- 35.Anderson G, Maes M. Neurodegeneration in Parkinson’s disease: interactions of oxidative stress, tryptophan catabolites and depression with mitochondria and sirtuins. Mol Neurobiol. 2014 Apr;49(2):771–783. doi: 10.1007/s12035-013-8554-z. [DOI] [PubMed] [Google Scholar]
- 36.Bonda DJ, Wang X, Lee HG, Smith MA, Perry G, Zhu X. Neuronal failure in Alzheimer’s disease: a view through the oxidative stress looking-glass. Neurosci Bull. 2014 Apr;30(2):243–252. doi: 10.1007/s12264-013-1424-x. [DOI] [PMC free article] [PubMed] [Google Scholar]
- 37.Camilleri A, Vassallo N. The Centrality of Mitochondria in the Pathogenesis and Treatment of Parkinson’s Disease. CNS Neurosci Ther. 2014 Apr 7; doi: 10.1111/cns.12264. [DOI] [PMC free article] [PubMed] [Google Scholar]
- 38.Fukui H, Moraes CT. The mitochondrial impairment, oxidative stress and neurodegeneration connection: reality or just an attractive hypothesis? Trends Neurosci. 2008 May;31(5):251–256. doi: 10.1016/j.tins.2008.02.008. [DOI] [PMC free article] [PubMed] [Google Scholar]
- 39.Yan MH, Wang X, Zhu X. Mitochondrial defects and oxidative stress in Alzheimer disease and Parkinson disease. Free Radic Biol Med. 2013 Sep;62:90–101. doi: 10.1016/j.freeradbiomed.2012.11.014. [DOI] [PMC free article] [PubMed] [Google Scholar]
- 40.Witte ME, Mahad DJ, Lassmann H, van Horssen J. Mitochondrial dysfunction contributes to neurodegeneration in multiple sclerosis. Trends Mol Med. 2014 Mar;20(3):179–187. doi: 10.1016/j.molmed.2013.11.007. [DOI] [PubMed] [Google Scholar]
- 41.Huang Q, Figueiredo-Pereira ME. Ubiquitin/proteasome pathway impairment in neurodegeneration: therapeutic implications. Apoptosis. 2010 Nov;15(11):1292–1311. doi: 10.1007/s10495-010-0466-z. [DOI] [PMC free article] [PubMed] [Google Scholar]
- 42.Zhang HG, Wang J, Yang X, Hsu HC, Mountz JD. Regulation of apoptosis proteins in cancer cells by ubiquitin. Oncogene. 2004 Mar 15;23(11):2009–2015. doi: 10.1038/sj.onc.1207373. [DOI] [PubMed] [Google Scholar]
- 43.Breitschopf K, Zeiher AM, Dimmeler S. Ubiquitin-mediated degradation of the proapoptotic active form of bid. A functional consequence on apoptosis induction. J Biol Chem. 2000 Jul 14;275(28):21648–21652. doi: 10.1074/jbc.M001083200. [DOI] [PubMed] [Google Scholar]
- 44.Suzuki Y, Nakabayashi Y, Takahashi R. Ubiquitin-protein ligase activity of X-linked inhibitor of apoptosis protein promotes proteasomal degradation of caspase-3 and enhances its anti-apoptotic effect in Fas-induced cell death. Proc Natl Acad Sci U S A. 2001 Jul 17;98(15):8662–8667. doi: 10.1073/pnas.161506698. [DOI] [PMC free article] [PubMed] [Google Scholar]
- 45.Yang Y, Fang S, Jensen JP, Weissman AM, Ashwell JD. Ubiquitin protein ligase activity of IAPs and their degradation in proteasomes in response to apoptotic stimuli. Science. 2000 May 5;288(5467):874–877. doi: 10.1126/science.288.5467.874. [DOI] [PubMed] [Google Scholar]
- 46.Kovalenko A, Chable-Bessia C, Cantarella G, Israel A, Wallach D, Courtois G. The tumour suppressor CYLD negatively regulates NF-kappaB signalling by deubiquitination. Nature. 2003 Aug 14;424(6950):801–805. doi: 10.1038/nature01802. [DOI] [PubMed] [Google Scholar]
- 47.Herrup K, Yang Y. Cell cycle regulation in the postmitotic neuron: oxymoron or new biology? Nat Rev Neurosci. 2007 May;8(5):368–378. doi: 10.1038/nrn2124. [DOI] [PubMed] [Google Scholar]
- 48.Kranenburg O, van der Eb AJ, Zantema A. Cyclin D1 is an essential mediator of apoptotic neuronal cell death. EMBO J. 1996 Jan 2;15(1):46–54. [PMC free article] [PubMed] [Google Scholar]
- 49.Hernandez-Ortega K, Quiroz-Baez R, Arias C. Cell cycle reactivation in mature neurons: a link with brain plasticity, neuronal injury and neurodegenerative diseases? Neurosci Bull. 2011 Jun;27(3):185–196. doi: 10.1007/s12264-011-1002-z. [DOI] [PMC free article] [PubMed] [Google Scholar]
- 50.Lee HG, Casadesus G, Zhu X, Castellani RJ, McShea A, Perry G, et al. Cell cycle re-entry mediated neurodegeneration and its treatment role in the pathogenesis of Alzheimer’s disease. Neurochem Int. 2009 Feb;54(2):84–88. doi: 10.1016/j.neuint.2008.10.013. [DOI] [PMC free article] [PubMed] [Google Scholar]
- 51.Yang Y, Herrup K. Cell division in the CNS: protective response or lethal event in post-mitotic neurons? Biochim Biophys Acta. 2007 Apr;1772(4):457–466. doi: 10.1016/j.bbadis.2006.10.002. [DOI] [PMC free article] [PubMed] [Google Scholar]
- 52.Abe M, Bonini NM. MicroRNAs and neurodegeneration: role and impact. Trends Cell Biol. 2013 Jan;23(1):30–36. doi: 10.1016/j.tcb.2012.08.013. [DOI] [PMC free article] [PubMed] [Google Scholar]
- 53.Kabadi SV, Stoica BA, Byrnes KR, Hanscom M, Loane DJ, Faden AI. Selective CDK inhibitor limits neuroinflammation and progressive neurodegeneration after brain trauma. J Cereb Blood Flow Metab. 2012 Jan;32(1):137–149. doi: 10.1038/jcbfm.2011.117. [DOI] [PMC free article] [PubMed] [Google Scholar]
Associated Data
This section collects any data citations, data availability statements, or supplementary materials included in this article.