

Abstract
Structural coverage of the human kinome has been steadily increasing over time. The structures provide valuable insights into the molecular basis of kinase function and also provide a foundation for understanding the mechanisms of kinase inhibitors. There are a large number of kinase structures in the PDB for which the Asp and Phe of the DFG motif on the activation loop swap positions, resulting in the formation of a new allosteric pocket. We refer to these structures as “classical DFG-out” conformations in order to distinguish them from conformations which have also been referred to as DFG-out in the literature but which do not have a fully formed allosteric pocket. We have completed a structural analysis of almost two hundred small molecule inhibitors bound to classical DFG-out conformations; we find that they are recognized by both type I and type II inhibitors. In contrast, we find that non-classical DFG-out conformations strongly select against type II inhibitors because these structures have not formed a large enough allosteric pocket to accommodate this type of binding mode. In the course of this study we discovered that the number of structurally validated type II inhibitors that can be found in the PDB and that are also represented in publicly available biochemical profiling studies of kinase inhibitors is very small. We have obtained new profiling results for several additional structurally validated type II inhibitors identified through our conformational analysis. Although the available profiling data for type II inhibitors is still much smaller than for type I inhibitors, a comparison of the two datasets supports the conclusion that type II inhibitors are more selective than type I. We comment on the possible contribution of the DFG-in to DFG-out conformational reorganization to the selectivity.
INTRODUCTION
The human genome encodes about 518 protein kinases (PKs) which constitutes one of the largest class of genes, termed the “Human Kinome”1. Protein kinases catalyze chemical reactions that transfer the phosphoryl group of ATP to substrate proteins2. Phosphorylation by kinases regulates cellular signal transduction cascades that orchestrate most cellular processes3. It is not surprising therefore that dysregulation of protein kinase function has been implicated in many pathological conditions. Kinases serve as therapeutic targets for a range of clinical indications and represent the largest category of drug targets in current clinical trials4.
Progress in kinase structural biology offers a conceptual framework for understanding many aspects of kinase biology and accelerating drug discovery programs targeting protein kinase. The global fold of the catalytic domain of all eukaryotic protein kinases (ePKs) reveals a common bi-lobal fold consisting of a smaller N-terminal and a larger C-terminal lobe connected by a “hinge”. The N lobe contains a 5 stranded β sheet and an alpha helix called the “αC-helix”, whereas the C-lobe is mostly alpha helical5.
The cofactor, ATP binds to a highly conserved pocket that is localized deep between the two lobes and forms hydrogen bonds with the “hinge” region5,6. A single residue in the ATP binding pocket located in the hinge region between the N and C lobes of the kinase separates the adenine binding site from an adjacent hydrophobic pocket and controls access to the hydrophobic pocket7. This residue is termed the “gatekeeper” residue. Gatekeeper mutations that convert the threonine gate keeper residue to a larger hydrophobic residue have been shown to confer drug resistance8, particularly against most approved ABL inhibitors like imatinib9.
The C-terminal domain contains a flexible activation loop, typically 20–30 amino acids in length and marked by a conserved Asp-Phe-Gly (“DFG”) motif at the start. Phosphorylation of the activation loop is one common mechanism for kinase activation. The other well conserved motif is the His-Arg-Asp (“HRD”) triad motif that precedes the activation loop, and this plays a major role in catalysis. These sequence features are well conserved across kinase subfamilies10. X-ray crystal structures of kinases available in the Protein Data Bank (PDB)11 reveal remarkable conformational heterogeneity ranging between active (on state) and inactive (off state) conformations12.
In an active state conformation the aspartate of the DFG motif points into the ATP-binding site and coordinates 2 Mg++ ions5, with the activation loop displaying an open and extended conformation. The other hallmark feature of an active state conformation is the orientation of the αC helix located on the N-terminal domain; in an active conformation it is rotated inward toward the active site, together with a characteristic ion-pair interaction between the conserved Glu of the αC helix and the Lys of the β3 strand of the β sheet in the N lobe5, 10, 13. The integrity of this ion pair interaction is crucial for kinase activity. It should be noted that this structural criterion for an active state is not always sufficient, as additional regulatory elements outside of the kinase domain may be required for activation14. Catalytically active kinase conformations (on-state) are highly conserved, owing to the evolutionary pressure for functional preservation15. However, the mechanism by which each kinase is auto-inhibited (off-state) is not constrained and varies considerably. This is reflected in the range of distinct inactive conformations seen for different subfamilies.
The crystal structure of an auto-inhibited (inactive) state of c-Src tyrosine kinase was first inative conformation to be characterized in 199716. The other inactive conformation seen in kinases corresponds to a flipped conformation of the DFG motif, wherein the aspartate of the DFG motif flips by ≈180º relative to the active state conformation. This results in Asp and Phe residues swapping their positions. The flipped DFG motif moves the aspartate away from the ATP binding site by ≈5Å leading to a catalytically incompetent state termed the “DFG-out” state. Importantly, the “DFG-out” state opens a new allosteric pocket, directly adjacent to the ATP binding pocket17, 18. This unique “DFG-out “inactive conformation was first observed in an unliganded insulin receptor kinase19, Kuriyan and co-workers (2000)17, showed that small molecules capable of recognizing this distinct inactive conformation offer selective kinase inhibition.
The serendipitous discovery of Gleevec (imatinib) binding to the new allosteric pocket in this DFG-out conformation, spurred great interest towards the development of inhibitors specifically targeting the inactive DFG-out conformation 17,18. While the exact number of discrete inactive conformations in kinases is yet to be established20, these two distinct inactive conformations are often observed in the PDB. DFG-in active and DFG-out inactive conformations are illustrated in Figure 1.
Figure 1.

Left panel shows a DFG-in conformation of ABL kinase bound to dasatinib, with the Asp pointing in to the ATP binding site, and the right panel shows a DFG-out conformation of the ABL kinase domain bound to imatinib, with the Phe pointing into the ATP binding pocket. The binding pockets are shown in a mesh representation colored red. The DFG-out structure shows that Phe and Asp have swapped their positions in relation to DFG-in conformation. The flipped orientation also opens up an allosteric pocket highlited in red dashes.
In general, small molecule kinase inhibitors that bind to kinases are broadly categorized into four major classes based on their binding mode21. The majority of approved kinase inhibitors are type I inhibitors, which target the ATP binding pocket and also termed as ATP competitive inhibitors. Type II inhibitors bind to the hydrophobic pocket adjacent to the ATP binding pocket, which is accessible only in a DFG-out conformation. Although occupancy at the allosteric site is characteristic of type II inhibitors, they also extend past the “gate keeper” into the adenine pocket and form hydrogen bonds with the “hinge” residues. There are also examples of type II inhibitors that occupy only the allosteric pocket without extending into the adenine binding pocket22.
Type III inhibitors are not ATP competitive, they bind to an allosteric pocket opposite to the ATP binding pocket, termed the “back pocket”. They do not form any hydrogen bonding interaction with the “hinge” residues. This class of compounds is also known to induce conformational changes in the activation loop, forcing the αC helix to adopt an inactive conformation23.
Type IV inhibitors refers to compounds that bind to any allosteric sites distant from the ATP binding pocket. They induce conformational changes that render the kinase inactive24.
Structural coverage of the human kinome has been steadily increasing over time, with deposition coming from academia, industry and the structural genomics consortium (SGC)25. To harness the wealth of information from a growing number of kinases, several secondary databases like KLIFS26, and KIDFamMap27 have been developed. These databases offer an accessible, consolidated kinase repository, which helps in systematic mining of kinase-small molecule interaction fingerprints, and inhibitor activity/binding affinity data. Kinase SARfari28 hosted by EMBL-EBI provides an open source chemogenomics platform that links kinase sequence, structure, inhibitors and screening data. In addition to these databases, Zhao et al 29 recently compiled and analyzed a set of 227 DFG-out kinase structures in an effort to understand which kinase subfamilies can adopt a DFG-out conformation. However, classification of kinase conformations in these databases is largely subjective, based on visual inspection.
In this study we focus on a commonly observed type of DFG-out conformation, which we label “classical DFG-out”, where the D and the F of the DFG motif have swapped positions. We provide simple structural criteria for identifying “classical DFG-out” conformations and relate this information to the requirements for binding type II inhibitors. Our analysis also provides statistics concerning the coverage of “classical DFG-out” structures in the PDB, and the number of kinase subfamilies that exhibit a classical DFG-out inactive state. Analysis of kinase structures with bound type II inhibitors in the PDB across kinase families provides information that could help in rationalizing the promiscuity of some type II inhibitors, and facilitates an improved understanding of the structural requirements required for a type II binding mode.
We find many structures in the (KLIFS26 and Zhao et al29) databases which have been classified as “DFG-out” or “DFG-out like” do not satisfy our structural definition of “classical DFG-out”. We refer to these structures as “non-classical DFG-out”. We find that, with very few exceptions, these “non-classical DFG-out” structures cannot accommodate a type II inhibitor. Our analysis of DFG-out structures in the PDB therefore points to the existence of a range of non-classical DFG-out inactive states, which appear to be structurally incompatible with the accommodation of a type II inhibitor binding mode.
The 149 type II inhibitors found in the PDB using our structure based method for identifying DFG-out conformations (the structurally validated type II inhibitor set) were mapped onto three publicly available large scale kinase profiling studies. Surprisingly, we find that only 11 of the 149 had a corresponding kinase activity profile reported in the literature against a larger kinase panel. Therefore, in connection with our current study we have obtained new profiling results for 9 additional structurally validated type II inhibitors. When combined with our previous biochemical profiling study (Anastassiadis et al)30, this constitutes the largest publicly available profiling dataset for structurally validated type II inhibitors.
RESULTS AND DISCUSSION
Identification of “classical DFG-out” kinase conformations
All kinase structures deposited in the Protein Data Bank (PDB) through March 2014 were retrieved as detailed in the Methods section. Our analysis was not confined to the human kinases, but was broadened to encompass closely related non-human orthologues. This was done to ensure adequate coverage, so that each member of a human kinase subfamily is represented at least by its closest homologue.
A general structural feature of an activated kinase is that the Asp of the DFG motif pointing into the ATP binding site where it coordinates 2 Mg++ ions. In a typical inactive DFG-out conformation, the Asp and Phe residues swap positions, following which the Asp points away from the ATP binding pocket and the Phe points towards the ATP binding pocket. The movement of Phe into the ATP binding pocket creates an adjacent hydrophobic pocket, which results in a larger pocket volume. An earlier study has emphasized that the movement of Phe into the ATP binding site brings about a significant conformational change that perturbs the hydrophobic regulatory spine (R-spine) and the catalytic spine (C-spine)31. Based on these structural observations, we find the position of the DFG Phe residue with respect to two well conserved residues namely, the Asn that follows the HRD motif, and the Glu of the αC-helix which forms a salt bridge with the Lys of the β3 strand, could serve as indicators to identify whether or not the Asp and Phe residues had swapped positions with respect to the ATP active site. The Asn that follows the HRD motif (HRDxxxxN) in the catalytic loop is highly conserved both in sequence and conformation. Asn plays a structural role in maintaining the integrity of the ATP-binding pocket and biochemically it acts as a catalytic base that abstracts a proton from the substrate hydroxyl group.
We found that the conformational change associated with the Asp-Phe swap and the formation of the new allosteric pocket could be tracked using two distance measurements (D1 and D2):
D1, the Cα atom distance between the Asn of the HRDxxxxN motif (The first Asn residue that follows the HRD motif) and Phe of the DFG motif
D2, the Cα atom distance between the conserved Glu belonging to the αC-helix, and Phe of the DFG motif.
Although, the position of Asp belonging to the DFG motif is not accounted for in the distance calculations, its relative position is indirectly accounted because, Asp and Phe swap positions during a classical DFG flip and the position of Asp and Phe are highly correlated. Furthermore, the opening of the allosteric pocket is largely defined by the position of Phe of the DFG motif, and in this sense tracking the position of Phe is more fundamental than tracing Asp.
Based on a visual analysis of a few representative structures and subsequent K-means clustering employing an unsupervised approach, we labeled those conformations for which D1 < 7.2Å and D2 > 9Å as “classical DFG-out” conformations. PDB entries that satisfy this criterion were considered for analysis and were annotated based on the kinase and the inhibitor class (Supplementary File S1). A schematic representation of the distinct DFG-in and DFG-out conformational states illustrating the flipped orientation of residues D and F belonging to the DFG motif along with the two distances (D1 and D2) is shown in Figure 2.
Figure 2.
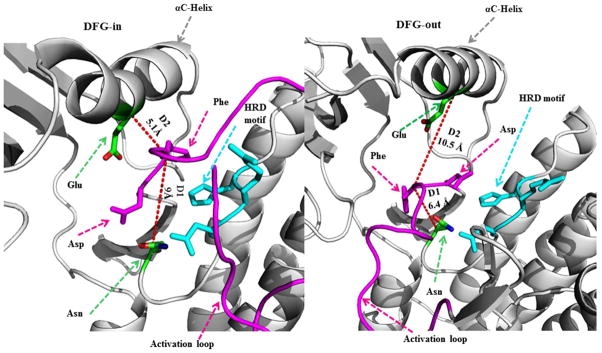
Schematic representation of the distance criteria D1 and D2 used for classifying conformations as DFG-in and DFG-out. The marked residues used for calculating the distances are colored green and shown in stick representation.
Scatterplots of these two distances (D1) and (D2) shown in Figures 3A and 3B, shows a clear separation of classical DFG-out conformations from other kinase structures. In Figure 3A, we show a k-means clustering of these data points with k=5. Visual examination of structures in the black cluster demonstrated that these structures are consistent with “classical DFG-out” conformations that bind known type II inhibitors such as imatinib. They are characterized by short Phe/Asn distances (D1≤7.2 Å) and long Phe/Glu distances (D2≥9.0 Å).
Figure 3.

A. Scatter plot of the D1 and D2 distances. D1 is the DFG Phe to Asn at HRD+5 distance. D2 is the DFG Phe to salt-bridge Glu distance. The points are colored according to a k-means clustering with k=4. B. The same points colored according to a cutoff scheme that recapitulates the black cluster shown in A {D1≤7.2; D2≥9.0}, while kinases labeled DFG-out by KLIFS26 and Zhao et al29 but not contained in this box are shown in magenta. DFG-in and other kinases are shown in green.
In Figure 3B, we color points within these cutoffs black and kinases characterized by KLIFS26 and Zhao et al29 as “DFG-out/DFG-out like” but not within this region magenta. All others are colored green. We designate those in the box {D1≤7.2; D2≥9.0} as classical DFG-out, while the magenta points are designated non-classical DFG-out.
Comparison with previously annotated datasets: binding of type II inhibitors to “non-classical DFG-out” conformations is rare
Our structure based method of identifying “classical DFG-out” conformations was compared with two previously annotated datasets, namely KLIFS26 and the Zhao et al data sets29 available in the public domain. The classification of the DFG-out motif in these datasets was primarily based on visual inspection. Some differences between datasets were anticipated, as the KLIFS26 dataset considered only human kinases, whereas our dataset includes non-human orthologues. Secondly, there are some differences that can be attributed to the date when the PDB repository was accessed. A Venn diagram showing the overlapping relationship between the three data sets is provided in Figure 4.
Figure 4.

A Venn representation showing the relation between the three data sets. The respective PDB ids are provided in Supplementary File S2.
There are 257 kinase structures in the PDB that satisfy our structural criteria according to which we classify them as “classical DFG-out”. Of these, 185 are also present and annotated as DFG-out or “DFG-out like” in one or both of the KLIFS26 and Zhao et al29 datasets; while 72 of the structures which we have classified as classical DFG-out are not found in KLIFS25 or Zhao et al29. To further characterize the distinctiveness of the three categories: classical DFG-out, non-classical DFG-out and DFG-in and others, we measured the RMSD of DFG motif with respect to PDB:1IEP, a well-accepted Abl-Gleevec DFG-out conformation. The RMSD distribution (Figure 5) shows three distinct peaks, with classical DFG-out most separated from the others.
Figure 5.

The RMSD distribution of classical DFG-out, non-classical DFG-out and DFG-in and others structures with respect to a classical DFG-out conformation PDB:1IEP
We also find that 51 PDB entries annotated as “DFG-out” or “DFG-out like” in the KLIFS26 and Zhao et al29 datasets based on visual characterization, do not satisfy our structural criteria; an additional 21 entries had missing coordinates which precludes our calculation. We have analyzed these 51 entries with a particular focus on the binding modes of the inhibitors which bind to “non-classical DFG-out” conformations. An example of a non-classical DFG-out kinase conformation is shown in Figure 6.
Figure 6.

A non-classical DFG-out conformation, which cannot accommodate a type II inhibitor
We find that 47 entries had either a type I inhibitor, type III inhibitor, ATP analogue or no inhibitor bound to a non-classical DFG-out conformation. We find that only 4 PDB entries had a type II inhibitor bound to a non-classical DFG-out conformation.
It is apparent from this result that the binding of type II inhibitors to “non-classical DFG-out” conformations is rarely observed. There are two main reasons for this. Either, as we observe for most “non-classical DFG-out ” structures, the allosteric pocket that must be formed in order for type II inhibitors to bind is too small, or in some cases the Asp residue of the DFG motif is not fully “flipped”, and consequently the Asp carboxylate group occludes the allosteric pocket so that a type II inhibitor cannot bind.
Of the four non-classical DFG-out entries in the PDB complexed to type II inhibitors, two (3NAX and 3QC4) belong to the PDK1 kinase sub family. We find that this kinase subfamily has a distorted αC-helix conformation, unique to this subfamily. The other two PDB entries 3LFD and 3HNG belong to the p38 MAP kinase and VEGFR1 kinase subfamilies respectively. They had distance measures (D1=7.4Å), whose values are slightly greater than our cutoff (D1 < 7.2Å) for being classified as classical DFG-out.
Structural coverage of the “classical DFG-out” conformation in the kinome
Phylogenetic classification of all structurally characterized “classical DFG-out” conformations was carried out by mapping structures onto the kinome phylogenetic tree1 based on their UniProt IDs32. We find that examples within 44 unique kinase subfamilies, as classified by Manning et al1, adopt a “classical DFG-out” kinase conformation. This corresponds to a structural coverage of 22%, based on the current estimated total structural coverage (~197) of the human kinome33. This may simply reflect sampling bias or it could imply that classical DFG-out conformations have a relatively low occurrence on the kinome for reasons which reflect underlying thermodynamic propensities. We also find the distribution of “classical DFG-out” conformations to be uneven across the kinome. Structural coverage of “classical DFG-out” conformations based on kinase group and subfamily is provided in Table 1.
Table 1.
Structural coverage of classical DFG-out conformations in the PDB based on kinase group and subfamilies.
| Kinase Group | Total number of structures in the PDB for each group | Number of kinase subfamilies represented in the PDB for each group | Total number of subfamilies for each group in the kinome |
|---|---|---|---|
| AGC | 4 | 2 | 63 |
| CAMK | 5 | 4 | 82 |
| CMGC | 99 | 8 | 61 |
| STE | 2 | 1 | 48 |
| TK | 115 | 23 | 94 |
| TKL | 20 | 4 | 43 |
| CK1 | 0 | 0 | 12 |
| Other | 9 | 2 | 83 |
| Total | 257 | 44 | 486 |
Structural coverage based on kinase group reveals the tyrosine kinase (TK) group had the largest structural representation (24.5%), with 23 of 94 kinase subfamilies having a classical DFG-out structure in the PDB. While this could imply that a “classical DFG-out” conformation is easily accessible for the TK group it is more likely due to overrepresentation of these kinases in the PDB, given their profound pharmaceutical interest. Structural coverage of classical DFG-out kinase conformations on the kinome tree is shown in Figure 7.
Figure 7.

Kinome wide distribution of “classical DFG-out” conformation mapped on to the human kinome phylogenetic tree. Image generated using KinomeRender34. Kinase groups are abbreviated according to Manning et al1. Color coding employed for each kinase subfamily signifies the number of structures each subfamily had in PDB. Red > 10, Green > 5 <10, Black signifies < 5. Illustration reproduced courtesy of Cell Signaling Technology, Inc. (www.cellsignal.com)
Inhibitor binding modes observed in PDB complexes with “classical DFG-out” conformations
Of the 257 “classical DFG-out” kinase structures retrieved using our structure based method, small molecule inhibitors were observed to be bound in most (237) of the structures. By visual inspection, we found that classical DFG-out conformations are bound by type I, type II and type III inhibitors. We did not find any examples of type IV inhibitors bound to a classical DFG-out conformation in our dataset. The unique number of type II inhibitors in the PDB is 149 (2D structures of the type II inhibitors are provided in the Supplementary File S3).
A general molecular framework that defines a type II inhibitor consists of a heterocyclic “head” group that recognizes the kinase hinge region, an amide or a urea based linker that traverses across the kinase “gatekeeper” residue and a “tail” scaffold that occupies the hydrophobic allosteric pocket created by the flip of the “DFG” motif. Scaffold decomposition and R group analysis were undertaken on these 147 unique structurally validated type II inhibitors, to identity privileged fragments that can sample the allosteric pockets of various kinases. This has important implications in guiding the exploration of chemistry space and in designing focused libraries of type II kinase inhibitors (sees Supplementary File S4 for a list of privileged fragments bound to the allosteric pocket).
A few type II inhibitors like imatinib, were found to be complexed to multiple kinases in the PDB. We analyzed the binding mode of these type II inhibitors when bound to different kinase subfamilies in a DFG-out conformation. We find that the binding modes of such inhibitors are similar across kinases. This reiterates the finding that the binding mode of type II inhibitors is well maintained across kinases.
There are a large number of type I inhibitors that bind to classical DFG-out conformations as well. These inhibitors have little or no preference for phosphorylated versus non-phosphorylated forms of kinase, as evident from biochemical assays35. Structurally, the existence of an accessible ATP pocket even in a DFG-out conformation enables ATP competitive type I inhibitors to bind to classical DFG-out conformations of kinase. Similarly, allosteric type III inhibitors interact with non-conserved residues and they are kinase specific and exert considerable selectivity. There are relatively few type III inhibitors that have been discovered to date, we observe that 2 of these were bound to kinases in a classical DFG-out conformation. A summary of the inhibitors bound to classical DFG-out conformations, classified based on their binding mode is provided in Table 2.
Table 2.
Summary of the number of small molecule inhibitors of each type bound to classical DFG-out conformations.
| Inhibitor class | Total number of inhibitor bound classical DFG-out conformations | Number of unique inhibitors |
|---|---|---|
| Type I | 47 | 42 |
| Type II | 185 | 147 |
| Type III | 2 | 2 |
Overall, we observe a total of 189 complexes in the PDB with a type II inhibitor bound to a kinase. One hundred and eighty five of these complexes correspond to inhibitors bound to “classical DFG-out” conformations of the kinase, while only 4 are observed to bind to non-classical DFG-out conformations. We find that a few kinases like CDK6, AKT2, STK1, KIT, p38alpha, CSF1R, and PAR1exhibit a classical DFG-out conformation even in an unliganded state.
It was originally thought that type II inhibitors are sensitive only to kinases with small “gate keeper” residues, whereas kinases with larger “gate keeper” residue restricts access to the allosteric pocket36. We have identified the “gate-keeper” residue for all type II inhibitor bound kinase complexes. Threonine, as a gate keeper had the highest representation, it was found to occur in 68% of the type II inhibitor bound complexes. Other small size gate keeper residues seen in type II inhibitor bound complexes are Val (5%) and Ala (0.5%). Medium size gate keeper residues like Leu (5%), Ile (5%) and Met (10%) were also found to occur in type II bound complexes. The only large amino acid that was found to occur at the gate keeper position was Phe (5%).
Historically, the classification of type I and type II inhibitors was related to the conformation of the DFG motif to which the inhibitors are bound. While it is true that type II inhibitors cannot bind to DFG-in conformations and we conclude that the binding of type II inhibitors to non-classical DFG-out conformations is rare, the converse is not true. We find many examples of type I inhibitors binding to classical DFG-out conformations in a binding mode that is more similar to the way type I inhibitors bind to DFG-in conformations. Type I inhibitors are not conformation specific. They bind to the adenosine binding pocket and form hydrogen bonds with the kinase hinge region. Hence, the added qualification that type I inhibitors only bind to active kinase conformations (DFG-in) and that only type II inhibitors select for and stabilize inactive DFG-conformations is not accurate. We find that many kinases adopt a classical DFG-out conformation when bound to a type I inhibitor, implying that a DFG-out inactive conformation can be stabilized in the presence of a type I inhibitor for some kinases. Kinase inhibitors like dasatinib and sunitinib are examples of approved type I inhibitors, which exhibit a type I binding mode when bound to a DFG-out conformation (PDB ID: 3OHT, 3GOF).
DFG-out in many ways - The dilemma in classifying DFG-out conformations
The classification of DFG-out conformations is often simplified as “DFG-out” if Asp is oriented away from the ATP binding pocket. Although this definition of DFG-out is frequently associated with the binding of specific kind of inhibitors, it is not necessarily a strong predictor of type II inhibitor binding as there are many examples of type I inhibitors binding to classical DFG-out conformations. In contrast, our analysis reveals an array of alternate (non-classical) DFG-out inactive conformations that cannot accommodate a type II inhibitor. The existence of non-classical DFG-out inactive states is fairly common, and the kinase literature is replete with different naming conventions like DFG-out like26, DFG-up37, Pseudo DFG-out38 and atypical DFG-out conformations39. We speculate that these atypical DFG-out conformations may be metastable intermediate states that have been trapped during a DFG-in to DFG-out transition. The availability of diverse inactive conformations in the PDB provides targets for developing conformation selective kinase inhibitors.
Binding pocket volume calculations reveal that on average, non-classical DFG-out conformations have a significantly reduced pocket volume (~283Å3 less) in relation to classical DFG-out conformations (shown in Figure 8A). A larger DFG-out pocket is crucial in order to accommodate type II inhibitors. Our analysis of the inhibitors bound to classical DFG-out conformations shows that type II inhibitors only bind to “classical DFG-out conformations”.
Figure 8.

A: Distribution profile of the pocket volume of classical and non-classical DFG-out kinases. B: Distribution profile of the pocket volume of “classical DFG-out” kinase conformations when complexed to type I and type II inhibitors. The number of structures of each type is indicated.
While type II inhibitors require a larger pocket volume that is only accessible to kinases in a “classical DFG out” conformation, type I inhibitors can bind to both “classical” (large pocket) (see Figure 8B) and non-classical (small pocket) DFG-out conformations.
Almost all of the “classical DFG-out” conformations bound to type II inhibitors had the aC helix displaying an outward shift, compared to “DFG-in” conformations as annotated in KLIFS. This implies that the formation of a “classical DFG-out” conformation is accompanied by a concomitant large scale movement of the αC-helix. This conformation of the αC helix seen in “classical DFG-out” conformation is different from Src like (DFG-in/αC-helix out) inactive conformations. In a Src like inactive conformation the αC-helix also tends to be rotated outwards, with the ion-pair interaction between the conserved Glu of the αC helix and the Lys of the β3 strand disturbed. We find that the “classical DFG-out” conformation, although it induces a translational motion of the αC-helix, maintains the ion-pair interaction intact in almost all (90%) of the structures (see Supplementary File S1 for details of αC-helix, and ion pair integrity annotations).
Although the KLIFS database labeled these as “αC-out”, we label those αC-helix conformations seen in “classical DFG-out” conformations as “αC-dilated” to distinguish them from “αC-in” conformations evident in “DFG-in” conformational states, and the “αC-out” conformation seen in the Src like inactive state. To classify the αC-helix conformation, the distance between the Cα atoms between the conserved Glu of the αC-helix and the Asp of the DFG motif was calculated. Conformations having a distance < 9Å were annotated as αC-in, others falling within a distance range > 9 Å but < 10.5 Å were annotate as αC-dilated and those with distance >10.5 Å were annotated as αC-out40.
Are type II inhibitors more selective than type I inhibitors? Large scale profiling of some structurally validated type II inhibitors
Cross-reactivity within kinase targets is an inherent property of most kinase inhibitors. Biochemical profiling studies of kinase inhibitors are becoming more widely used to assess the selectivity of inhibitors against large panels of kinases. It has been reported that type II inhibitors are more selective than type I inhibitors. The basis of the selectivity was originally thought to be the inability of many kinases to adopt an inactive DFG-out conformation17. In addition, the residues that surround the allosteric pocket exposed in the DFG-out conformation are less conserved across kinases and this presumably facilities the design of ligands with high specificity. Recently this view of the enhanced selectivity of type II inhibitors has been questioned29,41.
To understand the kinome wide inhibition potential of kinase inhibitors large scale kinase profiling studies have been conducted by Anastassiadis et al 30 (178 kinase inhibitors against 300 kinases) Davis et al 35 (72 kinase inhibitors against 442 kinases) and Metz et al 42 (3858 compounds tested against 172 kinases, of which only 1497 compounds had their structure disclosed). In addition to these datasets, the Gray laboratory has also recently reported profiling data for their type II inhibitor compound collection29.
Combining kinase structural data available in the PDB with large scale profiling data provides an opportunity to try to better understand the role of sequence and structure in driving selectivity and promiscuity. Hence, structurally validated type II inhibitors identified from our work described here was mapped onto these large scale kinase profiling studies.
To our surprise we found that only 11 of the 147 structurally validated type II inhibitors identified from our analysis are included in these large scale profiling studies. They are listed in table 3 provided below.
Table 3.
Structurally validated type II inhibitors with a reported kinase activity profile mapped onto their corresponding PDB ids. Yes/No signifies its representation in a particular kinase profile.
| PDB | Type II inhibitor | Metz et al | Davis et al | Anastassiadis et al | Zhao et al |
|---|---|---|---|---|---|
| 1IEP | imatinib | Yes | Yes | Yes | Yes |
| 1KV2 | Doramapimod | Yes | Yes | No | Yes |
| 1UWH | Sorafenib | Yes | Yes | Yes | Yes |
| 4AT4 | 103904277 | Yes | No | No | No |
| 4AT5 | 103905623 | Yes | No | Yes | No |
| 3CS9 | Nilotinib | No | Yes | Yes | Yes |
| 3EFL | Motesanib | No | Yes | No | Yes |
| 3LQ8 | Foretinib | No | Yes | No | Yes |
| 3DKO | ALW-II-49-7 | No | No | No | Yes |
| 3DZQ | ALW-II-38-3 | No | No | No | Yes |
| 4G9R | AZ-628 | No | No | No | Yes |
Of these datasets, only Davis et al 35 had explicitly annotated whether the inhibitors were type I or II; their profiling set included 13 type II inhibitors. Their annotation was based on the activation state dependent binding of kinase inhibitors. Type II kinase inhibitors bind preferentially to the inactive state (nonphosphorylated state), whereas the sensitivity of type I inhibitors are activation state independent (phosphorylation state-independent). We find that two of the inhibitors PLX-4720 (PDB ID: 3C4C) and AZD 1152HQPA/barasertib (PDB ID:4C2V) which were annotated as type II inhibitors in the Davis et al35 dataset based on their preference towards a non-phosphorylated form of kinase, structurally do not exhibit a type II binding mode. The other two datasets (Anastassiadis et al 30 and Metz et al42) also contained very few structurally verified representative type II inhibitors, although these two datasets were not annotated based on inhibitor class.
Attempting to compare results between disparate profiling data sets has limitations because of differences in the profiling technology employed, the assay formats, kinase construct used, activation states of kinases etc41. With this in mind, we have not attempted to aggregate the results of different profiling studies.
To complement our previous profiling study (Anastassiadis et al 30) and to provide additional data that can be used to characterize the selectivity profiles of type II inhibitors, we carried out profiling studies on 9 new structurally validated type II inhibitors that were commercially available. Profiling studies were carried out using a high-throughput enzymatic assay against a large panel of 350 protein kinases using Reaction Biology Corporation HotSpotSM technology (see methods). A complete listing of the kinase constructs used is provided in Supplementary File S5. The profiling data obtained for the 9 new inhibitors are publically through the Kinase Inhibitor Resource database (kir.fccc.edu) and also provided in Supplementary File S6. Each kinase-inhibitor pair was tested in duplicate and the percent remaining kinase activity as a percentage of solvent control reactions was reported. Scatter plots (provided in Methods section) illustrates good concordance in activity between the replicates and thus validates the reproducibility of the assay.
To quantify kinase inhibitor selectivity, we computed Gini coefficients43 for each newly screened compound as well as for each compound screened in two prior large-scale profiling screens. The Gini coefficient is a metric that is a quantitative measure of distribution and ranges from 0 (equal distribution or all kinases are inhibited equally by an inhibitor) to 1 (complete unequal distribution or 1 kinase is the only target of an inhibitor). A histogram displaying the distribution of Gini coefficients calculated based on kinase activity converted from the reported Kd values for the compounds in the Davis et al35 is presented in Figure 9A. A histogram that includes Gini coefficients for the 9 new profiled compounds together with the data from Anastassiadis et al30 profiling study is presented in Figure 9B. The data from Davis et al35 and Anastassiadis et al30 were not compiled together since the studies employed different profiling methods and different kinase constructs.
Figure 9.

A: Distribution profile of the Gini coefficient values of type I and type II inhibitors obtained from Davis et al data. B: Global selectivity trends observed for type II inhibitors in relation to type I inhibitors based on the new profiling data (9 type II compounds) and our previous Anastassiadis et al30 dataset (4 type II compounds). The difference between the means of the Gini coefficients for the two inhibitor classes is statistically significant (detail see Methods).
These data suggest that type II inhibitors are indeed more selective than type I inhibitors. However, it is not clear whether this reflects real differences between the structural requirements for type I and type II inhibitor binding, or rather there is insufficient profiling data available for type II inhibitors from which a valid comparison can be made. Hence, we carried out various statistical significance tests to ascertain if the observed difference between the Gini coefficients for type I and type II inhibitors is statistically significant (see Methods). The analysis supports the conclusion that the greater selectivity of type II inhibitors compared with type I inhibitors is statistically significant. Comparison of the mean Gini coefficients among type I and type II inhibitors based on our profiling study shows a statistically significant p-value of <10^-4 (see Methods)
We note that the selectivity profile summarized in Figure 9 and kinase profiling data (provided in provided in Supplementary File S6) constitutes the largest profiling study available in the public domain for structurally validated type II inhibitors obtained from a consistent assay source.
The selectivity profile of the 13 structurally validated type II inhibitors are provided in Table 4 ordered by their Gini coefficient values.
Table 4.
Gini coefficient calculated based on the kinase activity profile for 13 structurally validated type II inhibitors and 4 structurally validated type I inhibitors. Compounds marked by an asterisk have been previously profiled previously by us in an earlier study (Anastassiadis et al30).
| Inhibitor Name | CAS ID | Inhibitor class | Gini Coefficient |
|---|---|---|---|
| Motesanib | 453562-69-1 | Type II | 0.80 |
| Bafetinib | 859212-16-1 | Type II | 0.79 |
| AZ-628 | 878739-06-1 | Type II | 0.79 |
| Sorafenib* | 284461-73-0 | Type II | 0.79 |
| cFMS Receptor TK Inhibitor* | 870483-87-7 | Type II | 0.78 |
| Nilotinib* | 641571-10-0 | Type II | 0.77 |
| BRAF Inhibitor 1 | 1093100-40-3 | Type II | 0.77 |
| Doramapimod | 285983-48-4 | Type II | 0.76 |
| Imatinib* | 220127-57-1 | Type II | 0.76 |
| BMS-777607 | 1025720-94-8 | Type II | 0.72 |
| Tivozanib | 475108-18-0 | Type II | 0.71 |
| Foretinib | 849217-64-7 | Type II | 0.71 |
| Rebastinib | 1020172-07-9 | Type II | 0.64 |
| Dasatinib* | 302962-49-8 | Type I | 0.74 |
| Sunitinib* | 557795-19-4 | Type I | 0.52 |
| Dorsomorphin* | 866405-64-3 | Type I | 0.57 |
| Indirubin Derivative E804* | 854171-35-0 | Type I | 0.49 |
A previous study29 found that a small library of 36 type II inhibitors targeted 220 kinases, leading these authors to the conclusion that type II inhibition does not confer a selective advantage. However, 2 of the 36 inhibitors, foretinib and NVP-AST487, inhibited ~192 kinase targets, 66 of which are not inhibited by other type II inhibitors (data shown in Supplementary File S7). While foretinib is a structurally validated type II binder, NVP-AST487 was inferred to be a type II inhibitor based on biochemical data, and not structural data. Our analysis of binding modes of profiled type II compounds from Davis et al35 data suggests that inferring structural insights from phosphorylated state dependent assays has limitations. Although, it is unclear why foretinib and NVP-AST487 are promiscuous, the possibility that these inhibitors could have kinase specific binding modes cannot be rule out. Based on the data that we have presented, we suggest that type II inhibitors are generally more selective than type I inhibitors.
The DFG-out –DFG-in Free Energy Landscape
The discovery of imatinib binding to an inactive kinase conformation spurred great interest in the development of type II kinase inhibitors, as it suggested an interplay between inhibitor specificity and large scale kinase conformational changes. Much of the structure based experimental and computational analysis has focused on understanding the mechanism of selectivity of imatinib to Abl over c-Src44–49, and the possible role of conformational transitions involving the DFG-in to DFG-out transition50–52. A molecular dynamics simulation using a Gō type potential carried out by Hunag et al51 found that the αC-helix acts as a switch controlling the conformational transition between the active and inactive states.
Imatinib binds 2,000 to 3,000 times more strongly to Abl than to c-Src despite high sequence homology and what appear to be very similar binding modes53. Based on earlier structural studies it was suggested that the inactive DFG-out conformation is energetically unfavorable for c-Src as compared with Abl44 and the results of modeling studies and more recent molecular dynamics free energy simulations of the DFG-in/DFG-out transition support this view45,46. However, the discovery of some imatinib derivatives which are equipotent against Abl and c-Src, overturned the earlier view53,54. The new finding lead to the suggestion that the imatinib selectivity results from differences in protein-ligand interactions, arising from a closed/folded P loop conformation, which closes off the adenine pocket in Abl but not in Src. The closed conformation of the P loop in Abl, shields imatinib from being solvent exposed and provides more van der Waals surface area for interaction.
According to this view, the orientation of the P loop provides the basis for selectivity rather than the reorganization penalty associated with the transition of c-Src from the active to the inactive state53,54, and by extension the role of conformational selection in the selectivity of type II inhibitors has been called into question. Furthermore, whether there even is a selectivity advantage of type II inhibitors over type I inhibitors has been questioned as well29,41. While the results of the new biochemical profiling presented in this study suggest that there is a selectivity advantage of type II inhibitors over type I inhibitors, a much larger set of type II inhibitors will need to be profiled to place this conclusion on firmer grounds.
The binding of an inhibitor to a kinase can be written in a very general form:
where ΔGreorg is the free energy cost to transform the ligand and the receptor from the initial ensemble of structures which represents the unbound species in solution into the final ensemble of structures which represents the bound ensemble but excludes the contribution of the interaction between the inhibitor and the receptor to the binding; the second term is the average binding energy between the two molecules in the final ensemble of structures55. Although the two terms, the reorganization free energy and the binding energy can in principle be separately estimated using biophysical methods like NMR and ultra-fast infra-red spectroscopy, it is very challenging. Alternatively, computational methods can be used to estimate the two terms. Roux and co-workers45 have estimated that it costs c-Src 4.0 kcal/mol more to reorganize the activation loop from DFG-in to DFG-out than it does for Abl. A similar computational approach employing meta-dynamics simulation also revealed that the DFG-out conformation in Abl is 2 kcal/mol more stable that in c-Src56. The measured differences in reorganization free energies are a significant fraction of the calculated binding free energy difference between the two kinases and according to the modeling, the reorganization of the activation loop makes an important contribution to the selectivity.
The continuing debate49 about something that cannot be measured directly cannot be resolved by an individual computational or experimental study but hopefully can be resolved by an accumulating body of evidence.
The results of the biochemical profiling analysis support the hypothesis that there is an increased reorganization penalty for binding type II inhibitors to c-Src compared with Abl. In the Davis et al35 profiling dataset which consists of binding affinity assays, 10 out of 11 structurally validated type II inhibitors are found to have a greater inhibition of Abl over c-Src; possibly because Abl pays a smaller reorganization cost than c-Src to form the inactive DFG-out state. Considering our kinase inhibition assays, 8 of the 13 structurally validated type II inhibitors inhibits Abl more strongly than c-Src.
Can we extract additional information from our more general structural bioinformatics analysis of the classical DFG-out conformations in the PDB that bears on the question of the free energy landscape for the DFG-in to DFG-out transition? For a given kinase, the free energy difference between the DFG-out and the DFG-in conformations is proportional to the log of the ratio of the populations of the active to inactive states. Even though there are hundreds of kinase structures in the PDB, the relative populations of DFG-in and DFG-out conformation and their free energy difference, cannot be estimated simply based on the number of conformations of each kinase found in the PDB. Still, we can make two general observations of a qualitative nature. First, we note that only 20 of the 257 kinase structures in the PDB that we have identified as having classical DFG-out conformations are observed without an inhibitor bound (~8%). In contrast, about 20% of the more than one thousand DFG-in structures in the PDB are observed without an inhibitor bound. So fractionally, it is almost three times more probable to find a DFG-in conformation in the PDB without an inhibitor bound than a DFG-out conformation. Secondly, we have analyzed the 20 structures in the PDB which adopt a classical DFG-out conformation but do not have an inhibitor bound (see Supplementary File S1 for the PDB ids). We find that none of these structures can accommodate a structurally validated type II inhibitor without a significant amount of additional reorganization. This suggests that the structural data at least indirectly supports the hypothesis that there is a DFG-in to DFG-out reorganization penalty for some kinases.
CONCLUSIONS
Structural bioinformatics driven analysis of “DFG-out” kinase conformations in the PDB has revealed the existence of a range of DFG-out inactive conformations. We find that only a subset of these conformations can accommodate a type II inhibitor. These correspond to the “classical DFG-out” conformations identified by our structural analysis. We provide simple structural criteria that can be used to identify “classical DFG-out” conformations from a range of inactive conformations which kinases can sample. Although non-classical DFG-out conformations have the Asp pointing away from the ATP binding pocket, the allosteric pockets formed subsequent to this rearrangement have a reduced pocket volume in relation to the corresponding volume for classical DFG-out conformations. These structures cannot accommodate a type II inhibitor, unless they undergo additional ligand induced reorganization. In this work we have also provided statistics concerning the coverage of classical DFG-out conformations on the human kinome, together with information about the conformational preferences of key regulatory structural elements like the αC-helix, and information about the integrity of the classical ion pair interaction and the identity of the gate keeper residue are provided as well.
To augment previous large scale kinase inhibitor profiling studies, which are heavily biased towards type I inhibitors; biochemical profiling of 9 new structurally validated type II inhibitors that are commercially available was performed. The new profiling we report here taken together with our previous study30 constitutes the largest open source of profiling data for structurally validated type II inhibitors derived from a consistent assay source. The global selectivity trends of type I and type II inhibitors across many kinases were inferred from the profiling data based on Gini coefficient. The distribution of Gini coefficients for type II inhibitors based on the current data supports the conclusion that structurally validated type II inhibitors are generally more selective than type I inhibitors. It is likely that the relative contribution to the binding affinity of the reorganization free energy change associated with the DFG-in to DFG-out transition is different for different kinases. The overall importance of the DFG-in to DFG-out reorganization free energy compared with the binding energy in the selectivity of inhibitors for individual kinases remains to be determined.
METHODS
Identification of kinase domain structures in the Protein Data Bank (PDB)
PSI-BLAST57 was used to search sequences in the file PDBAA from the PISCES server58,59. PDBAA contains the sequence of every chain in every asymmetric unit of the PDB. The header line also contains the Swissprot identifier60 (e.g. EGFR_HUMAN) and species for each protein compiled from the SIFTS database61. The query consisted of the protein sequence from PDB 3e5a chain A (AURKA_HUMAN), and a profile was constructed from three rounds of PSI-BLAST on the PDBAA file with default cutoff values. The resulting profile was saved and PDBAA was searched again with an E-value cutoff of 1.0e-15 to eliminate some poorly aligned kinases and some non-kinase proteins that are homologous to kinases but distantly related (e.g. some ribonuclease domains).
Measuring distances between selected residues and the position of the DFG motif
From the PSI-BLAST alignments, certain residues of interest were identified for each kinase by their alignment to these residues in 3e5aA. These included the Phe residue of the DFG motif, the Asp residue of the HRD motif, and a conserved Asn five residues C-terminal to this Asp, and the Lys and Glu residues of the N-terminal domain that typically form a salt bridge in active kinase structures C-helix. From a visual examination of typical active DFG-in structures and DFG-out structures with bound type II inhibitors, we selected two distances that might most readily identify DFG-out structures consistent with the binding of type II inhibitors. In these structures, the Phe is located far from the pocket underneath the C-helix, where it is typically located in DFG-in structures and the so-called SRC inhibited structure. At the same time, the DFG loop bends in the opposite direction in DFG-out structures than it does in DFG-in or SRC-inhibited structures, placing the Phe closer to the ATP binding site and a residue that is highly conserved in sequence and position within the kinase domain, an Asn residue that is five residues C-terminal of the HRD motif (sequence HRDIKPEN in AURKA_HUMAN). These two distances are shown in Figure 2.
Binding pocket volume calculations
Pocket volume calculations were carried out using the program MDpocket62. All kinase PDB structures retrieved using our distance based criteria were pre-aligned before undertaking pocket volume calculations. Structural superposition of the PDB structures was carried out using the Theseus program63, which employs a maximum likelihood approach for optimal structural superposition. Solvent molecules, counter ions and inhibitors present in the PDB structures were removed prior to alignment. Once superposed, the fpocket64 program under MDpocket62 was used for identifying pockets and cavities on the reference structure (PDB entry:1IEP). fpocket, uses a cavity detection algorithm based on Voronoi tessellation for pocket detection. All identified pockets were visualized using VMD65, and all those grid points that enclose the region occupied by a type II inhibitor were defined as the reference pocket for volume calculation. Subsequently, the volume of the pocket across all kinase structures was calculated using the MDpocket program. The volume calculation accounts for both the ATP binding pocket and the allosteric pocket. However, differences in volume between PDB entries reflects changes in volumes occurring at the allosteric pocket as the conserved ATP binding which is present in active and inactive kinase structures is largely invariant.
Classical DFG-out PDB dataset annotation
Each PDB entry identified in the study was annotated based on the small molecule inhibitor bound to the kinase, together with kinase specific information. SMILES notation of the inhibitor bound to kinase were obtained from the PDB and the CAS registry number was retrieved using SciFinder. Each PDB entry was also annotated based on the binding mode of the inhibitor complexed to it. The frequency of occurrence of each inhibitor, in our dataset and the corresponding PDB entries, to which it is complexed are provided for easy identification of inhibitors bound to multiple kinases structure. Further, each PDB entry, was annotate based on it sequence. The UniProt ID31 for each PDB entry based on its sequence and the corresponding group and family to which the kinase sequence belongs are provided in Supplementary File S1. Structural annotations based on the conformation the αC-helix and the P loop are also provided.
Kinase Assays
In vitro profiling of the 9 structurally validated type II inhibitors was carried out against a large kinase panel comprising of 350 recombinant human protein kinases using the Reaction Biology Corporation “HotSpot” miniaturized kinase assay platform.
All inhibitors were tested at a concentration of 0.5 μM in the presence of 10 μM ATP. Briefly, specific kinase/substrate pairs along with required cofactors were prepared in Base reaction buffer; 20 mM Hepes pH 7.5, 10 mM MgCl2, 1 mM EGTA, 0.02% Brij35, 0.02 mg/ml BSA, 0.1 mM Na3VO4, 2 mM DTT, 1% DMSO. Compounds were delivered into the reaction mixture, followed ~20 min later by addition of a mixture of ATP (Sigma) and 33P ATP (PerkinElmer) to a final concentration of 10 μM. Reactions were carried out at 25 °C for 120 min, followed by spotting of the reactions onto P81 ion exchange filter paper (Whatman). Unbound phosphate was removed by extensive washing of filters in 0.75% phosphoric acid. After subtraction of background derived from control reactions containing inactive enzyme, kinase activity data were expressed as the percent remaining kinase activity in test samples compared to vehicle (dimethyl sulfoxide) reactions29.
Compound source
Nine structurally validated type II inhibitors, which are commercially available were procured form chemical vendors. Foretinib and Motesanib free bases were obtained from LC Laboratories. Doramapimod, Bafetinib, Tivozanib, BMS-777607 and AZ-628 were obtained from Selleck Chem. BRAF inhibitor 1 and Rebastinib were obtained from Chemscene. The compounds obtained had an average purity > 96%.
Statistical validation of selectivity profile
In order to assess whether the difference in the mean values of the Gini coefficients for type I and type II inhibitors are statistically significant, we tested against a null hypothesis for statistical validation.
Gini coefficients of type I (114) and type II (13) inhibitors were merged together. A random subset of 13 Gini coefficients was sampled, assuming the sampled Gini coefficient belongs to type II inhibitors. The difference between the means of the sampled data and the rest (assumed to be type I) was calculated. This procedure was repeated 10^7 times and a probability distribution for the difference in the mean values were obtained. The probability of obtaining a difference in the means larger in magnitude than the actual difference in the means was found to be statistically significant with a p-value of 7.49E-5.
To verify the null model test, traditional two sample t-test (p=1.56E-5) together with another null hypothesis test (p=8.08E-8), which is to measure probability of obtaining equal or better Gini coefficient of type II inhibitors (equal to or larger than 0.7) by randomly sampling a subset of 13 from 114 type I inhibitors were conducted. All three tests are consistent in exhibiting the statistical significance of difference in the selectivity for type I and type II inhibitors.
Supplementary Material
Figure 10.

Scatter plot of the kinase activity in replicate 1 versus replicate 2 for each kinase-inhibitor pair.
Acknowledgments
This work has been supported in part by NIH grants R01 GM30580 to R.M.L, R01 GM 083025 to J.R.P, R01 GM84453 to R.L.D, and T32 CA009035 support for Krisna C. Duong-Ly. Vivek Modi was supported by Elizabeth knight Patterson Fellowship from the Fox Chase Cancer Center. The authors thank Allan Haldane and William F. Flynn for their valuable discussions. We gratefully acknowledge Reaction Biology Corp. for carrying out the kinase assays.
References
- 1.Manning G, Whyte DB, Martinez R, Hunter T, Sudarsanam S. The protein kinase complement of the human genome. Science. 2002;298(5600):1912–1934. doi: 10.1126/science.1075762. [DOI] [PubMed] [Google Scholar]
- 2.Fischer EH, Krebs EG. Conversion of phosphorylase b to phosphorylase a in muscle extracts. J Biol Chem. 1955;216(1):121–132. [PubMed] [Google Scholar]
- 3.Manning G, Plowman GD, Hunter T, Sudarsanam S. Evolution of protein kinase signaling from yeast to man. Trends Biochem Sci. 2002;27(10):514–520. doi: 10.1016/s0968-0004(02)02179-5. [DOI] [PubMed] [Google Scholar]
- 4.Rask-Andersen M, Masuram S, Schioth HB. The druggable genome: Evaluation of drug targets in clinical trials suggests major shifts in molecular class and indication. Annu Rev Pharmacol Toxicol. 2014;54:9–26. doi: 10.1146/annurev-pharmtox-011613-135943. [DOI] [PubMed] [Google Scholar]
- 5.Knighton DR, Zheng JH, Ten Eyck LF, Ashford VA, Xuong NH, Taylor SS, Sowadski JM. Crystal structure of the catalytic subunit of cyclic adenosine monophosphate-dependent protein kinase. Science. 1991;253(5018):407–414. doi: 10.1126/science.1862342. [DOI] [PubMed] [Google Scholar]
- 6.Hanks SK, Quinn AM, Hunter T. The protein kinase family: conserved features and deduced phylogeny of the catalytic domains. Science. 1988;241(4861):42–52. doi: 10.1126/science.3291115. [DOI] [PubMed] [Google Scholar]
- 7.Roskoski R., Jr RAF protein-serine/threonine kinases: structure and regulation. Biochem Biophys Res Commun. 2010;399(3):313–317. doi: 10.1016/j.bbrc.2010.07.092. [DOI] [PubMed] [Google Scholar]
- 8.Azam M, Seeliger MA, Gray NS, Kuriyan J, Daley GQ. Activation of tyrosine kinases by mutation of the gatekeeper threonine. Nat Struct Mol Biol. 2008;15(10):1109–1118. doi: 10.1038/nsmb.1486. [DOI] [PMC free article] [PubMed] [Google Scholar]
- 9.Gibbons DL, Pricl S, Kantarjian H, Cortes J, Quintas-Cardama A. The rise and fall of gatekeeper mutations? The BCR-ABL1 T315I paradigm. Cancer. 2012;118(2):293–299. doi: 10.1002/cncr.26225. [DOI] [PMC free article] [PubMed] [Google Scholar]
- 10.Hanks SK, Hunter T. Protein kinases 6. The eukaryotic protein kinase superfamily: kinase (catalytic) domain structure and classification. FASEB J. 1995;9(8):576–596. [PubMed] [Google Scholar]
- 11.Berman HM, Westbrook J, Feng Z, Gilliland G, Bhat TN, Weissig H, Shindyalov IN, Bourne PE. The Protein Data Bank. Nucleic Acids Res. 2000;28(1):235–242. doi: 10.1093/nar/28.1.235. [DOI] [PMC free article] [PubMed] [Google Scholar]
- 12.Huse M, Kuriyan J. The conformational plasticity of protein kinases. Cell. 2002;109(3):275–282. doi: 10.1016/s0092-8674(02)00741-9. [DOI] [PubMed] [Google Scholar]
- 13.Bossemeyer D, Engh RA, Kinzel V, Ponstingl H, Huber R. Phosphotransferase and substrate binding mechanism of the cAMP-dependent protein kinase catalytic subunit from porcine heart as deduced from the 2.0 A structure of the complex with Mn2+ adenylyl imidodiphosphate and inhibitor peptide PKI(5-24) EMBO J. 1993;12(3):849–859. doi: 10.1002/j.1460-2075.1993.tb05725.x. [DOI] [PMC free article] [PubMed] [Google Scholar]
- 14.Zheng J, Knighton DR, ten Eyck LF, Karlsson R, Xuong N, Taylor SS, Sowadski JM. Crystal structure of the catalytic subunit of cAMP-dependent protein kinase complexed with MgATP and peptide inhibitor. Biochemistry. 1993;32(9):2154–2161. doi: 10.1021/bi00060a005. [DOI] [PubMed] [Google Scholar]
- 15.Hari SB, Merritt EA, Maly DJ. Sequence determinants of a specific inactive protein kinase conformation. Chem Biol. 2013;20(6):806–815. doi: 10.1016/j.chembiol.2013.05.005. [DOI] [PMC free article] [PubMed] [Google Scholar]
- 16.Xu W, Doshi A, Lei M, Eck MJ, Harrison SC. Crystal structures of c-Src reveal features of its autoinhibitory mechanism. Mol Cell. 1999;3(5):629–638. doi: 10.1016/s1097-2765(00)80356-1. [DOI] [PubMed] [Google Scholar]
- 17.Schindler T, Bornmann W, Pellicena P, Miller WT, Clarkson B, Kuriyan J. Structural mechanism for STI-571 inhibition of abelson tyrosine kinase. Science. 2000;289(5486):1938–1942. doi: 10.1126/science.289.5486.1938. [DOI] [PubMed] [Google Scholar]
- 18.Nagar B, Bornmann WG, Pellicena P, Schindler T, Veach DR, Miller WT, Clarkson B, Kuriyan J. Crystal structures of the kinase domain of c-Abl in complex with the small molecule inhibitors PD173955 and imatinib (STI-571) Cancer Res. 2002;62(15):4236–4243. [PubMed] [Google Scholar]
- 19.Hubbard SR, Wei L, Ellis L, Hendrickson WA. Crystal structure of the tyrosine kinase domain of the human insulin receptor. Nature. 1994;372(6508):746–754. doi: 10.1038/372746a0. [DOI] [PubMed] [Google Scholar]
- 20.Jura N, Zhang X, Endres NF, Seeliger MA, Schindler T, Kuriyan J. Catalytic control in the EGF receptor and its connection to general kinase regulatory mechanisms. Mol Cell. 2011;42(1):9–22. doi: 10.1016/j.molcel.2011.03.004. [DOI] [PMC free article] [PubMed] [Google Scholar]
- 21.Zhang J, Yang PL, Gray NS. Targeting cancer with small molecule kinase inhibitors. Nat Rev Cancer. 2009;9(1):28–39. doi: 10.1038/nrc2559. [DOI] [PubMed] [Google Scholar]
- 22.Ohren JF, Chen H, Pavlovsky A, Whitehead C, Zhang E, Kuffa P, Yan C, McConnell P, Spessard C, Banotai C, Mueller WT, Delaney A, Omer C, Sebolt-Leopold J, Dudley DT, Leung IK, Flamme C, Warmus J, Kaufman M, Barrett S, Tecle H, Hasemann CA. Structures of human MAP kinase kinase 1 (MEK1) and MEK2 describe novel noncompetitive kinase inhibition. Nat Struct Mol Biol. 2004;11(12):1192–1197. doi: 10.1038/nsmb859. [DOI] [PubMed] [Google Scholar]
- 23.Simard JR, Kluter S, Grutter C, Getlik M, Rabiller M, Rode HB, Rauh D. A new screening assay for allosteric inhibitors of cSrc. Nat Chem Biol. 2009;5(6):394–396. doi: 10.1038/nchembio.162. [DOI] [PubMed] [Google Scholar]
- 24.Gavrin LK, Saiah E. Approaches to discover non-ATP site kinase inhibitors. MedChemComm. 2013;4(1):41–51. [Google Scholar]
- 25.Marsden BD, Knapp S. Doing more than just the structure-structural genomics in kinase drug discovery. Curr Opin Chem Biol. 2008;12(1):40–5. doi: 10.1016/j.cbpa.2008.01.042. [DOI] [PubMed] [Google Scholar]
- 26.van Linden OP, Kooistra AJ, Leurs R, de Esch IJ, de Graaf C. KLIFS: a knowledge-based structural database to navigate kinase-ligand interaction space. J Med Chem. 2014;57(2):249–277. doi: 10.1021/jm400378w. [DOI] [PubMed] [Google Scholar]
- 27.Chiu YY, Lin CT, Huang JW, Hsu KC, Tseng JH, You SR, Yang JM. KIDFamMap: a database of kinase-inhibitor-disease family maps for kinase inhibitor selectivity and binding mechanisms. Nucleic Acids Res. 2013;41(Database issue):D430–440. doi: 10.1093/nar/gks1218. [DOI] [PMC free article] [PubMed] [Google Scholar]
- 28.https://www.ebi.ac.uk/chembl/sarfari/kinasesarfari
- 29.Zhao Z, Wu H, Wang L, Liu Y, Knapp S, Liu Q, Gray NS. Exploration of type II binding mode: A privileged approach for kinase inhibitor focused drug discovery? ACS Chem Biol. 2014;9(6):1230–1241. doi: 10.1021/cb500129t. [DOI] [PMC free article] [PubMed] [Google Scholar]
- 30.Anastassiadis T, Deacon SW, Devarajan K, Ma H, Peterson JR. Comprehensive assay of kinase catalytic activity reveals features of kinase inhibitor selectivity. Nat Biotechnol. 2011;29(11):1039–1045. doi: 10.1038/nbt.2017. [DOI] [PMC free article] [PubMed] [Google Scholar]
- 31.Kornev AP, Haste NM, Taylor SS, Eyck LF. Surface comparison of active and inactive protein kinases identifies a conserved activation mechanism. Proc Natl Acad Sci U S A. 2006;103(47):17783–17788. doi: 10.1073/pnas.0607656103. [DOI] [PMC free article] [PubMed] [Google Scholar]
- 32.The universal protein resource (UniProt) Nucleic Acids Res. 2008;36(Database issue):D190–195. doi: 10.1093/nar/gkm895. [DOI] [PMC free article] [PubMed] [Google Scholar]
- 33.http://www.thesgc.org/scientists/resources/kinases
- 34.Chartier M, Chenard T, Barker J, Najmanovich R. Kinome Render: a stand-alone and web-accessible tool to annotate the human protein kinome tree. PeerJ. 2013;1:e126. doi: 10.7717/peerj.126. [DOI] [PMC free article] [PubMed] [Google Scholar]
- 35.Davis MI, Hunt JP, Herrgard S, Ciceri P, Wodicka LM, Pallares G, Hocker M, Treiber DK, Zarrinkar PP. Comprehensive analysis of kinase inhibitor selectivity. Nat Biotechnol. 2011;29(11):1046–1051. doi: 10.1038/nbt.1990. [DOI] [PubMed] [Google Scholar]
- 36.Kufareva I, Abagyan R. Type-II kinase inhibitor docking, screening, and profiling using modified structures of active kinase states. J Med Chem. 2008;51(24):7921–7932. doi: 10.1021/jm8010299. [DOI] [PMC free article] [PubMed] [Google Scholar]
- 37.Dodson CA, Kosmopoulou M, Richards MW, Atrash B, Bavetsias V, Blagg J, Bayliss R. Crystal structure of an Aurora-A mutant that mimics Aurora-B bound to MLN8054: insights into selectivity and drug design. Biochem J. 2010;427(1):19–28. doi: 10.1042/BJ20091530. [DOI] [PubMed] [Google Scholar]
- 38.Grossi V, Liuzzi M, Murzilli S, Martelli N, Napoli A, Ingravallo G, Del Rio A, Simone C. Sorafenib inhibits p38alpha activity in colorectal cancer cells and synergizes with the DFG-in inhibitor SB202190 to increase apoptotic response. Cancer Biol Ther. 2012;13(14):1471–1481. doi: 10.4161/cbt.22254. [DOI] [PMC free article] [PubMed] [Google Scholar]
- 39.Kuglstatter A, Wong A, Tsing S, Lee SW, Lou Y, Villasenor AG, Bradshaw JM, Shaw D, Barnett JW, Browner MF. Insights into the conformational flexibility of Bruton’s tyrosine kinase from multiple ligand complex structures. Protein Sci. 2011;20(2):428–436. doi: 10.1002/pro.575. [DOI] [PMC free article] [PubMed] [Google Scholar]
- 40.http://www.soci.org/News/Fine-chems/~/media/Files/Conference%20Downloads/2012/Protein%20Kinase%202012/Henrik_Mobitz_Presentation.ashx
- 41.Sutherland JJ, Gao C, Cahya S, Vieth M. What general conclusions can we draw from kinase profiling data sets? Biochim Biophys Acta. 2013;1834(7):1425–1433. doi: 10.1016/j.bbapap.2012.12.023. [DOI] [PubMed] [Google Scholar]
- 42.Metz JT, Johnson EF, Soni NB, Merta PJ, Kifle L, Hajduk PJ. Navigating the kinome. Nat Chem Biol. 2011;7(4):200–202. doi: 10.1038/nchembio.530. [DOI] [PubMed] [Google Scholar]
- 43.Graczyk PP. Gini coefficient: a new way to express selectivity of kinase inhibitors against a family of kinases. J Med Chem. 2007;50(23):5773–5779. doi: 10.1021/jm070562u. [DOI] [PubMed] [Google Scholar]
- 44.Seeliger MA, Nagar B, Frank F, Cao X, Henderson MN, Kuriyan J. c-Src binds to the cancer drug imatinib with an inactive Abl/c-Kit conformation and a distributed thermodynamic penalty. Structure. 2007;15(3):299–311. doi: 10.1016/j.str.2007.01.015. [DOI] [PubMed] [Google Scholar]
- 45.Lin YL, Meng Y, Jiang W, Roux B. Explaining why Gleevec is a specific and potent inhibitor of Abl kinase. Proc Natl Acad Sci U S A. 2013;110(5):1664–1669. doi: 10.1073/pnas.1214330110. [DOI] [PMC free article] [PubMed] [Google Scholar]
- 46.Lin YL, Roux B. Computational analysis of the binding specificity of Gleevec to Abl, c-Kit, Lck, and c-Src tyrosine kinases. J Am Chem Soc. 2013;135(39):14741–14753. doi: 10.1021/ja405939x. [DOI] [PMC free article] [PubMed] [Google Scholar]
- 47.Lin YL, Meng Y, Huang L, Roux B. Computational Study of Gleevec and G6G Reveals Molecular Determinants of Kinase Inhibitor Selectivity. J Am Chem Soc. 2014 doi: 10.1021/ja504146x. [DOI] [PMC free article] [PubMed] [Google Scholar]
- 48.Aleksandrov A, Simonson T. Molecular dynamics simulations show that conformational selection governs the binding preferences of imatinib for several tyrosine kinases. J Biol Chem. 2010;285(18):13807–13815. doi: 10.1074/jbc.M110.109660. [DOI] [PMC free article] [PubMed] [Google Scholar]
- 49.Agafonov RV, Wilson C, Otten R, Buosi V, Kern D. Energetic dissection of Gleevec’s selectivity toward human tyrosine kinases. Nat Struct Mol Biol. 2014;21(10):848–853. doi: 10.1038/nsmb.2891. [DOI] [PMC free article] [PubMed] [Google Scholar]
- 50.Shan Y, Arkhipov A, Kim ET, Pan AC, Shaw DE. Transitions to catalytically inactive conformations in EGFR kinase. Proc Natl Acad Sci U S A. 2013;110(18):7270–7275. doi: 10.1073/pnas.1220843110. [DOI] [PMC free article] [PubMed] [Google Scholar]
- 51.Shukla D, Meng Y, Roux B, Pande VS. Activation pathway of Src kinase reveals intermediate states as targets for drug design. Nat Commun. 2014;5:3397. doi: 10.1038/ncomms4397. [DOI] [PMC free article] [PubMed] [Google Scholar]
- 52.Huang H, Zhao R, Dickson BM, Skeel RD, Post CB. alphaC helix as a switch in the conformational transition of Src/CDK-like kinase domains. J Phys Chem B. 2012;116(15):4465–4475. doi: 10.1021/jp301628r. [DOI] [PMC free article] [PubMed] [Google Scholar]
- 53.Dar AC, Lopez MS, Shokat KM. Small molecule recognition of c-Src via the Imatinib-binding conformation. Chem Biol. 2008;15(10):1015–1022. doi: 10.1016/j.chembiol.2008.09.007. [DOI] [PMC free article] [PubMed] [Google Scholar]
- 54.Seeliger MA, Ranjitkar P, Kasap C, Shan Y, Shaw DE, Shah NP, Kuriyan J, Maly DJ. Equally potent inhibition of c-Src and Abl by compounds that recognize inactive kinase conformations. Cancer Res. 2009;69(6):2384–2392. doi: 10.1158/0008-5472.CAN-08-3953. [DOI] [PMC free article] [PubMed] [Google Scholar]
- 55.Gallicchio E, Lapelosa M, Levy RM. The Binding Energy Distribution Analysis Method (BEDAM) for the Estimation of Protein-Ligand Binding Affinities. J Chem Theory Comput. 2010;6 (9):2961–2977. doi: 10.1021/ct1002913. [DOI] [PMC free article] [PubMed] [Google Scholar]
- 56.Lovera S, Sutto L, Boubeva R, Scapozza L, Dolker N, Gervasio FL. The different flexibility of c-Src and c-Abl kinases regulates the accessibility of a druggable inactive conformation. J Am Chem Soc. 2012;134(5):2496–2499. doi: 10.1021/ja210751t. [DOI] [PubMed] [Google Scholar]
- 57.Altschul SF, Madden TL, Schaffer AA, Zhang J, Zhang Z, Miller W, Lipman DJ. Gapped BLAST and PSI-BLAST: a new generation of protein database search programs. Nucleic Acids Res. 1997;25(17):3389–3402. doi: 10.1093/nar/25.17.3389. [DOI] [PMC free article] [PubMed] [Google Scholar]
- 58.Wang G, Dunbrack RL., Jr PISCES: a protein sequence culling server. Bioinformatics. 2003;19(12):1589–1591. doi: 10.1093/bioinformatics/btg224. [DOI] [PubMed] [Google Scholar]
- 59.Wang G, Dunbrack RL., Jr PISCES: recent improvements to a PDB sequence culling server. Nucleic Acids Res. 2005;33(Web Server issue):W94–98. doi: 10.1093/nar/gki402. [DOI] [PMC free article] [PubMed] [Google Scholar]
- 60.Magrane M, Consortium U. UniProt Knowledgebase: a hub of integrated protein data. Database (Oxford) 2011;2011:bar009. doi: 10.1093/database/bar009. [DOI] [PMC free article] [PubMed] [Google Scholar]
- 61.Velankar S, Dana JM, Jacobsen J, van Ginkel G, Gane PJ, Luo J, Oldfield TJ, O’Donovan C, Martin MJ, Kleywegt GJ. SIFTS: Structure Integration with Function, Taxonomy and Sequences resource. Nucleic Acids Res. 2013;41(Database issue):D483–489. doi: 10.1093/nar/gks1258. [DOI] [PMC free article] [PubMed] [Google Scholar]
- 62.Schmidtke P, Bidon-Chanal A, Luque FJ, Barril X. MDpocket: open-source cavity detection and characterization on molecular dynamics trajectories. Bioinformatics. 2011;27(23):3276–3285. doi: 10.1093/bioinformatics/btr550. [DOI] [PubMed] [Google Scholar]
- 63.Theobald DL, Steindel PA. Optimal simultaneous superpositioning of multiple structures with missing data. Bioinformatics. 2012;28(15):1972–1979. doi: 10.1093/bioinformatics/bts243. [DOI] [PMC free article] [PubMed] [Google Scholar]
- 64.Le Guilloux V, Schmidtke P, Tuffery P. Fpocket: an open source platform for ligand pocket detection. BMC Bioinformatics. 2009;10:168. doi: 10.1186/1471-2105-10-168. [DOI] [PMC free article] [PubMed] [Google Scholar]
- 65.Humphrey W, Dalke A, Schulten K. VMD: visual molecular dynamics. J Mol Graph. 1996;14(1):33–38. 27–28. doi: 10.1016/0263-7855(96)00018-5. [DOI] [PubMed] [Google Scholar]
Associated Data
This section collects any data citations, data availability statements, or supplementary materials included in this article.