Abstract
Human toxic responses are very often related to metabolism. Liver metabolism is traditionally studied, but other organs also convert chemicals and drugs to reactive metabolites leading to toxicity. When DNA damage is found, the effects are termed genotoxic. Here we describe a comprehensive new approach to evaluate chemical genotoxicity pathways from metabolites formed in-situ by a broad spectrum of liver, lung, kidney and intestinal enzymes. DNA damage rates are measured with a microfluidic array featuring a 64-nanowell chip to facilitate fabrication of films of DNA, electrochemiluminescent (ECL) detection polymer [Ru(bpy)2(PVP)10]2+ {(PVP = poly(4-vinylpyridine)} and metabolic enzymes. First, multiple enzyme reactions are run on test compounds using the array, then ECL light related to the resulting DNA damage is measured. A companion method next facilitates reaction of target compounds with DNA/enzyme-coated magnetic beads in 96 well plates, after which DNA is hydrolyzed and nucleobase-metabolite adducts are detected by LC-MS/MS. The same organ enzymes are used as in the arrays. Outcomes revealed nucleobase adducts from DNA damage, enzymes responsible for reactive metabolites (e.g. cyt P450s), influence of bioconjugation, relative dynamics of enzymes suites from different organs, and pathways of possible genotoxic chemistry. Correlations between DNA damage rates from the cell-free array and organ-specific cell-based DNA damage were found. Results illustrate the power of the combined DNA/enzyme microarray/LC-MS/MS approach to efficiently explore a broad spectrum of organ-specific metabolic genotoxic pathways for drugs and environmental chemicals.
Introduction
Toxicity assessment is a major problem in drug and environmental chemical development. This has been well documented in the drug industry where poor preclinical and clinical safety assessment correlations1, 2, 3,4 can be due to in vitro models that do not broadly mimic human metabolism, distribution and toxicity.5 Currently, ~1/3 of drug candidates fail due to unpredicted toxicity that is not revealed until clinical testing, after the candidate has been sent forward on the basis of in vitro and animal test results.6 Toxicity bioassays or animal tests are important components of human toxicity assessment, but rarely address specific chemical pathways of toxicity. Thus, there is a critical need for bioanalytical platforms to establish the chemistry of metabolic toxicity pathways to augment traditional bioassays.
Metabolites are more often involved in toxicity-related chemical reactions than the parent compounds,7, 8 and most toxicity assays include a metabolic component. While standard in vitro bioassays historically rely on liver metabolism, extra-hepatic tissues can also metabolize xenobiotics to reactive metabolites that react with biomolecules and lead to toxic responses.9 Recent research efforts have been directed towards tissue-based organ toxicity assessment. Using tissue slices from human organs, a 2002 report found that liver, lung, intestine and kidney can all contribute to the overall capacity of xenobiotic metabolism.10 Tissue systems have drawbacks including metabolic inconsistencies, deterioration, and specialized operator skill requirements. Nevertheless, promising high-throughput commercial bioassays for safety assessment are emerging.11-13 A metabolizing enzyme toxicology assay chip (MetaChip) integrating drug metabolic toxicity and high-throughput cell-based screening was developed for anticancer chemotherapeutics.14 The integrated Discrete Multiple Organ Co-culture (IdMOC®) array uses co-cultured cells from different organs as physically separated entities interconnected by an overlying culture medium.15 Microfluidic “organ-on-a-chip” devices are being developed for high-throughput screening of drug toxicity.12 Despite significant progress of these tissue-based in vitro tools, variable metabolic activity of cell lines,16 limited lifespan17 and low levels of metabolic enzymes18 need to be addressed. In addition, most of these systems rely on measuring external metabolic biomarkers such as glucose, folate, vitamin B12 and lactate,19 and specific pathways of toxic reactions are difficult to address.
The label genotoxic denotes compounds or their metabolites that induce genetic damage.4,8 Tests for genotoxicity involve in vitro and in vivo measurement of DNA nucleobase adducts formed by reaction with metabolites, and these adducts are effective biomarkers for pollutant exposure.20 We recently developed a fluidic 64-microwell chip for electrochemiluminescent (ECL) detection of DNA-damage.21 The chip features 20-50 nm thick films of DNA, metabolic enzymes and ECL generating metallopolymer [Ru(bpy)2(PVP)10]2+ {(PVP = poly(4-vinylpyridine)} (RuIIPVP) residing in printed nanowells on a pyrolytic graphite substrate housed in a fluidic chamber. In the first step of the assay, test compound solution is pumped over the nanowells to generate reactive metabolites, causing reactions with DNA in the films. Metabolite-nucleobase adduct formation disrupts the DNA double helix, making guanine bases more accessible to oxidation by catalytic RuIIIPVP sites in the measurement step. This results in larger ECL signals for damaged DNA than for intact DNA.4, 22, 23 Guanines on the DNA act as co-reactants in the ECL process when RuIIPVP is oxidized to RuIIIPVP.24 A complex sequence of redox reactions provides electronically excited RuIIPVP* that decays to ground state by emitting visible light. This ECL light is detected in the measurement step by a CCD camera. In general, rates of ECL signals that increase with enzyme reaction time correlate well with formation rates of individual nucleobase adducts measured by LC-MS, and with toxicity bioassays and rodent genotoxicity metrics.4,22, 25
We also developed a high throughput LC-MS/MS companion method to determine molecular structures and formation rates of individual metabolite-nucleobase adducts.26 The approach involves magnetic biocolloid reactor beads coated with enzyme/DNA films analogous to those in the ECL array to generate reactive metabolites and DNA damage. Reactions are run in a 96-well filter plate, followed by hydrolyzing the damaged DNA, filtering, and determining damaged nucleobase products by LC-MS/MS.
In this paper, we describe the first high-throughput ECL array and LC-MS/MS platforms designed to assess organ-specific genotoxicity chemistry pathways. Specifically, ECL arrays and magnetic beads for LC-MS/MS were equipped with representative suites of metabolic enzymes from liver, lung, intestine and kidney to simultaneously elucidate detailed organ-specific metabolic DNA damage chemistry. Metabolic enzyme sources include organ-specific microsomes (insoluble tissue fractions), cytosols (soluble tissue fractions) and supersomes, which are recombinant enzyme manifolds of single cytochrome P450 (cyt P450) enzymes.8, 27,28 In this 2-tier analytical strategy, the ECL array first establishes relative DNA damage rates and distinguishes which metabolic enzymes from which human organs are mainly responsible for metabolism and DNA damage of a given compound. Guided by this information, individual metabolite-nucleobase structures and formation rates are then determined by LC-MS/MS from the biocolloid reactor bead studies to establish molecular pathways for DNA damage. This approach provides results to develop a detailed, comprehensive picture of genotoxicity chemistry linked to individual human organs. With these methods, known genotoxic agents 4-(methylnitrosamino)-1-(3-pyridyl)-1-butanone (NNK), 2-acetylaminofluorene (2-AAF), and styrene revealed organ-based differences in rates of DNA damage, major metabolite-nucleobase adducts and their formation dynamics were identified, and good correlations between cell-free DNA damage in these studies with cell-based DNA damage Comet assays were found.
Experimental
Chemicals and materials
[Ru(bpy)2(PVP)10]2+ (RuIIPVP (bpy = 2,2-bipyridyl; PVP = poly(4-vinylpyridine)) was synthesized and characterized as described.24 Pyrolytic graphite (PG, 2.5x2.5×0.3 cm.) was from www.graphitestore.com. Sources of chemicals, full experimental details and system characterization data are in the Supporting Information (ESI) file.
Fluidic ECL array
The PG chip features 64 printed toner ink nanowells.21 Well volume defined by the 850 mm diameter bottom and 6–14 nm thickness is <10 nL.29 These wells can capture 1 μL drops of solution by virtue of hydrophobic walls and hydrophilic bottoms to facilitate alternative electrostatic layer-by-layer (LbL) fabrication of films of enzymes, DNA and RuIIPVP.4, 30 Enzyme sources included microsomal and cytosolic fractions of human organ tissues and single cyt P450 supersomes. In step 1, multiple enzyme reactions were run by passing reaction solutions through the array chamber (Scheme 1). In step 2 after reaction, the array was placed inside a dark box for ECL activation and detection using a charge coupled device (CCD) camera.21
Scheme 1.
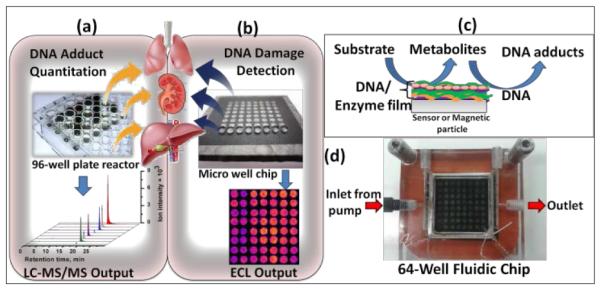
Devices used for high-throughput analysis of organ-specific DNA damage, (a) reactive metabolite-nucleobase adduct quantitation by biocolloid reactors in 96-well plate and LC-MS/MS; (b) ECL microwell chip for DNA damage detection; (c) schematic representation of reactive metabolite-DNA adduct generation; (d) ECL fluidic chip consists of a flow cell, pyrolytic graphite chip on which 64 analytical spots containing DNA, metabolic enzymes and light emitting polymer (RuIIPVP) have been fabricated.
Spot deposition and characterization
Enzyme/RuIIPVP/DNA films were formed a layer-by-layer (LbL) in wells using 1 μL droplets21, 31 of solutions with appropriate compositions (ESI file). LbL films had general architecture (RuIIPVP/DNA)2/RuIIPVP/human organ microsome or cyt P450 enzyme source/human organ cytosol or PDDA/DNA controls. Enzyme films were deposited with and without cytosol on the same chip (Scheme 2). (In text below, LbL films are designated by type of enzyme source, e.g., films containing only liver microsomes are denoted as liver, while films containing liver microsomes and cytosol as Liver+HLC (human liver cytosol). A quartz crystal microbalance was used to measure mass and nominal film thickness.31
Scheme 2.
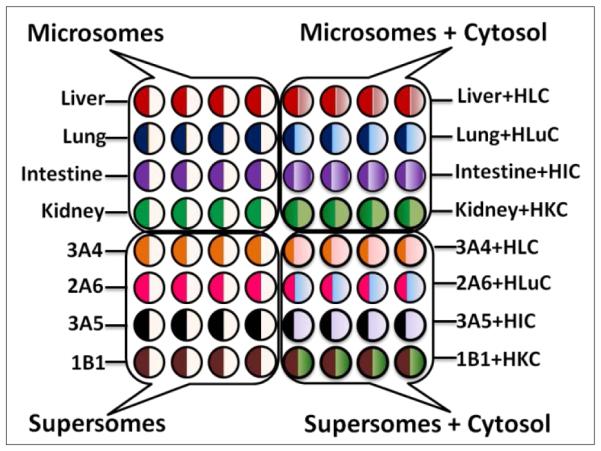
Experimental design of 64-nanowell ECL chip with films of enzymes/RuIIPVP/DNA for metabolic toxicity assays of test compounds. Symbols: HLC, H=human, L=liver, C= cytosol, Lu-lung, I=intestine, K=kidney, number-letter such as 3A4 indicate supersomes containing the denoted single cyt P450 manifold.
Enzyme reaction and ECL signal acquisition
Safety note: styrene, 2-AAF, NNK and metabolites are known carcinogens. All manipulations were done under a closed hood while wearing gloves.
Enzyme reactions were run by pumping reactant solution (styrene, NNK or 2-AAF) and cofactors necessary for conjugative enzyme reactions through the array (Scheme 1) at 500 μL min−1. Applied potential of −0.65 V vs. Ag/AgCl (0.14 M KCl) at 22 (±2) °C during reaction activated the natural cyt P450 catalytic pathway,32-35 followed by washed with buffer. Then, 1.25 V vs. Ag/AgCl was applied by potentiostat for 180 s in a dark box to generate ECL detected by a CCD camera.21
DNA-metabolite adduct quantitation by LC-MS/MS
LbL films of enzymes, DNA, PDDA with film architecture of PDDA/Enzyme/PDDA/DNA were grown on 1 μm carboxylate-functionalized magnetic beads (0.4 mg) in 10 mM Tris buffer (200 μL, pH 7.0) to make the biocolloid reactors.26 Beads were then incubated from 1 hr (styrene) to 18 hr (NNK) with an NADPH regeneration system at 37 °C to generate metabolites. Reaction times were chosen empirically to achieve sufficient amounts of nucleobase adducts for analysis. DNA adducts formed on beads were hydrolyzed enzymatically and/or thermally (See ESI). A Waters Capillary LC-XE with trap column26 interfaced with a 4000 QTRAP (AB Sciex) mass spectrometer was operated in positive ion mode. Estimated detection limit for nucleobase adducts is ~0.3 fmol.
Comet assays
Human cell lines from liver, lung, intestine and kidney at 70% confluence were treated with 150 μM test compounds in 50 mM phosphate buffer (1% DMSO) pH 7.4 with 5% CO2at 37 °C. Assays employed a Comet assay kit (OxiSelect™, STA-350, Cell Biolab).
Results
Film fabrication and characterization
Mass densities and nominal thicknesses of the LbL films were estimated by using QCM for films constructed on 9 MHz, 3-mercaptopropionic acid-derivatized gold-coated quartz crystals.31 Adsorption conditions and stability of each layer was optimized and frequency change (ΔF) was measured after washing with deionized water and drying in a stream of nitrogen (Figure S3, ESI). Nominal thicknesses of films containing organ microsomes were 60-78 nm, while that of films containing cyt P450 supersomes were 54-64 nm. The mass densities of film components are given in Table S2, Figure S3, ESI.
ECL fluidic chip and LC-MS/MS
The metabolic fate of chemicals and drugs in human organs depends on oxidations catalyzed by cyt P450s, as well as sequential conjugative reactions (Scheme 3)36 Cyt P450s are the major enzymes responsible for oxidative metabolism that can result in reactive metabolites and is often called bioactivation. Conjugative enzymes can catalyze reactions of primary oxidation products (Scheme 3) to give new products that are either bioactivated or unreactive (detoxification).36 Uridine 5′-diphospho-glucuronosyltransferases (UGTs), sulfotransferases (SULTs), N-acetyltransferases (NATs), and epoxide hydrolases are the main enzymes involved in conjugation reactions.36 UGTs transfer a glucuronic acid moiety to hydroxyl, carboxyl, carbonyl and amino groups from uridine 5′-diphospho-glucuronic acid and this process generally leads to detoxification.37(a) SULTs transfer a sulfonate group from 3′-phosphoadenosine 5′-phosphosulfate, while NATs transfer an acetyl group from acetyl Co-A to an acceptor group of the substrate.37(b) All of these enzymes from microsomes, cytosol, and single cytP450 supersomes were used in the arrays chips and on the magnetic beads for LC-MS/MS.
Scheme 3.

Simplified metabolic pathways of drugs and chemicals in humans (X) representing oxidative metabolism and conjugative metabolism to facilitate excretion, which can result in DNA adducts due reactions of nucleobases with reactive intermediates.
We chose 4-(methylnitrosamino)-1-(3-pyridyl)-1-butanone (NNK), 2-acetylaminofluorene (2-AAF), and styrene as test compounds for this study. NNK and 2-AAF show high rodent liver toxicity and DNA damage rates.25 The genotoxic influence of styrene is more moderate, but it forms known guanine and adenine adducts in DNA.38 NNK is one of the most prevalent carcinogens in cigarette-smoke.39 2-AAF was originally developed as an insecticide, but discontinued after evidence of carcinogenicity.40 Styrene is widely present in the environment due to emissions from industrial processes, cigarette smoke and combustion of styrene polymers, and is well-known for moderate genotoxic effects upon metabolic activation.41 Knowledge of the metabolism of the parent compounds is a critical starting point for investigating the chemistry of genotoxicity. While metabolic profiles can also be developed using our biocolloid reactors and LC-MS/MS,4,42 here we utilize existing literature to establish a metabolic framework.
Studies of NNK
Our first case study involves reactions of NNK metabolites with DNA. DNA adduct measurements in lung tissues of rodents exposed to cigarette smoke as well as human epidemiology studies ascertain tumorigenic properties of NNK.39(c) Despite extensive studies on NNK metabolism and genotoxicity, to the best of our knowledge there are no comprehensive reports of comparative cell-free in vitro studies on the effect of specific human organs on NNK-related genotoxicity. Significant concentrations of NNK metabolites have been observed in human liver and lung.39(b) Humans pancreatic metabolites43 were reported to generate pancreatic tumors in rats.44
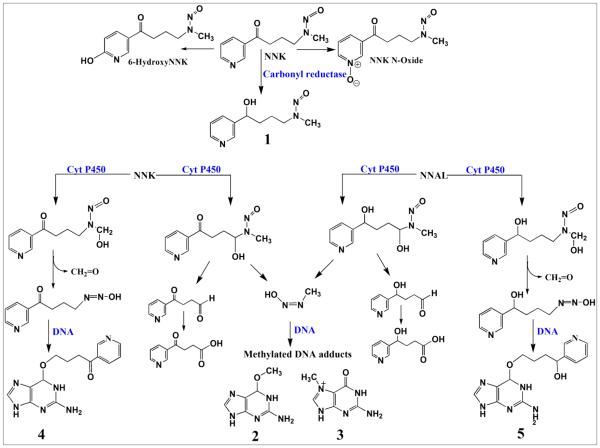
The proposed metabolic routes of NNK, a pyridine derivative, features oxidation of the pyridine ring to yield minor products such as 6-hydroxy and N-oxide derivatives of NNK and reduction of the keto group NNK to yield major intermediate, 4-(methylnitrosamino)-1-(3-pyridyl)-1-butanol (NNAL, 1, Scheme NNK and NNAL can be oxidized by cyt P450 enzymes at carbons alpha to the nitroso group to generate methyl hydroxylated or methylene hydroxylated products (Scheme 4). Methylenediazohydroxide, a reactive intermediate is formed from methylenehydroxylated NNK or NNAL, which in turn, reacts with DNA to form methylated DNA adducts such as O6-Methyl-guanine (2, Scheme 4) and N7-Methyl-guanine (3, Scheme 4) (Scheme 4).39 Methyl hydroxylated NNK further rearranges to reactive species that react with guanine nucleobases to yield O6-pyridyloxybutyl-guanine (4, Scheme 4). Methyl hydroxylated NNAL generates O6-Pyridylhyoxybutyl-guanine (5, Scheme 4) upon reaction with DNA.39
Scheme 4.
Proposed metabolic pathways of NNK in humans.39 Numbered structures represent key intermediates and products.
Using the fluidic arrays (Scheme 2), reactions with a representative suite of metabolic enzymes from each organ are first run simultaneously on the chip under constant reactant and cofactor feed. We selected supersomes of single cyt P450 enzymes that match the most abundant cyt P450 for each organ and are most likely to be involved in metabolism of the test compound. Cyt P450 3A4 is an abundant enzyme in human liver.45 Cyt P450 2A6, which a major oxidative enzyme in lung,9 and is heavily involved in NNK metabolism.39 Cyt P450 3A5 and cyt P450 1B1 the most abundant drug metabolizing enzymes present in human intestine and kidney respectively.9,45
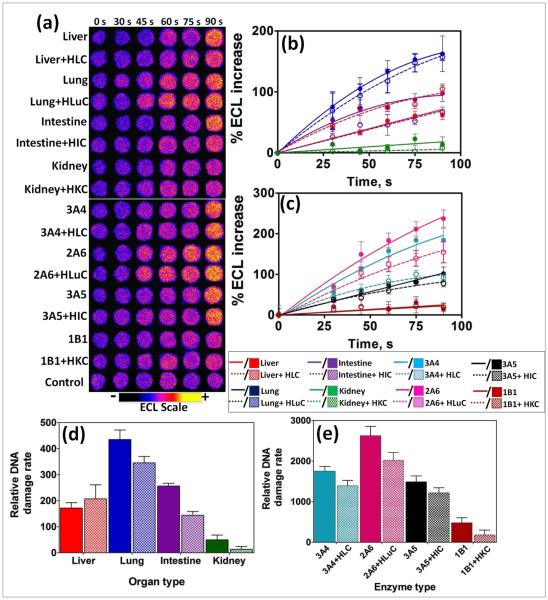
After the enzyme reactions ECL captured from array spots containing different human organ enzymes showed increases in intensity with enzyme reaction time (Figure 1a) This results mainly from formation of covalent adducts of metabolites with nucleobases that disorder the DNA double helix.23,24,30 Slopes of ECL intensity vs. enzyme reaction time (Figure 1b,c) are directly related to the rate of DNA damage as previous confirmed by LC-MS/MS.4,22
Fig. 1.
ECL array data from spots containing RuIIPVP/enzyme/DNA films reacted with oxygenated 150 μM NNK in pH = 7.4 phosphate buffer + necessary cofactors with bioelectronic activation of cyt P450s at −0.65 V vs. Ag/AgCl (0.14 M KCl) at different reaction times. (a) Reconstructed, recolorized ECL array images. Control spots contained liver microsomes subjected to the same reaction conditions as above without exposure to NNK. Graphs on right show influence of enzyme reaction time on % ECL increase for reaction with 150 μM NNK at pH = 7.4, (b) with human organ tissue enzymes, (c) with individual cyt P450 supersomes; error bars represent SD for n = 4. Bar graphs show relative DNA damage rate ({μg of protein}−1 s−1 mM−1) upon exposure to NNK for (d) human organ tissue enzymes, (e) cyt P450 supersomes; color codes as in (b) and (c).
Relative DNA damage rates were expressed as {mg of protein}−1 s−1 mM−1 NNK) from DNA-reactive metabolites as turnover rates for the enzyme reactions by dividing initial slopes in %ECL s−1 by the total amount of protein in each film and mM NNK (Figure 1(d), (e)). Data for liver indicate similar DNA damage rates with and without cytosolic enzymes. For the other organs, relative DNA damage rates of films containing cytosolic enzymes were significantly smaller compared to using only microsomal enzymes or single cyt P450 supersomes. This is presumably due to turning on detoxification pathways with cytosolic conjugative enzymes, thus removing a fraction of the DNA-reactive metabolites during the metabolic reactions.36 Cytosolic fractions are rich sources of major conjugative enzymes such as UGTs, and SULTs, responsible for the detoxification of reactive metabolites.36,28
Human lung tissue fractions gave the highest rate of DNA damage upon exposure to NNK under our assay conditions, suggesting that lung is the human organ most affected by NNK’s reactive metabolites (Figure 1(d)). Cyt P450 2A6 is revealed as the major cyt P450 responsible for genotoxicity-related metabolic chemistry of NNK among cyt P450s tested as it demonstrates the greatest rate of DNA damage upon exposure (Figure 1(e)). A small rate of DNA damage was found for kidney, presumably due to the lack of NNK-metabolizing cyt P450s. Cyt P450 1B1 and 2B6 are the most prevalent enzymes in human kidney,45 but cyt P450 1B1 also gave a small rate of DNA damage, presumably due to slow metabolism of NNK. Intestine and liver demonstrated intermediate rates of DNA damage due to the presence of relatively low levels of NNK metabolizing cyt P450s such as cyt P450 2A6.945 Observations are generally consistent with previously findings from human in vitro microsomal assays and studies of animal models.39,46
Amounts of individual DNA adducts generated from bioactivation of test compounds with human tissue enzymes were measured by LC-MS/MS to complement ECL array results. Magnetic beads (1 μm) decorated with the same DNA/enzyme films used in the ECL array served as biocolloid reactors in a 96-well filter plate high-throughput platform to generate DNA adducts, followed by hydrolysis of the DNA, filtration and LC-MS/MS quantitation of the individual nucleobase adducts.26 7-Methylguanosine was used as an internal standard. Single reaction monitoring (SRM) chromatograms for the characteristic mass transition 299-152 of the O6-pyridyloxybutyl-guanine adduct (4, m/z =299) from reaction products of NNK metabolized by human organ tissue fractions (Figure 2a) and reactions with cyt P450 supersomes in (Figure 2b) on the enzyme/DNA beads. O6-Pyridyloxybutyl-guanine adduct (4, m/z =299) is a depurination product under neutral thermal hydrolysis conditions (See ESI for details) and the facile loss of pyridyloxobutyl moeity (m/z =148) under collision-induced dissociation gives rise to the signature mass transition of m/z 299-152.47 DNA adducts 5 (m/z=417) and 2 (m/z =282) were found after enzyme hydrolysis of the damaged DNA on the bioreactor beads. SRM chromatograms for mass transition m/z 417-301 characteristic of adduct 5, m/z 282-166 for 2, and m/z 166-149 for 3 are in Figure S6, ESI file. The sum of adducts 2, 3, 4, 5 (Figure 2a,c) was largest for lung tissue enzymes followed by liver and intestine which were quite similar. Human kidney enzymes did not provide significant DNA adduct levels. The largest levels of DNA adducts were observed with cyt P450 2A6 (Figure 2b,d)) followed by cyt P450 3A4 and cyt P450 3A5. Cyt P450 1B1 did not provide measurable adducts. DNA adduct amounts from LC-MS/MS are well correlated with ECL array results (Figure 1) giving total amounts of adducts and DNA damage rates in the order lung>liver, intestine>kidney consistent with published literature.39,46 This is a particularly relevant in that a major NNK exposure route is inhalation by tobacco smoking.39 In nearly all array and LC-MS/MS experiments, cytosolic enzyme decreased DNA damage or adducts consistent with significant detoxification by bioconjugation reactions. Adduct 4 (Scheme 4) was found at levels 5-fold or more than 2, 3 or 5 (Table S3, ESI), consistent with metabolic DNA damage by NNK arising mainly from initial methyl hydroxylation, followed by loss of CH2=O to give the guanine-reactive species leading to 4 (Scheme 4). Thus, these results support a pathway yielding 4 is as a possible major genotoxic metabolic pathway in humans, as suggested earlier.39
Fig. 2.
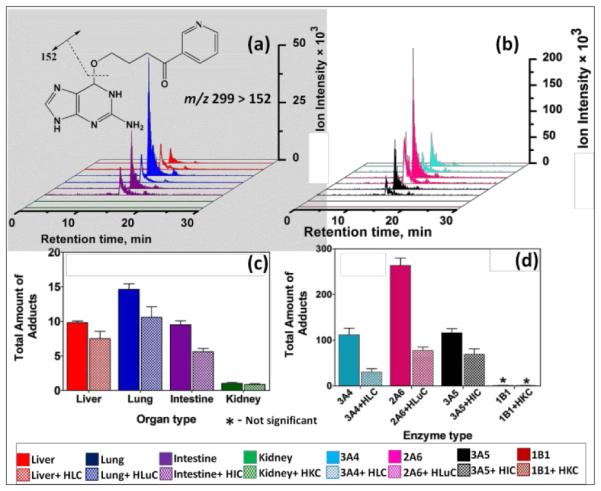
Single reaction monitoring (SRM) LC-MS chromatogram for m/z transition 299-152 monitoring formation of O6-Pyridyloxybutyl-guanine (4, Scheme 4) adducts from biocolloid reactors (enzyme color code on bottom) featuring (a) human organ microsomes, (b) cyt P450 supersomes; 5 (c) and (d) are total DNA adducts found (pmol {μg of protein}−1 {mM of NNK}−1) after reactions with 150 μM NNK at pH = 7.4 for 18 hrs, (c) human organ microsomes, (d) cyt P450 supersomes.
Studies of 2-AAF
Metabolism of 2-AAF begins with oxidation of the secondary amido nitrogen by cyt P450s to yield N-hydroxy-2-AAF (6, Scheme 5)., 48 Microsomal deacylases convert 2-AAF to 2-aminofluorene (2-AF) via elimination of the acetyl functional group which undergoes hydroxylation to give N-Hydroxy-2-AF (7, Scheme 5). Conjugative enzymes such as SULTs and UGTs further metabolize 7 to glucuronides and sulphates to facilitate clearance from the body (Scheme 5).40,48 However, glucuronide, sulphate and acetyl conjugated products can also undergo spontaneous heterolysis of the N–O bond to form arylnitrenium ion, which can react with C8 positions on guanine to form N-(Deoxygunaosin-8-yl)-2-aminofluorene (8, Scheme 5), N-(Deoxygunaosin-8-yl)-2-acetylaminofluorene (9).48
Scheme 5.
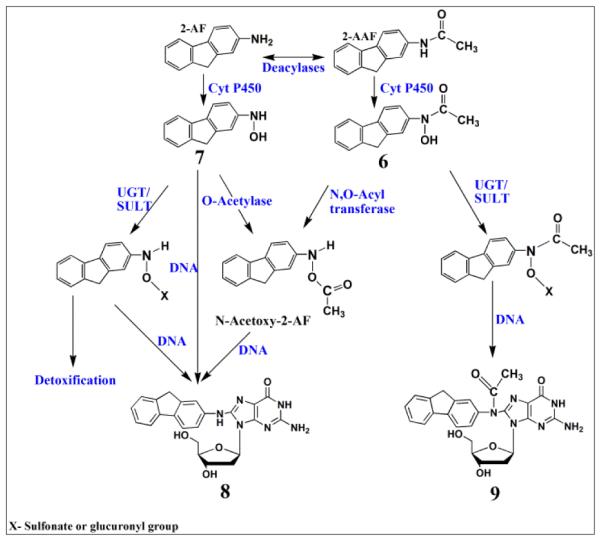
Proposed general metabolic pathways of 2-AAF in humans yielding genotoxic and detoxified products.40,48 Numbered structures represent key intermediates and products.
Upon exposure to 2-AAF, microsomal enzymes gave a slight trend in DNA damage (Figure 3a), but differences had low statistical significance by t-tests (Table S5, ESI). With cytosolic enzymes included, DNA damage rates for intestine and kidney microsomes were significantly larger (Table S5, ESI) than for liver and lung (Table S5), with significantly lower rates of DNA damage in the same trend of kidney>intestine>lung>liver. For comparison, rodent studies revealed the formation of tumors in liver>intestine>kidney upon chronic dietary exposure to 2-AAF,40,49 showing that the same organs are impacted in rodents, but not necessary in order of DNA damage from human metabolism.
Fig. 3.
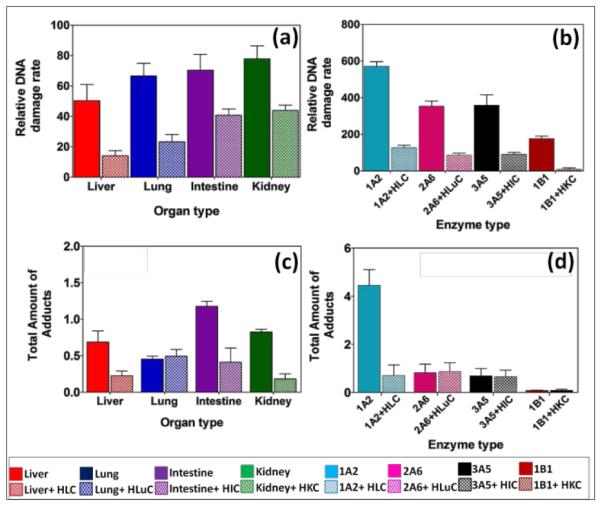
DNA damage rates and amounts of adducts from 2-AAF. Top panel - Relative DNA damage rate ({μg of protein}−1 s−1 mM−1) from ECL arrays exposed to 250 μM of 2-AAF in pH = 7.4 for (a) human organ tissue fractions, (b) cyt P450 supersomes. Bottom panel – Total amount of DNA adducts found (pmol {μg of protein}−1 {mM of 2-AAF}−1) after reactions with 250 μM 2-AAF at pH = 7.4 for 4 hrs, (c) human organ microsomes, (d) cyt P450 supersomes. The ECL images and single reaction monitoring LC-MS/MS chromatograms are in SI file (Figure S4 and Figure S7).
We used cyt P450 1A2 supersomes for 2-AAF to replace cyt P450 3A4 since cyt P450 1A2 is the major cyt P450 responsible for metabolism in human liver.48 A significantly larger rate of DNA damage was found for cyt P450 1A2 (Figure 3(b)) compared to cyt P450s 2A6, 3A5 and 1B1, suggesting a higher rate conversion by 1A2 leading to reactive metabolites. Cyt P450 1B1 is a major cyt P450s in kidney, but DNA damage-related activity towards 2-AAF was small (Figure 3b), consistent with in vitro rodent mutagencity reports.48, 50
N-(deoxyguanosin-8-yl)-2-acetylaminofluorene (9, m/z =489) is a major DNA adduct from 2-AAF, suggesting reaction of 6 with guanine C8 and subsequent loss of sugar (m/z =116) as collision-induced dissociation product of m/z =373.48 Deacylation of 2-AAF gives 2-AF, which undergoes bioactivation to generate N-(deoxyguanosin-8-yl)-2-aminofluorene (8, m/z =447) with product ion m/z =331 (Scheme 5).26,48 LC-MS/MS revealed both 8 and 9 as products from their SRM chromatograms (Figure S7, ESI). Total levels of 8 and 9 from were highest for intestine, and cyt P450 1A2 produced large amounts of these adducts (Figure 3d), presumably due to faster conversion of 2-AAF.26,48(b) Liver and lung enzymes generated larger amounts of 8 than 9, except for intestine and kidney microsomes alone (See Table S4, ESI). In there presence of cytosol enzymes, 9 was not detected. Results suggest that generation of 8 may be a more significant genotoxic pathway.
Styrene
Studies on styrene metabolism demonstrated that cyt P450 mediated oxidation yields styrene oxide, which forms N7 guanine adducts (10, Scheme 6).51 Relative rates of DNA damage by styrene did not show statistically significant variations across different organs with or without cytosolic enzymes (Figure 4a, Table S5). This is because many cyt P450s metabolized styrene with similar efficiency.52, 53 Thus, ECL arrays (Figure 4b) showed that cyt P450 3A4, 2A6 and 3A5 but not cyt P450 1B1 gave similar rates of DNA damage. The N7-guanine adduct of styrene oxide) (10, m/z =272) is the major DNA adduct, which results in MS/MS product ion m/z =152.54 In LC-MS/MS, m/z transition 272-152 (Figure. 4c,d) revealed decreases in DNA adduct levels when including cytosolic enzymes, similar to the array results.
Scheme 6.
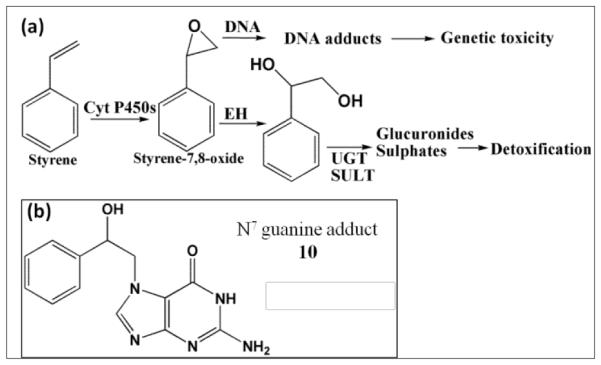
Bioactivation of styrene in humans, (a) general metabolic pathways of styrene yielding genotoxic and detoxified products; (b) N7 guanine adduct formed by reaction with styrene oxide.51
Fig. 4.
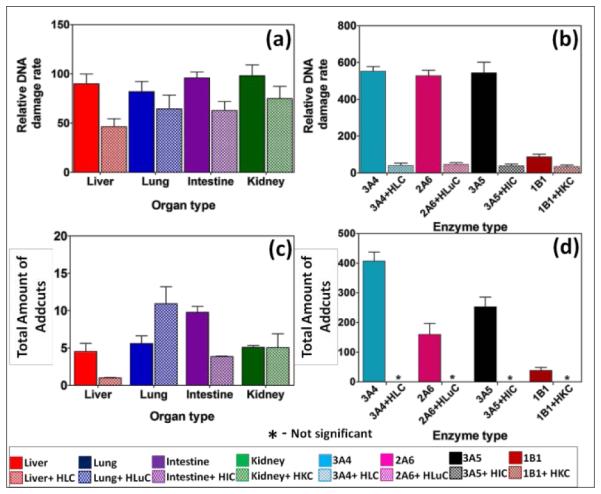
DNA damage rates and adduct amounts from styrene. Top panel - Relative DNA damage rate ({μg of protein}−1 s−1 mM−1) from ECL arrays exposed to 1 mM of styrene in pH = 7.4 for (a) human organ tissue enzymes, (b) cyt P450 supersomes. Bottom panel – Total amount of DNA adducts found (pmol {μg of protein }−1 {mM of styrene}−1) after reactions with 1 mM of styrene at pH = 7.4 for 1 hr, (c) human organ microsomes, (d) cyt P450 supersomes. The ECL images and single reaction monitoring LC-MS chromatograms are in SI file (Figure S5 and Figure S8).
Comet assays
These assays test for cell-based DNA damage from reactive chemicals.55 Comet assays were done using human organ cell lines treated with test compound, followed by cell lysis. DNA is stained with fluorescent dye then subjected to electrophoresis. Damaged DNA migrates further than intact DNA, resulting in a Comet tail-like distribution. The extent of damage is expressed as the length of tail.56 Mean tail length was measured as a function of incubation time with the test compound (Figure S9) to give relative DNA damage rate (tail migration.hr−1 mM−1) (Figure S10).
Discussion
Human organs have unique profiles of metabolic enzymes that determine genotoxicity of specific compounds generated within that organ.9,57 Results above demonstrate the power of our high-throughput assays to elucidate possible organ-specific metabolite-related genotoxic pathways and their relative importance for different chemicals utilizing a broad range of metabolic enzymes. Our new ECL fluidic array establishes relative organ-specific DNA-damage rates, and coupled with bioreactor technology for LC-MS/MS determinations can identify and quantify important nucleobase-metabolite adducts and metabolic routes involved.
Positive features of our experimental approach include rapid microfluidic array analyses of metabolite-related DNA damage rates in 64 simultaneous experiments, e.g. 16 different reactions in quadruplicate (Scheme 1). Once nanowells are equipped with enzyme-DNA-RuIIPVP films, array experiments require up to 90 s for enzyme reactions, 3 min. washing, and 3 min. detection, so 64 experiments can be completed in ~8 min. For LC-MS/MS analysis of nucleobase-metabolite adducts, reactions with the DNA/enzyme-coated magnetic beads in 96-well filter plates feature all 4 organ enzymes in replicate experiments run simultaneously with individual experiments representing cyt P450s alone, supersomes representing single cyt P450s, and cyt P450s plus cytosolic enzymes. After reaction, DNA is hydrolyzed off the beads, and the resulting supernatant is filtered and analyzed by LC-MS/MS. Longer times than for array studies are required, but detailed molecular information and quantitation is obtained. LC takes about 40 min per individual sample, so that future time savings could be achieved by using fast, ultrahigh pressure LC.
Our approaches produce metabolites and DNA adducts from organ-specific microsomes and other organ sources, so that products and relative rates of formation should be similar to those of the human organs to their corresponding organs. This approach does not feature interactions between the organs, and is not an exact model for in vivo processes. The value is in revealing possible chemical pathways and dynamics of genotoxic chemistry for further consideration.
Influence of Cytosolic Enzymes
Experiments combining microsomal and cytosolic enzymes should most closely mimic human genotoxicity pathways. For NNK and 2-AAF, very significant differences were found in relative rates of DNA damage for enzymes from the different organs, and in nearly all cases cytosolic enzymes decreased DNA damage rates (Figures 1-3). In all cases, total amounts of DNA adducts measured by LC-MS/MS after metabolic reactions also varied for different organ enzymes, and decreased when the cytosolic enzymes were included (Figures 2 & 3). These decreases in DNA damage measured in 2 ways are related to detoxification enabled by cytosolic bioconjugation enzymes that presumably destroy DNA reactive metabolites.4,8,27,28 As UGTs are mainly responsible for conjugative reactions of NNK oxidative metabolites,39(c) glucuronides are most likely the non-reactive end products after complete metabolism. Liver microsomes contain larger amounts of membrane bound UGTs compared to extrahepatic tissues.37(a) Thus, the effect of added liver cytosolic UGTs is not very significant for NNK (Figures 1d and 2d). For 2-AAF, detoxification pathways were also apparent and cytosolic enzymes greatly decreased rate of DNA damage and DNA adduct levels (Figure 3). Intestine and kidney showed significantly higher rates of DNA damage compared to liver and lung when cytosolic enzymes were present, which is related to lower amounts of relevant SULTs in human intestine and kidney that compromises detoxification.58 The effect of cytosolic enzymes on styrene is discussed below along with other styrene data.
For NNK and 2-AAF, strong correlations were found between cell-free DNA damage rates and human organ cell-based DNA damage when using microsomes and cytosol for the same compound (Figure 5). For styrene, this correlation was not found. In this respect, it is important to realize that our results cannot establish genotoxicity per se, but reveal possible chemical pathways and dynamics of genotoxic chemistry. For our examples, NNK and 2-AAF chemistry and dynamics are quite consistent with results from cell-based Comet assays. ECL array results are dominated by the enzyme chemistry leading to reactive metabolites, and cyt P450s are somewhat non-selective and have similar activities for styrene. Small differences in the comet assay results may be influenced by effects on metabolic or DNA reaction chemistry that are not accurately mimicked in our cell-free assay. However, the comet assay is not an absolute standard for human genotoxicity, only a way to measure metabolic DNA damage in cells. Thus, the lack of ECL array-comet assay correlation for styrene does not negate the genotoxicity pathway and dynamics results found in our cell-free assays, which may still be relevant to humans.
Fig. 5.
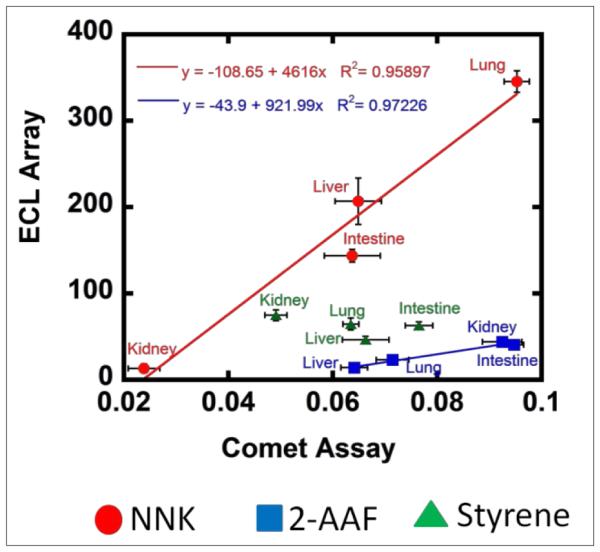
Correlation plots of relative DNA damage rate from ECL arrays ({μg of protein}−1 s−1 mM−1) using microsomal and cytosolic enzymes with comet assay tail migration (hr−1) for test compounds on human cell lines from liver, lung, intestine and kidney.
NNK
The largest DNA damage rate (Figure 1) and highest levels of DNA adducts (Figure 2) for NNK were found using human lung enzymes. Considering the metabolic pathway, 39(b) DNA adducts 2, 3, 4 and 5 ultimately result from α-hydroxylation of NNK and NNAL (Scheme 4). However, adduct 4 was found at levels 5- to 500-fold larger than 2, 3 and 5 except for kidney and cyt P450 1B1, suggesting that methyl hydroxylation leading to 4 may be the major genotoxic metabolic pathway of NNK in human lung, liver and intestine (Scheme 4 and Table S3, ESI)
Among the supersomes, cyt P450 2A6 gave the largest DNA damage rate and amounts of adducts (Figures 1 and 2) suggesting high activity for NNK oxidation to reactive metabolites. As a major metabolic enzyme in the human respiratory tract,9,45 cyt P450 2A6 is a likely candidate for genotoxic bioactivation of NNK in human lung. Consistent with these results, Smith et al. concluded a major role of cyt P450 2A6 in NNK metabolism with human lung microsomes from in vitro cyt P450 inhibition.59 This is a very relevant finding as NNK is a major component in cigarette smoke,39 and the lung is a major NNK target among smokers. Cyt P450 1B1 appears to be minimally involved in genotoxic pathways since a low rate of DNA damage were found (Figure 1d) and no DNA adducts were found (Figure 2d). Consistent with cyt P450 1B1 as major human kidney enzyme45, microsomal kidney enzymes showed low rates of DNA damage (Figure 1c) and low levels of adducts (Figure 2c).
2-AAF
Relative DNA damage rates for 2-AAF showed a slight decreasing trend from kidney>intestine>lung>liver when using only microsomal organ enzymes (Figure 3a). However, addition of cytosolic enzymes accentuates this trend. Metabolism of 2-AAF or its deacylated form 2-AF begins with oxidation of amido nitrogen by cyt P450s to yield an N-hydroxylated intermediates. (6 and 7, Scheme 5).48 In vivo studies of animal models revealed variable adduct levels based on route of administration. For example, male rats given intraperitoneal 2-AAF had higher levels of DNA adduct levels in liver than in bladder.60 In contrast, dietary administration of 2-AAF to mice resulted in higher DNA adduct levels in bladder than in liver.61 Our LC-MS/MS adduct assays revealed formation of major adducts N-(deoxygunaosin-8-yl)-2-aminofluorene, (8) and N-(deoxygunaosin-8-yl)-2-acetylaminofluorene, (9) which are the most commonly reported adducts in cell-based in vitro assays and animal tests.40,48 The C8 position is less sterically hindered compared to other nucleophilic sites of guanine and reacts readily with bulky 2-AAF metabolites.62 When the full complement of cyt P450s and cytosolic enzymes were used, no 9 was found. This suggests that the route from 7 to 9 is not an important genotoxic pathway (Scheme 5), and routes to 8 via 6 and 7 predominate. The largest DNA damage rate and adduct levels for 2-AAF was found with supersomal cyt P450 1A2 (Figures 3b & 3d), consistent with reported bioassays.48
Styrene
Rates of DNA damage by styrene metabolites did not differ at the 95% confidence level with type of organ tissue enzymes (Figure 4). ECL array results are consistent with broad enzyme specificity for styrene53, 63 since cyt P450s 3A4, 2A6 and 3A5 show similar DNA damage rates, although cyt P450 1B1 had low activity (Figure 4). Inclusion of cytosolic enzymes gave very large decreases in DNA damage rates and amount of adducts (Figure 4) for all organs except lung. This is significant since lung inhalation is an exposure route for styrene.64 In general, results are related to efficient detoxification of styrene oxide to phenylethylene glycol by cytosolic epoxyl hydrolase (EH).51,53 Rate of DNA damage halved upon using microsomes and cytosol (Figure 4(a)), but decreased 10-fold when using cyt P450 supersomes and cytosol (Figure 4(b)). This is because organ microsomal fractions contain significant membrane bound EH but supersomes do not. Thus, human microsomes without cytosols styrene oxide is hydrolyzed to phenylethylene glycol, lowering DNA damage rates.65 Glucuronide metabolites have been found in rodents, consistent with a metabolic route in Scheme 6.66
Conclusion
High-throughput microfluidic array and magnetic bead reactor-LC-MS/MS strategies enabled the use of organ-specific suites of metabolic enzymes to establish rates and pathways of metabolite-related DNA damage. These studies identified nucleobase adducts from DNA damage by reactive metabolites, pinpointed enzymes that form the reactive metabolites, established relative dynamics of enzymes suites in the different organs, and helped reveal pathways of possible genotoxic chemistry. Results illustrate the power of combining DNA/enzyme ECL microarray/LC-MS/MS to comprehensively and efficiently explore organ-specific metabolic genotoxic pathways related to the drugs and environmental chemicals in the human body. We have evaluated the system with three test chemicals that are environmental pollutants, but the approaches are applicable to virtually any organic chemical.
Supplementary Material
Acknowledgement
40 This work was supported financially by US PHS grant no. ES03154 from the National Institute of Environmental Health Sciences (NIEHS), NIH, USA.
Footnotes
Electronic Supplementary Information (ESI) available: The ESI file contains full experimental details, 9 additional Figures and 5 Tables documenting system characterization, and raw array and LC-MS/MS results. See DOI: 10.1039/b000000x/
Notes and references
- 1.Irving RM, Elfarra A. Expert Opin. Drug Metab. Toxicol. 2012;8:1157–72. doi: 10.1517/17425255.2012.695347. [DOI] [PMC free article] [PubMed] [Google Scholar]
- 2.Kramer J, Sagartz JE, Morris DL. Nat. Rev. Drug Discov. 2007;6:636–49. doi: 10.1038/nrd2378. [DOI] [PubMed] [Google Scholar]
- 3.Nassar A-EF, Kamel AM, Clarimont C. Drug Discov.Today. 2004;9:1055–64. doi: 10.1016/S1359-6446(04)03297-0. [DOI] [PubMed] [Google Scholar]
- 4.Hvastkovs EG, Schenkman JB, Rusling JF. Annu. Rev. Anal. Chem. 2012;5:79–105. doi: 10.1146/annurev.anchem.111808.073659. [DOI] [PMC free article] [PubMed] [Google Scholar]
- 5.Huh D, Matthews BD, Mammoto A, Montoya-Zavala M, Hsin HY, Ingber DE. Science. 2010;328:1662–8. doi: 10.1126/science.1188302. [DOI] [PMC free article] [PubMed] [Google Scholar]
- 6.Caldwell GW, Yan L. Curr. Opin. Drug Discov. Dev. 2006;9:47–50. [PubMed] [Google Scholar]
- 7.Mayne JT, Ku WW, Kennedy SP. Curr. Opin. Drug Discov. Dev. 2006;9:75–83. [PubMed] [Google Scholar]
- 8.Liebler DC, Guengerich FP. Nat. Rev. Drug Discov. 2005;4:410–420. doi: 10.1038/nrd1720. [DOI] [PubMed] [Google Scholar]
- 9.Ding X, Kaminsky LS. Annu. Rev. Pharmacol. Toxicol. 2003;43:149–173. doi: 10.1146/annurev.pharmtox.43.100901.140251. [DOI] [PubMed] [Google Scholar]
- 10.Kanter RDE, Jager MHDE, Draaisma AL. Xenobiotica. 2002;32:349–362. [Google Scholar]
- 11.Lynch AM, Sasaki JC, Elespuru R, Jacobson-Kram D, Thybaud V, De Boeck M, Aardema MJ, Aubrecht J, Benz RD, Dertinger SD, Douglas GR, White PA, Escobar PA, Fornace A, Jr., Honma M, Naven RT, Rusling JF, Schiest RH, Walmsley RM, Yamamura E, van Benthem J, Kim JH. Environ. Mol. Mutagen. 2011;52:205–223. doi: 10.1002/em.20614. [DOI] [PubMed] [Google Scholar]
- 12.(a) Selimović S, Dokmeci MR, Khademhosseini A. Curr. Opin. Pharmacol. 2013;13:829–833. doi: 10.1016/j.coph.2013.06.005. [DOI] [PubMed] [Google Scholar]; (b) Huh D, Torisawa Y, Hamilton G, Kim HJ, Ingber DE. Lab Chip. 2012;12:2156–64. doi: 10.1039/c2lc40089h. [DOI] [PubMed] [Google Scholar]; (c) Sackmann EK, Fulton AL, Beebe DJ. Nature. 2014;507:181–189. doi: 10.1038/nature13118. [DOI] [PubMed] [Google Scholar]; (d) Chan CY, Huang P-H, Guo F, Ding X, Kapur V, Mai JD, Yuen PK, Huang TJ. Lab Chip. 2013;13:4697–4710. doi: 10.1039/c3lc90115g. [DOI] [PMC free article] [PubMed] [Google Scholar]; (e) Capulli AK, Tian K, Mehandru N, Bukhta A, Choudhury SF, Suchyta M, Parker KK. Lab Chip. 2014;14:3181–3186. doi: 10.1039/c4lc00276h. [DOI] [PMC free article] [PubMed] [Google Scholar]
- 13.(a) http://www.insphero.com.; (b) http://www.solidusbiosciences.com.
- 14.Lee M-Y, Park CB, Dordick JS, Clark DS. Proc. Natl. Acad. Sci. U. S. A. 2005;102:983–987. doi: 10.1073/pnas.0406755102. [DOI] [PMC free article] [PubMed] [Google Scholar]
- 15.Li AP. Altern. Lab. Anim. 2009;37:377–385. doi: 10.1177/026119290903700408. [DOI] [PubMed] [Google Scholar]
- 16.Peng FC, Chaing HH, Tang SH, Chen PC, Lu SC. J . Toxicol. Estviron. Health A. 2004;67:109–124. doi: 10.1080/15287390490264767. [DOI] [PubMed] [Google Scholar]
- 17.McGinnity DF, Soars MG, Urbanowicz R, Riley R. J. Drug Metab. Dispos. 2004;32:1247–1253. doi: 10.1124/dmd.104.000026. [DOI] [PubMed] [Google Scholar]
- 18.(a) Madan A, Dehaan R, Mudra D, Carroll K, Lecluyse E, Parkinson A. Drug Metab. Dispos. 27. 1999:327–335. [PubMed] [Google Scholar]; (b) Fardel O, Morel F, Ratanasavanh D, Fautrel A, Beaune P, Guillouzo A. Cell. Mol. Aspects Cirrhosis. 1992;16:327–330. [Google Scholar]
- 19.(a) Zijno A, Andreoli C, Leopardi P, Marcon F, Rossi S, Caiola S, Verdina A, Galati R, Cafolla A, Crebelli R. Carcinogenesis. 2003;24:1097–1103. doi: 10.1093/carcin/bgg064. [DOI] [PubMed] [Google Scholar]; (b) German JB, Hammock BD, Watkins SM. Metabolomics. 2005;1:3–9. doi: 10.1007/s11306-005-1102-8. [DOI] [PMC free article] [PubMed] [Google Scholar]
- 20.(a) Gyorffy E, Anna L, Kovács K, Rudnai P, Schoket B. Mutagenesis. 200823:1–18. doi: 10.1093/mutage/gem043. [DOI] [PubMed] [Google Scholar]; (b) International Conference on Harmonization, Guidance on Genotoxicity Testing and Data Interpretation for Pharmaceuticals Intended for Human Use. 2011, http://www.ich.org/products/guidelines/safety/article/safety-guidelines.html. [PubMed] [Google Scholar]
- 21.Wasalathanthri DP, Malla S, Bist I, Tang CK, Faria RC, Rusling JF. Lab Chip. 2013;13:4554–4562. doi: 10.1039/c3lc50698c. [DOI] [PMC free article] [PubMed] [Google Scholar]
- 22.(a) Rusling JF, Hvastkovs EG, Schenkman JB. Curr. Opin Drug Discovery Dev. 200710:67–73. [PubMed] [Google Scholar]; (b) Rusling JF, Hvastkovs EG, Schenkman JB. Nassar A, Hollenburg PF, Scatina J, Wiley J, editors. Drug Metabolism Handbook. New Jersey. 2009:307–340. [Google Scholar]
- 23.Rusling JF. Biosens. Bioelectron. 2004;20:1022–1028. doi: 10.1016/j.bios.2004.06.033. [DOI] [PubMed] [Google Scholar]
- 24.Dennany L, Forster RJ, Rusling JF. J. Am. Chem. Soc. 2003;125:5213–5218. doi: 10.1021/ja0296529. [DOI] [PubMed] [Google Scholar]
- 25.Pan S, Zhao L, Schenkman JB, Rusling JF. Anal. Chem. 2011;83:2754–2760. doi: 10.1021/ac200050n. [DOI] [PMC free article] [PubMed] [Google Scholar]
- 26.Zhao L, Schenkman JB, Rusling JF. Anal. Chem. 2010;82:10172–10178. doi: 10.1021/ac102317a. [DOI] [PMC free article] [PubMed] [Google Scholar]
- 27.(a) Guengerich FP. Chem. Res. Toxicol. 2001;14:611–650. doi: 10.1021/tx0002583. [DOI] [PubMed] [Google Scholar]; (b) Ortiz de Montellano PR. Cytochrome P450. Kluwer/Plenum; New York: 2005. [Google Scholar]; (c) Schenkman JB, Greim H. Cytochrome P450. Springer-Verlag; Berlin: 1993. [Google Scholar]
- 28.Guengerich FP. Chem. Res. Toxicol. 2008;21:70–83. doi: 10.1021/tx700079z. [DOI] [PubMed] [Google Scholar]
- 29.Rusling JF, Bishop GW, Doan N, Papadimitrakopoulos F. J. Materials Chem. B. 2014;,2:12–30. doi: 10.1039/C3TB21323D. [DOI] [PMC free article] [PubMed] [Google Scholar]
- 30.Rusling JF, Wasalathanthri DP, Schenkman JB. Soft Matter. 2014;10:8145–8156. doi: 10.1039/c4sm01679c. [DOI] [PMC free article] [PubMed] [Google Scholar]
- 31.Lvov Y. In: Handbook of Surfaces and Interfaces of Materials. Nalwa RW, editor. Vol. 3. Academic Press; San Diego, CA: 2001. pp. 170–189. [Google Scholar]
- 32.Krishnan S, Schenkman JB, Rusling JF. J. Phys. Chem. B. 2011;115:8371–8380. doi: 10.1021/jp201235m. [DOI] [PMC free article] [PubMed] [Google Scholar]
- 33.Krishnan S, Wasalathanthri D, Zhao L, Schenkman JB, Rusling JF. J. Am. Chem. Soc. 2011;133:1459–1465. doi: 10.1021/ja108637s. [DOI] [PMC free article] [PubMed] [Google Scholar]
- 34.Wasalathanthri DP, Malla S, Faria RC, Rusling JF. Electronalysis. 2012;24:2049–2052. doi: 10.1002/elan.201200373. [DOI] [PMC free article] [PubMed] [Google Scholar]
- 35.Wasalathanthri DP, Mani V, Tang CK, Rusling JF. Anal. Chem. 2011;83:9499–9506. doi: 10.1021/ac202269t. [DOI] [PMC free article] [PubMed] [Google Scholar]
- 36.Park BK, Kitteringham NR, Maggs JL, Pirmohamed M, Williams DP. Annu. Rev. Pharmacol. Toxicol. 2005;45:177–202. doi: 10.1146/annurev.pharmtox.45.120403.100058. [DOI] [PubMed] [Google Scholar]
- 37.(a) Tukey RH, Strassburg CP. Annu. Rev. Pharmacol. Toxicol. 2000;40:581–616. doi: 10.1146/annurev.pharmtox.40.1.581. [DOI] [PubMed] [Google Scholar]; (b) Allali-Hassani A, Pan PW, Dombrovski L, Najmanovich R, Tempel W, Dong A, Loppnau P, Martin F, Thornton J, Thonton J, Edwards AM, Bochkarev A, Plotnikov AN, Vedadi M, Arrowsmith CH. PLoS Biol. 2007;5:e97. doi: 10.1371/journal.pbio.0050097. [DOI] [PMC free article] [PubMed] [Google Scholar]
- 38.(a) Koskinen M, Vodicka P, Hemminki K. Chem-Biol. Interact. 2000;124:13–27. doi: 10.1016/s0009-2797(99)00137-4. [DOI] [PubMed] [Google Scholar]; (b) Tarun M, Rusling JF. Crit. Rev. Eukaryot. Gene Expr. 2005;15:295–315. doi: 10.1615/critreveukargeneexpr.v15.i4.20. [DOI] [PubMed] [Google Scholar]
- 39.(a) Hecht SS. Mutat. Res. 1999;424:127–142. doi: 10.1016/s0027-5107(99)00014-7. [DOI] [PubMed] [Google Scholar]; (b) Hecht SS. Chem. Res. Toxicol. 1998;11:5–8. doi: 10.1021/tx980005y. [DOI] [PubMed] [Google Scholar]; (c) Hecht SS. Nat. Rev. Cancer. 2003;3:733–744. doi: 10.1038/nrc1190. [DOI] [PubMed] [Google Scholar]; (d) Bajrami B, Krishnan S, Rusling JF. Drug Metab. Lett. 2008;2:158–162. doi: 10.2174/187231208785425854. [DOI] [PMC free article] [PubMed] [Google Scholar]
- 40.Heflich RH, Neft RE. Mutat. Res. 1994;318:73–174. doi: 10.1016/0165-1110(94)90025-6. [DOI] [PubMed] [Google Scholar]
- 41.Speit G, Henderson L. Mutat. Res. 2005;589:67–79. doi: 10.1016/j.mrrev.2004.10.001. [DOI] [PubMed] [Google Scholar]
- 42.Zhao L, Bajrami B, Rusling JF. In: Cytochrome P450 Protocol. Phillips IR, Shephard EA, Ortiz de Montellano PR, editors. Humana Press Springer; New York: 2013. pp. 129–134. [Google Scholar]
- 43.Prokopczyk B, Hoffmann D, Bologna M, Cunningham AJ, Trushin N, Akerkar S, Boyiri T, Amin S, Desai D, Colosimo S, Pittman B, Leder G, Ramadani M, Henne-Bruns D, Beger HG, El-Bayoumy K. Chem. Res. Toxicol. 2002;15:677–685. doi: 10.1021/tx0101088. [DOI] [PubMed] [Google Scholar]
- 44.Rivenson A, Hoffmann D, Prokopczyk B, Amin S, Hecht SS. Cancer Res. 1988:6912–6917. [PubMed] [Google Scholar]
- 45.Bièche I, Narjoz C, Asselah T, Vacher S, Marcellin P, Lidereau R, Beaune P, de Waziers I. Pharmacogenet. Genomics. 2007;17:731–742. doi: 10.1097/FPC.0b013e32810f2e58. [DOI] [PubMed] [Google Scholar]
- 46.Akopyan G, Bonavida B. Int. J. Oncol. 2006;29:745–752. [PubMed] [Google Scholar]
- 47.Ziegel R, Shallop A, Jones R, Tretyakova N. Chem. Res. Toxicol. 2003;16:541–550. doi: 10.1021/tx025619o. [DOI] [PubMed] [Google Scholar]
- 48.(a) Kim D, Guengerich FP. Annu. Rev. Pharmacol. Toxicol. 2005;45:27–49. doi: 10.1146/annurev.pharmtox.45.120403.100010. [DOI] [PubMed] [Google Scholar]; (b) Turesky RJ, Le Marchand L. Chem. Res. Toxicol. 2011;24:1169–214. doi: 10.1021/tx200135s. [DOI] [PMC free article] [PubMed] [Google Scholar]; (c) Battula N, Schut HA, Thorgeirsson SS. Mol. Carcinogenesis. 1991;4:407–414. doi: 10.1002/mc.2940040513. [DOI] [PubMed] [Google Scholar]
- 49.Beland FA, Kadlubar FF. Environ. Health Perspect. 1985;62:19–30. doi: 10.1289/ehp.856219. [DOI] [PMC free article] [PubMed] [Google Scholar]
- 50.Oda Y, Aryal P, Terashita T, J. Gillam EM, Guengerich FP, Shimada T. Mut. Res. 2001;492:81–90. doi: 10.1016/s1383-5718(01)00154-1. [DOI] [PubMed] [Google Scholar]
- 51.Leibman KC, Ortiz E. Biochem. Pharmacol. 1969;18:552. doi: 10.1016/0006-2952(69)90237-8. [DOI] [PubMed] [Google Scholar]; (b) Leibman KC, Ortiz E. J. Pharmacol. Exp. Therap. 1970;173:242. [PubMed] [Google Scholar]
- 52.Nakajima T, Elovaara E, Gonzalez FJ, Gelboin HV, Raunio H, Pelkonen O, Vainio H, Aoyama T. Chem. Res. Toxicol. 1994;7:891–896. doi: 10.1021/tx00042a026. [DOI] [PubMed] [Google Scholar]
- 53.Vodicka P, Koskinen M, Naccarati A, Oesch-Bartlomowicz B, Vodickova L, Hemminki K, Oesch F. Drug Metab. Rev. 2006;38:805–853. doi: 10.1080/03602530600952222. [DOI] [PubMed] [Google Scholar]
- 54.(a) Tarun M, Rusling JF. Anal. Chem. 2005;77:2056–2062. doi: 10.1021/ac048283r. [DOI] [PubMed] [Google Scholar]; (b) Tarun M, Bajrami B, Rusling JF. Anal. Chem. 2006;78:624–627. doi: 10.1021/ac0517996. [DOI] [PubMed] [Google Scholar]
- 55. http://www.fda.gov/downloads/Drugs/Guidances/ucm074931.pdf, S2(R1) Genotoxicity Testing and Data Interpretation for Pharmaceuticals Intended for Human Use. [PubMed]
- 56.(a) W. Fairbairn D, L. Olive P, L. O’Neill K. Mutat. Res. Genet. Toxicol. 1995;339:37–59. doi: 10.1016/0165-1110(94)00013-3. [DOI] [PubMed] [Google Scholar]; (b) Olive PL, Banáth JP. Nat. Protoc. 2006;1:23–29. doi: 10.1038/nprot.2006.5. [DOI] [PubMed] [Google Scholar]; (c) Tice RR, Agurell E, Anderson D, Burlinson B, Hartmann A, Kobayashi H, Miyamae Y, Rojas E, Ryu JC, Sasaki YF. Environ. Mol. Mutagen. 2000;35:206–221. doi: 10.1002/(sici)1098-2280(2000)35:3<206::aid-em8>3.0.co;2-j. [DOI] [PubMed] [Google Scholar]
- 57.Su T, Bao ZP, Zhang QY, Smith TJ, Hong JY, Ding X. Cancer Res. 2000;60:5074–79. [PubMed] [Google Scholar]
- 58.Gamage N, Barnett A, Hempel N, Duggleby RG, Windmill KF, Martin JL, McManus ME. Toxicol. Sci. 2006;90:5–22. doi: 10.1093/toxsci/kfj061. [DOI] [PubMed] [Google Scholar]
- 59.(a) Smith TJ, Stoner GD, Yang CS. Cancer Res. 1995:5566–5573. [PubMed] [Google Scholar]; (b) Smith TJ, Guo Z, Gonzalez FJ, Guengerich FP, Stoner GD, Yang CS. Cancer Res. 1992:1757–1763. [PubMed] [Google Scholar]
- 60.Beland FA, Dooley KL, Jackson CD. Cancer Res. 1982:1348–1354. [PubMed] [Google Scholar]
- 61.Poirier MC, Fullerton NF, Kinouchi T, Smith BA, Belan FA. Carcinogenesis. 1991;12:895–900. doi: 10.1093/carcin/12.5.895. [DOI] [PubMed] [Google Scholar]
- 62.Benigni R, Bossa C. Chem. Rev. 2011:2507–2536. doi: 10.1021/cr100222q. [DOI] [PubMed] [Google Scholar]
- 63.Nakajima T, Elovaara E, Gonzales FJ, Gelboin HV, Raunio H, Pelkonen O, Vainio H, Aoyama T. Chem. Res. Toxicol. 1994;7:891–896. doi: 10.1021/tx00042a026. [DOI] [PubMed] [Google Scholar]
- 64.U.S. Department of Health and Human Services. ToxGuideTM for Styrene, Sept., 2011, http://www.atsdr.cdc.gov/toxguides/toxguide-53.pdf. [Google Scholar]
- 65.Fretland AJ, Omiecinski CJ. Chemico-Biol. Interact. 2000;129:41–59. doi: 10.1016/s0009-2797(00)00197-6. [DOI] [PubMed] [Google Scholar]
- 66.James SP, White DA. J. Biochem. 1967;104:914. doi: 10.1042/bj1040914. [DOI] [PMC free article] [PubMed] [Google Scholar]; (b) El Masri AM, Smith JN, Williams RT. J. Biochem. 1958;68:19. doi: 10.1042/bj0680199. [DOI] [PMC free article] [PubMed] [Google Scholar]
Associated Data
This section collects any data citations, data availability statements, or supplementary materials included in this article.


