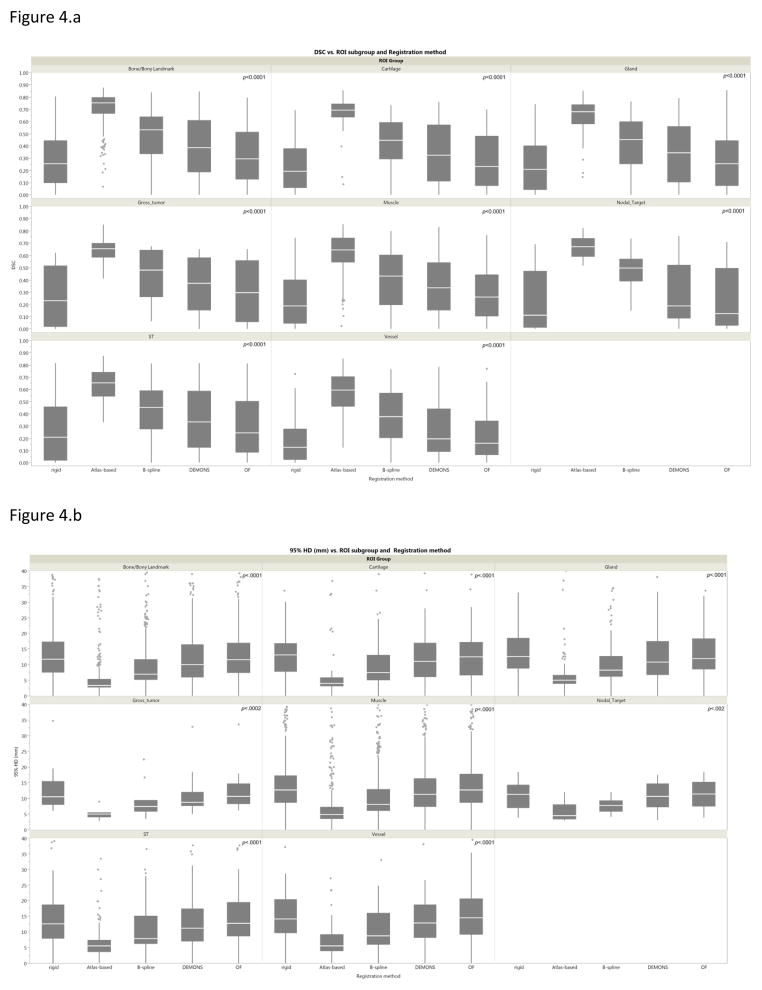
Figure 4.
a. Box-plot of Dice similarity coefficient analysis of each registration method by anatomic ROIs category. Pale line within the box indicates median value, while the box limits indicating the 25th and 75th percentiles. The lines represent the 10th and 90th percentiles, and the dots represent outliers.
b. Box-plot of 95% Haussdorff distance analysis of each registration method by anatomic ROIs category. Abbreviations: OF=optical flow, ST=soft tissues.

