

Abstract
Objectives
Examine associations of favorable levels of all cardiovascular disease (CVD) risk factors (RFs) [i.e., low risk (LR)] at younger ages with high sensitivity C-reactive protein (hs-CRP) at older ages.
Methods
There were 1,324 participants ages 65–84 years with hs-CRP ≤ 10mg/l from the Chicago Healthy Aging Study (2007–2010), CVD RFs assessed at baseline (1967–73) and 39 years later. LR was defined as untreated blood pressure (BP) ≤120/≤80 mmHg, untreated serum total cholesterol <200 mg/dL, body mass index (BMI) <25 kg/m2, not smoking, no diabetes. Hs-CRP was natural log-transformed or dichotomized as elevated (≥3 mg/l or ≥2 mg/l) vs. otherwise.
Results
With multivariable adjustment, the odds ratios (95% confidence intervals) for follow-up hs-CRP ≥3 mg/ in participants with baseline 0RF, 1RF and 2+RFs compared to those with baseline LR were 1.35 (0.89–2.03), 1.61(1.08–2.40) and 1.69(1.04–2.75), respectively. There was also a graded, direct association across four categories of RF groups with follow-up hs-CRP levels (β coefficient/P-trend = 0.18/0.014). Associations were mainly due to baseline smoking and BMI, independent of 39-year change in BMI levels. Similar trends were observed in gender-specific analyses.
Conclusions
Favorable levels of all CVD RFs in younger age are associated with lower hs-CRP level in older age.
Keywords: cardiovascular disease, risk factors, C-reactive protein, inflammation, aging
Introduction
High-sensitivity C-reactive protein (hs-CRP), an acute phase reactant and a marker for systemic inflammation, has been found to be associated with future cardiovascular disease (CVD) events and mortality (Buckley et al., 2009; Kengne et al., 2012; Libby et al., 2002; Ridker, 2003; Ridker et al., 2000; Strandberg and Tilvis, 2000) as well as with single CVD risk factors (RFs), including obesity or body mass index (BMI) (Arena et al., 2006; Ganguli et al., 2011; Ishii et al., 2012; Khoo et al., 2011; Strandberg and Tilvis, 2000; Visser et al., 1999), smoking (Khoo et al., 2011; Strandberg and Tilvis, 2000), blood pressure (Khoo et al., 2011; Lakoski et al., 2005), serum cholesterol (Chiu et al., 2012; Ganguli et al., 2011), and diabetes (Chiu et al., 2012). However, no data are available on the associations between having a favorable level of all CVD RFs (i.e., low risk – LR) at younger ages and hs-CRP levels at older ages.
Many studies have indicated that the benefits of having LR profile include increased longevity (Lloyd-Jones et al., 2006; Stamler et al., 1999), lower morbidity (Lloyd-Jones et al., 2006), better health-related quality of life (Daviglus et al., 2003; Strandberg et al., 2004), and lower heath care costs (Daviglus et al., 2005). Hence, the critical importance of LR concept in overcoming the CVD epidemic has been increasingly recognized (DM Lloyd-Jones et al., 2010). Establishing the long-term association of LR profile earlier in life and hs-CRP levels later in life will add more evidence on the benefits of LR on subsequent health status and, therefore support efforts to increase the prevalence of LR, in keeping with strategic goals of the American Heart Association for cardiovascular health promotion and disease prevention through 2020 and beyond (D. M. Lloyd-Jones et al., 2010).
We examined these associations using data on 962 men and 362 women from the Chicago Healthy Aging Study (CHAS). Participants’ risk profiles were ascertained in both young adulthood/early middle age (1967–73) and 39 years later (2007–10). Hs-CRP was assessed at the 39 year follow-up examination. We hypothesized that LR status at younger/middle ages is associated with lower levels of inflammatory markers of CHD/CVD assessed later in life, and that a graded direct association exists across baseline RF groups -- LR to very high risk -- with levels of inflammatory markers at follow-up. The long-term associations of individual CVD risk factors and hs-CRP levels at older ages were also examined. In addition, the question of whether the 39-year change in BMI would modify the above associations was investigated.
Methods
The Chicago Healthy Aging Study (CHAS)
CHAS is a study of a subset of participants from the Chicago Heart Association Detection Project in Industry (CHA), a prospective cohort study of 39,665 men and women ages 18–74 in work places throughout the Chicago area in 1967–73, focused on RFs for cardiovascular diseases. Details of the CHA (Stamler et al., 1993; Stamler et al., 1975) and CHAS (Pirzada et al., 2013; Vu et al., 2012) studies have been published. Briefly, there were 11,908 potential CHAS participants based on criteria as follows: CHA survivors, aged 65–84 years during 2007–10, free of major ECG abnormalities or myocardial infarction (MI) at the CHA examination (baseline). We used stratified sampling method to recruit CHAS participants based on their baseline RF profile (LR and not LR). Fifty-nine percent (n=7,090) of names (988 LR and 6,102 not LR) were randomly selected for contacting by mail or phone. We successfully contacted 2,799 persons during 2007–10, but 1,404 persons refused to participate in CHAS, which provided a participation rate of 49.8%. The final CHAS sample included 1,395 participants (28% women, 9.3% African American, 19.5 % baseline LR). LR participants were oversampled to obtain adequate numbers for between-group comparisons (Vu et al., 2012).
In general, comparing CHAS participants and non-participants by baseline LR and non-LR status of 11,908 potential CHAS-eligible CHA participants (aged 65–84 years in 2007–2010 and presumed to be alive based on the last received vital status information from National Death Index and CMS records), those who participated in CHAS were slightly younger, less likely to be Black and male, more educated and slightly healthier with regard to CVD RFs than non-CHAS participants, especially for the non-LR group (results not tabulated).
Data on CVD risk profiles, including systolic/diastolic blood pressure (SBP/DBP), serum total cholesterol, BMI, diabetes, smoking history, medical diagnoses and treatment, ECGs, and demographic characteristics, were collected at both baseline and follow-up. Data on subclinical measures and inflammatory markers were collected at follow-up (Figure 1).
Figure 1.
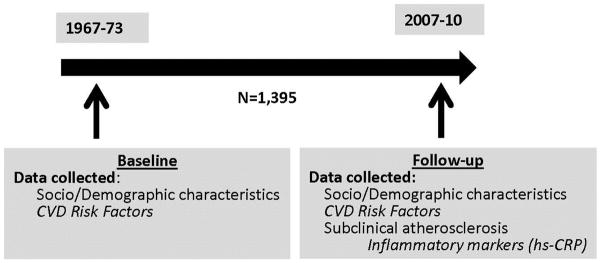
Chicago Healthy Aging Study
All examination procedures were performed by trained and certified staff. The study was approved by the Northwestern University Institutional Review Board; signed informed consent was obtained from all participants.
Exclusions
Of 1,395 CHAS participants examined at the clinic, 71 were hierarchically excluded for the following reasons: missing data on hs-CRP (n=3), hs-CRP >10 mg/l (n=67) due to suggestions that these values may present acute inflammation (Ridker, 2003), and missing covariates at the follow-up examination (n=1). Thus, the final sample included 1,324 CHAS participants. Additionally, because some evidence suggests that CRP elevations above 10 mg/L may present only in very obese persons rather than in those with acute inflammation (Ishii et al., 2012), those with hs-CRP >10 mg/l were included in a sensitivity analysis, with the sample of 1,391 participants.
Follow-up Hs-CRP measurement
Hs-CRP at follow-up was measured in serum samples by the University of Minnesota Physicians Outreach Laboratories using a latex-particle enhanced immunoturbidimetric assay kit and read on the Roche Modular P Chemistry analyzer (Roche Diagnostics, Indianapolis, IN 46250). Hs-CRP was expressed in milligrams per liter (mg/L) and was dichotomized as ≥3 mg/l (cut point indicating elevated risk for CVD)(Wong and Malik, 2005) or elevated CRP vs. Otherwise (<3 mg/l). Another cut-point of hs-CRP ≥2 mg/l was also used for a sensitivity analysis (Goff et al., 2014).
Definition of Baseline Risk Factor Status
Baseline RF status was categorized into 4 groups: 1) Low Risk: all RFs at favorable levels -- SBP/DBP ≤120/≤80 mmHg and not taking antihypertensive medication; serum total cholesterol <200 mg/dL and not taking lipid-lowering medication; BMI <25 kg/m2; not smoking; and no diabetes. Not LR participants then were further classified as: 2) 0RF (but with one or more not favorable levels [i.e., SBP 121–139 mmHg or DBP 81–89 mmHg and not taking antihypertensive medication; serum cholesterol 200–239 mg/dL and not taking lipid-lowering medication; BMI 25.0–29.9 kg/m2]); or 3) 1 adverse RF only (1RF); or 4) 2 or more adverse RFs (2+RFs) [i.e., SBP >140 or DBP >90 mmHg or taking antihypertensive medication; serum cholesterol >240 mg/dL or taking lipid-lowering medication; BMI >30 kg/m2; current smoking; or diabetes].
Data Analyses
Descriptive characteristics were compared across the 4 baseline risk categories using F tests (for continuous variables) or Chi-square tests (for binary variables). Age-sex-race adjusted prevalence of hs-CRP ≥3mg/L and of hs-CRP ≥2mg/L was computed for the RF groups using general linear models.
For multivariate analyses, logistic regression was used to examine the relationship of baseline CVD risk status (with LR as the reference group) to hs-CRP ≥3mg/L at follow-up. Analyses were adjusted for baseline age, race, and sex (Model 1), and then were further adjusted for educational attainment and covariates with potential impact on CRP levels, e.g., presence of major ECG abnormalities or CVD, cancer, and use of aspirin and lipid-lowering medication at follow-up (Model 2). Logistic regression models were also used with baseline RF status as a continuous variable to test for trends across RF strata – from LR to 2+RFs. Analyses were repeated with the cut-point of hs-CRP ≥2mg/L. In addition, multiple linear regression analysis was performed to test for the linear association of baseline RF strata and follow-up hs-CRP. Because the distribution of follow-up hs-CRP levels was skewed, follow-up hs-CRP was natural log-transformed in this analysis.
There were 17 participants who reported having fever in the two weeks prior to follow-up examination, and 30 women who reported using hormone replacement therapy (HRT) at follow-up. Because those conditions may alter the hs-CRP level (Skouby et al., 2002), we performed sensitivity analyses with those participants excluded from the analysis. In addition, we also performed sensitivity analyses without the exclusion of 67 participants with hs-CRP > 10mg/L in the sample.
Models with individual RFs were used to examine the association of each RF separately with CRP. Further, models including 39-year change in BMI were used to explore whether change in BMI level played a role in the association of baseline BMI and CRP levels. Finally, secondary analyses stratified by sex were performed to assess possible effects of sex on the association. All analyses used SAS statistical software version 9.3 (SAS Institute Inc, Cary, NC).
Results
Of the 1,324 CHAS participants with hs-CRP <10mg/l at follow-up (27.3% women, 8.9% African American), baseline mean age was 32.8 (SD, 4.6) years and the follow-up mean age was 71.3 (SD, 4.6) years. At baseline, 19.6 % of participants (n=259) were LR and 14.5% (n=193) had 2 or more RFs. Participants who were LR at baseline tended to be female, non-Black, and better educated than other participants. They also tended to have higher rates of being LR at follow-up compared with other baseline RF groups (5.4% vs. 0.5–1.7%), and have lower prevalence of follow-up CVD/major ECG abnormalities, or use of aspirin or lipid-lowering medication. At the follow-up examination, only 1.9 % of participants (n=25) were LR, while 60.7% (n=804) had 2 or more RFs. About one-fifth (n=286) of participants had follow-up hs-CRP ≥3 mg/l, and one-third (n=443) of participants had follow-up hs-CRP ≥2 mg/l (Table 1).
Table 1.
Selected Baseline (1967–73) and Follow-up (2007–10) Characteristics, All Participants and by Baseline Risk Factor Status – The Chicago Healthy Aging Study
| Characteristics [Mean (SD) or No. (%)§] | Baseline Risk Factor Status
|
|||||
|---|---|---|---|---|---|---|
| All | LR* | 0 RF† | 1 only RF‡ | 2+ RFs‡ | P-value¥ | |
| No. of people | 1324 | 259 | 423 | 449 | 193 | |
| Baseline | ||||||
| Age, mean (SD), y | 32.8 (4.6) | 32.1 (5.0) | 32.8 (4.5) | 33.1 (4.6) | 32.8 (4.4) | 0.040 |
| Female, No. (%) | 362 (27.3) | 130 (50.2) | 89 (21.0) | 107 (23.8) | 36 (18.7) | <0.001 |
| Race, No. (%) | 0.101 | |||||
| Black | 118 (8.9) | 19 (7.3) | 29 (6.9) | 44 (9.8) | 26 (13.5) | |
| Non-Hispanic White | 1172 (88.5) | 230 (88.8) | 385 (91.0) | 395 (88.0) | 162 (83.9) | |
| Hispanic or Asian | 34 (2.6) | 10 (3.9) | 9 (2.1) | 10 (2.2) | 5 (2.6) | |
| Education, mean (SD), y | 14.8 (2.3) | 14.8 (2.4) | 15.2 (2.2) | 14.6 (2.4) | 14.5 (2.3) | <0.001 |
| Smoking Status, No. (%) | -- | |||||
| Never Smoker | 608 (45.9) | 168 (64.9) | 243 (57.5) | 170 (37.9) | 27 (14.0) | |
| Former Smoker | 397 (30.0) | 91 (35.1) | 180(42.6) | 104 (23.2) | 22 (11.4) | |
| Current Smoker | 319 (24.1) | 0 (0.0) | 0 (0.0) | 175 (39.0) | 144 (74.6) | |
| BMI, mean (SD), kg/m2 | 24.9 (3.4) | 22.1 (2.0) | 25.3 (2.5) | 25.2 (3.4) | 27.3 (4.0) | -- |
| BMI ≥30.0 kg/m2, No. (%) | 83 (6.3) | 0(0.0) | 0(0.0) | 34 (7.6) | 49 (25.3) | -- |
| SBP, mean (SD), mmHg | 127.1 (15.1) | 113.8 (6.1) | 122.8 (8.5) | 132.0 (15.5) | 143.1 (14.1) | -- |
| DBP, mean (SD), mmHg | 75.5 (9.8) | 68.9 (7.3) | 73.5 (7.4) | 77.6 (10.0) | 83.5 (10.1) | -- |
| Hypertension ‡, No. (%) | 373 (28.2) | 0(0.0) | 0(0.0) | 210 (46.8) | 163 (84.5) | -- |
| Serum cholesterol, mean (SD), mg/dL | 187.4 (35.2) | 166.1 (20.3) | 185.1 (27.9) | 189.8 (35.2) | 215.2 (44.7) | -- |
| Hypercholesterolemia ‡, No. (%) | 93 (7.0) | 0(0.0) | 0(0.0) | 27 (6.0) | 66 (34.2) | -- |
| Diabetes mellitus, No. (%) | 9 (0.7) | 0(0.0) | 0(0.0) | 3 (0.7) | 6 (3.1) | -- |
| Follow-up (FU), | ||||||
| Follow-up RF status, No. (%) | <0.001 | |||||
| LR | 25 (1.9) | 14 (5.4) | 7 (1.7) | 2 (0.5) | 2 (1.0) | |
| 0RF | 154 (4.6) | 42 (16.2) | 54 (12.8) | 49 (10.9) | 9 (4.7) | |
| 1 Only RF | 341 (25.8) | 85 (32.8) | 115 (27.2) | 115 (25.6) | 26 (13.5) | |
| ≥2 RFs | 804 (60.7) | 118 (45.6) | 247 (58.4) | 283 (63.0) | 156 (80.8) | |
| Current CVD or major ECG abnormalities, No. (%) | 437 (33.0) | 61 (23.6) | 133 (31.4) | 163 (36.3) | 80 (41.5) | <0.001 |
| Current cancer, No. (%) | 369 (27.9) | 77 (29.7) | 116 (27.4) | 128 (28.5) | 48 (24.9) | 0.696 |
| Current taking statin, No. (%) | 801 (60.5) | 122 (47.1) | 264 (62.4) | 272 (60.6) | 143 (74.1) | <0.001 |
| Current taking aspirin, No. (%) | 694 (52.4) | 108 (41.7) | 234 (55.3) | 236 (52.6) | 116 (60.1) | <0.001 |
| Hs-CRP ≥ 3 mg/l, No. (%) | 286 (21.6) | 51 (19.7) | 83 (19.6) | 107 (23.8) | 45 (23.3) | 0.363 |
| Hs-CRP ≥ 2 mg/l, No. (%) | 443 (33.5) | 80 (30.9) | 124 (29.3) | 165 (36.8) | 74 (38.3) | 0.041 |
| Hs-CRP, mean (SD), mg/l | 2.1 (2.0) | 2.0 (1.9) | 1.9 (1.9) | 2.2 (2.1) | 2.1 (1.8) | 0.111 |
Abbreviations: BMI, body mass index; hs-CRP, high sensitivity C-reactive protein; CVD, cardiovascular disease; DBP, diastolic blood pressure; FURF, follow-up risk factor; LR, low risk; RF, risk factor; SBP, systolic blood pressure; SD, standard deviation.
Definition of baseline RF status:
Favorable level of all major CVD RFs (BP ≤120/≤80 mmHg and no antihypertensive medication, serum cholesterol <200mg/dl and no lipid-lowering medication, not smoking, BMI<25 kg/m2, no diabetes).
Unfavorable/borderline SBP/DBP or serum total cholesterol, not smoking, BMI 25.0–29.9 kg/m2, no diabetes.
High SBP/DBP (≥ 140/90) or using antihypertensive medication, serum total cholesterol ≥ 240 mg/dl or using lipid-lowering medication, smoking, BMI ≥30.0 kg/m2, diabetes
P values for overall group comparisons based on χ2 or F-test except for baseline RF components.
Column percentages were computed.
-- Not applicable, as the variable is counted in the RF status algorithm
The age-sex-race adjusted prevalence of hs-CRP ≥ 3 mg/l at follow-up was lowest among the baseline LR group and progressively increased with higher RFs (17% vs. 20–24%), with P-value for trend across four RF groups = 0.023. Similar results were observed for hs-CRP ≥ 2 mg/l, with P-value for trend = 0.002 (results not tabulated).
Odds ratios (ORs) and 95% confidence interval (CI) for hs-CRP ≥3mg/l at the follow-up examination by overall baseline RF status and by single RF at baseline with adjustment for baseline age, sex, and race (Model 1), and with further adjustment for education attainment, current cancer, major ECG abnormality/CVD status, and aspirin and lipid-lowering medication use (Model 2) (Table 2). Similar results were observed in both models. Compared with the baseline LR group, multivariate adjusted odds of elevated hs-CRP levels at follow-up in all other RF groups were higher -- ORs (95% CI) for elevated follow-up CRP levels in baseline 0RF, 1RF, and 2+RFs groups were 1.35 (0.89–2.03), 1.61(1.08–2.40), and 1.69 (1.04–2.75), respectively. When RF status was used as a continuous variable to test for trends across RF strata, there was a graded, direct association across four categories of baseline RF groups, with elevated hs-CRP at follow-up (β coefficient/P-trend = 0.18/0.014). Similar results were observed with the cut-point of hs-CRP ≥2mg/l (β coefficient/P-trend = 0.21/0.002) (results not shown).
Table 2.
Adjusted Odds Ratios (95% CI) for Hs-CRP ≥ 3mg/l at Follow-up (2007–10) by Baseline (1967–73) Risk Factor Status and Single Baseline Risk Factors - The Chicago Healthy Aging Study
| N | OR (95% CI)
|
||
|---|---|---|---|
| Model 1* | Model 2* | ||
| Baseline RF status† | |||
| LR | 259 | 1.00 | 1.00 |
| 0RF | 423 | 1.25 (0.83–1.87) | 1.35 (0.89–2.03) |
| 1 Only RF | 449 | 1.56 (1.05–2.31) | 1.61 (1.08–2.40) |
| ≥2 RFs | 193 | 1.55 (0.96–2.50) | 1.69 (1.04–2.75) |
| β coefficient/P trend‡ | 0.16 (0.023) | 0.18 (0.014) | |
| Single Baseline Risk Factors | |||
| Smoking Status | |||
| Never Smoker (ref.) | 608 | 1.00 | 1.00 |
| Former Smoker | 397 | 1.14 (0.82–1.59) | 1.14 (0.82–1.59) |
| Current Smoker | 319 | 1.75 (1.26–2.43) | 1.69 (1.21–2.36) |
| SBP/DBP, mmHg | |||
| ≤120/≤80, no med.(ref.) | 612 | 1.00 | 1.00 |
| 121–139, no med. | 339 | 1.17 (0.84–1.63) | 1.21 (0.87–1.70) |
| ≥ 140/90 or on med. | 373 | 0.73 (0.51–1.05) | 0.75 (0.52–1.08) |
| Serum Total Chol., mg/dL | |||
| <200, no med. (ref.) | 892 | 1.00 | 1.00 |
| 200–239, no med. | 339 | 0.81 (0.59–1.13) | 0.90 (0.64–1.27) |
| ≥ 240 or on med. | 93 | 1.27 (0.76–2.12) | 1.46 (0.85–2.49) |
| BMI (kg/m2) | |||
| < 25 (ref.) | 685 | 1.00 | 1.00 |
| 25–29 | 556 | 1.29 (0.95–1.75) | 1.33 (0.97–1.82) |
| ≥ 30.0 | 83 | 2.03 (1.18–3.49) | 2.00 (1.16–3.46) |
| Diabetes | 9 | 0.34 (0.04–2.86) | 0.35 (0.04–2.93) |
Abbreviations: see Table 1 footnotes.
Model 1: Adjusted for baseline age, sex, and race; Model 2: Adjusted for variables in Model 1 plus education attainment, and current cancer, taking aspirin, taking lipid-lowering medication, and presence of ECG major abnormalities/CVD.
Definition of baseline RF status: see Table 1 footnotes.
P value for trend across 4 baseline RF groups.
In the analyses testing the linear association across 4 baseline RF groups and natural log-transformed follow-up hs-CRP, adjusted geometric mean of hs-CRP was also lowest in LR group, and highest in the 2+RFs group. There was also a direct association across baseline RF groups, from LR to very high risk, with follow-up hs-CRP levels (β coefficient/P-trend = 0.07/0.009) (results not tabulated).
In analyses of the relationship between each baseline RF and hs-CRP level, cigarette smoking status and BMI levels were associated with follow-up hs-CRP levels. The odds of hs-CRP ≥ 3mg/l were 1.7 times higher in those who were current smokers at baseline versus those who had never smoked, and two-fold in those who were obese compared to those who had normal weight at baseline. No associations of baseline hypertension, hypercholesterolemia, and diabetes with follow-up hs-CRP levels were found.
With inclusion of 39-year change in BMI level, the associations of both baseline smoking and BMI levels with follow-up hs-CRP level remained significant. For example, β coefficients/P-values for the association of baseline BMI as a continuous variable and elevated hs-CRP with and without 39-year change in BMI level were 0.09/<0.0001 and 0.07/0.002, respectively. Change in BMI also showed a strong association with hs-CRP level at follow-up (P-value <0.0001) (results not tabulated).
In secondary sex-specific analyses (Table 3), a similar trend was observed in both men and women, consistent with the main analyses for all participants. We also observed similar results in sensitivity analyses of the sample excluding participants who reported having fever within two weeks before the exam or were current HRT users, as well as of the sample without the exclusion of participants with hs-CRP > 10mg/l. For example, in the latter sample, adjusted ORs (95% CI) for follow-up hs-CRP ≥ 3mg/l were: 1.39 (0.96–2.04), 1.50(1.04–2.17), and 1.72 (1.10–2.69) in baseline 0RF, 1RF, and 2+RFs groups, respectively, compared with the baseline LR group, (results not tabulated).
Table 3.
Adjusted* Odds Ratios (95% CI) for Hs-CRP ≥3mg/l Follow-up (2007–10) by Baseline (1967–73) and Follow-up Risk Factors Status - The Chicago Healthy Aging Study
| Baseline RF Status† | Men | Women | ||
|---|---|---|---|---|
|
| ||||
| N | ORs (95%CI) | N | ORs (95%CI) | |
| LR | 129 | 1.00 | 130 | 1.00 |
| 0RF | 334 | 1.65 (0.90–3.01) | 89 | 1.07 (0.57–2.00) |
| Only 1 RF | 342 | 1.93 (1.07–3.50) | 107 | 1.47 (0.81–2.64) |
| ≥2 RFs | 157 | 1.90 (0.97–3.73) | 36 | 1.91 (0.84–4.33) |
| β coefficient/P Trend‡ | 0.18/0.057 | 0.21/0.078 | ||
Abbreviations: CI indicates confidence interval and see Table 1 footnotes.
Adjusted for baseline age, race, education attainment, and current cancer, taking aspirin, lipid-lowering medication, and presence of ECG major abnormalities/CVD.
Definition of baseline RF status: see Table 1 footnotes.
P value for trend across 4 baseline RF groups
Discussion
Main findings of this 39-year prospective population study were that both women and men with adverse CVD risk profiles in young adulthood/early middle age had higher odds of elevated hs-CRP levels in older age than those who were originally low risk. The association remained with adjustment for multiple traits. There were also graded, direct associations across baseline RF strata with elevated hs-CRP levels at follow-up. The associations were mainly due to participants’ baseline smoking status and BMI, independent of 39-year change in BMI levels.
The benefits of having favorable levels of all major CVD RFs in young adulthood and middle age on subsequent health outcomes at older age have been well documented by our research team and others. For example, life expectancy for the low-risk group was estimated greater by 5.8 years for CHA women aged 40–59 years, and by 9.5 years for CHA men aged 18–39 years compared with the not-LR groups (Stamler et al., 1999). LR was also associated with lower CVD morbidity (Lloyd-Jones et al., 2006), better health-related quality of life (Daviglus et al., 2003; Strandberg et al., 2004), and lower heath care costs (Daviglus et al., 2005). The concept of LR therefore, has been a focus on the new strategic directions in the impact goals of the American Heart Association for CVD health promotion and disease prevention, especially primordial prevention, through 2020 and beyond (D. M. Lloyd-Jones et al., 2010). While there is an abundance of literature on the association of LR on other outcomes, information on associations of LR profiles and markers of inflammation is limited, especially evidence from population studies with decades-long follow-up.
CRP is an acute phase reactant that is a marker for underlying systemic inflammation. CRP has been found to be associated with future CVD events and mortality (Buckley et al., 2009; Kengne et al., 2012; Libby et al., 2002; Ridker, 2003; Ridker et al., 2000; Strandberg and Tilvis, 2000). It has been suggested that inflammatory processes play a role in both initiation and progression of atherosclerosis. CRP therefore has been hypothesized to be an indicator of the presence and extent of underlying subclinical atherosclerosis and a marker of the development of new atherosclerotic lesions (Libby et al., 2002; Ross, 1999). Although there has been debate on the role of CRP in predicting CVD/CHD events, assessment of CRP levels is recommended as potentially useful by the American College of Cardiology and the American Heart Association 2013 guidelines for evaluation of patients with risk assessment levels indicating uncertainty in decision making (Goff et al., 2013). Thus, data on long-term associations of CVD risk profiles and hs-CRP levels may not only add evidence on the benefits of LR, but may also suggest possible underlying mechanisms of the long-term associations of CVD risk profiles and CVD.
Previous studies on CVD RFs and CRP however, have focused only on cross-sectional associations of single CVD risk factors, including obesity or body mass index (BMI) (Arena et al., 2006; Ganguli et al., 2011; Ishii et al., 2012; Khoo et al., 2011; Strandberg and Tilvis, 2000; Visser et al., 1999), smoking (Khoo et al., 2011; Strandberg and Tilvis, 2000; Zhang et al., 2008), blood pressure (Khoo et al., 2011; Lakoski et al., 2005), serum cholesterol (Chiu et al., 2012; Ganguli et al., 2011), and diabetes (Chiu et al., 2012). They also failed to address the impact of LR profile on CRP levels. To our knowledge, this study is the first to examine the long-term association of LR risk profile in younger age to hs-CRP levels in older age, based on a large population of both men and women.
Our findings are consistent with those from previous studies on the long-term association of LR profile and health outcomes later in life. For instance, our earlier study on the CHA cohort suggested that with 31 years of follow-up, LR participants were less likely to have subclinical coronary atherosclerosis, as measured by coronary artery calcium than non-LR participants (Daviglus et al., 2004). Also, in a recent publication using data from CHAS, we found a 39-year association of LR status with the risk of atherosclerosis in the extremities. The likelihood of having low ankle brachial index/peripheral arterial disease 39 years later in persons with LR at baseline was 86% lower than in those with 2+RFs at baseline (Vu et al., 2012).
Regarding the association of individual RFs with CRP, we found that baseline smoking and high BMI were predictors of elevated hs-CRP levels. Those findings are consistent with results from previous short-term or cross-sectional studies (Khoo et al., 2011; Strandberg and Tilvis, 2000; Visser et al., 1999). For instance, in the Third National Health and Nutrition Examination Survey, men and women who were obese or overweight were more likely to have an elevated CRP level compared to those with normal-weight (Visser et al., 1999), and the likelihood of high CRP levels was about 1.5 times higher in current smokers than in non-current smokers (Khoo et al., 2011). Our findings extend these results, showing that BMI level at younger age was independently associated with CRP levels at much older age, regardless of current BMI level.
The relationships of CRP to hypertension or hypercholesterolemia have remained unclear, with inconsistent findings from previous studies (Chiu et al., 2012; Chuang et al., 2013; Lakoski et al., 2005; Strandberg and Tilvis, 2000). We did not find any association between baseline hypertension or hypercholesterolemia and CRP level at follow-up. As persons with hypertension or hypercholesterolemia in younger ages who survived until older ages may have been more likely to use medication therapy such as statin over time, this may have modified those decades-long associations and may be a part of the explanation for our findings. There was no association of baseline diabetes and follow-up CRP, however there were only a few participants with baseline diabetes and those were likely type 1 diabetics, therefore, the association could not be evaluated in this study.
Furthermore, previous studies have reported the effect of sex on the association of LR status and CRP (Arena et al., 2006); our study revealed a similar trend in both genders on the association of LR profile and CRP.
This study has important strengths. First, the 39-year follow-up allowed us to study for the first time CVD risk factor status in young adulthood/early middle age and its association with CRP levels in older age, with men and women of varied socioeconomic and ethnic background. Second, also for the first time, we were able to assess such long-term associations independently of changes in RF status.
Despite the strengths of this study, it also has several limitations. First, CRP was measured only at the 39-year follow-up, which prevented us from examining relations of single and multiple RFs to the progression of CRP level over time. Second, because of the long interval between examinations, our study may have been affected by survival bias. However, this bias is common in most longitudinal studies with decades-long follow up. We would anticipate that individuals with higher RF burdens at younger age would have been more likely to die in the interim, and that these individuals would also have been more likely to have high CRP levels than those who were LR. In addition, although information on current BP and lipid-lowering medication use was available and was used for adjustment in the analyses, intake over time may have modified CRP levels; we are unable to address this issue in this study. Nevertheless, if anything, we may have underestimated the strength of the long-term association of CVD RF profiles with hs-CRP.
In conclusion, our study provides new evidence on the association of CVD RF profiles earlier in adult life and hs-CRP levels much later in life. Favorable levels of all CVD RFs in younger ages, especially not smoking and BMI <25 kg/m2 are associated with lower hs-CRP levels in older age. Our data indicate the importance of LR profile and healthy lifestyles favorably influencing RFs in early adulthood (Liu et al., 2012), as they are associated with lower risk of systemic inflammation, which may play a role in the pathogenesis of coronary atherosclerosis (Libby et al., 2002; Ross, 1999). They also underscore the importance of increasing the prevalence of low-risk status and healthy lifestyles among Americans as a means of achieving long-term cardiovascular health, consistent with the recommendations of the American Heart Association 2020 Impact Goals (D. M. Lloyd-Jones et al., 2010). As such, the study supports public health initiatives aimed at increasing prevalence of low-risk persons and healthy lifestyles to prevent or delay onset of CVD.
Acknowledgments
The authors thank the other investigators, staff members, and volunteers involved in the CHA and CHAS studies. We also thank the participants for their valuable contributions over several decades.
Funding Sources
This research was supported by contract R01 HL081141 from the National Heart, Lung, and Blood Institute.
Abbreviations
- CVD
cardiovascular disease
- RF
risk factor
- Hs-CRP
high sensitivity C-reactive protein
- LR
low risk
- BMI
body mass index
- CHA
Chicago Heart Association Detection Project in Industry
- CHAS
Chicago Healthy Aging Study
- SBP
systolic blood pressure
- DBP
diastolic blood pressure
- ECG
electrocardiographic
- HRT
hormone replacement therapy
Footnotes
Conflict of Interest
None.
Publisher's Disclaimer: This is a PDF file of an unedited manuscript that has been accepted for publication. As a service to our customers we are providing this early version of the manuscript. The manuscript will undergo copyediting, typesetting, and review of the resulting proof before it is published in its final citable form. Please note that during the production process errors may be discovered which could affect the content, and all legal disclaimers that apply to the journal pertain.
References
- Arena R, Arrowood JA, Fei DY, Helm S, Kraft KA. The relationship between C-reactive protein and other cardiovascular risk factors in men and women. Journal of cardiopulmonary rehabilitation. 2006;26:323–7. doi: 10.1097/00008483-200609000-00009. quiz 28–9. [DOI] [PubMed] [Google Scholar]
- Buckley DI, Fu R, Freeman M, Rogers K, Helfand M. C-reactive protein as a risk factor for coronary heart disease: a systematic review and meta-analyses for the U.S. Preventive Services Task Force. Annals of internal medicine. 2009;151:483–95. doi: 10.7326/0003-4819-151-7-200910060-00009. [DOI] [PubMed] [Google Scholar]
- Chiu FH, Chuang CH, Li WC, Weng YM, Fann WC, Lo HY, Sun C, Wang SH. The association of leptin and C-reactive protein with the cardiovascular risk factors and metabolic syndrome score in Taiwanese adults. Cardiovascular diabetology. 2012;11:40. doi: 10.1186/1475-2840-11-40. [DOI] [PMC free article] [PubMed] [Google Scholar]
- Chuang SY, Hsu PF, Chang HY, Bai CH, Yeh WT, Pan HW. C-reactive protein predicts systolic blood pressure and pulse pressure but not diastolic blood pressure: the Cardiovascular Disease Risk Factors Two-Township Study. American journal of hypertension. 2013;26:657–64. doi: 10.1093/ajh/hps095. [DOI] [PubMed] [Google Scholar]
- Daviglus ML, Liu K, Pirzada A, Yan LL, Garside DB, Feinglass J, Guralnik JM, Greenland P, Stamler J. Favorable cardiovascular risk profile in middle age and health-related quality of life in older age. Archives of internal medicine. 2003;163:2460–8. doi: 10.1001/archinte.163.20.2460. [DOI] [PubMed] [Google Scholar]
- Daviglus ML, Liu K, Pirzada A, Yan LL, Garside DB, Greenland P, Manheim LM, Dyer AR, Wang R, et al. Cardiovascular risk profile earlier in life and Medicare costs in the last year of life. Archives of internal medicine. 2005;165:1028–34. doi: 10.1001/archinte.165.9.1028. [DOI] [PubMed] [Google Scholar]
- Daviglus ML, Pirzada A, Liu K, Yan LL, Garside DB, Dyer AR, Hoff JA, Kondos GT, Greenland P, et al. Comparison of low risk and higher risk profiles in middle age to frequency and quantity of coronary artery calcium years later. The American journal of cardiology. 2004;94:367–9. doi: 10.1016/j.amjcard.2004.04.038. [DOI] [PubMed] [Google Scholar]
- Ganguli D, Das N, Saha I, Sanapala KR, Chaudhuri D, Ghosh S, Dey S. Association between inflammatory markers and cardiovascular risk factors in women from Kolkata, W.B, India. Arq Bras Cardiol. 2011;96:38–46. doi: 10.1590/s0066-782x2010005000165. [DOI] [PubMed] [Google Scholar]
- Goff DC, Jr, Lloyd-Jones DM, Bennett G, Coady S, D’Agostino RB, Sr, Gibbons R, Greenland P, Lackland DT, Levy D, et al. 2013 ACC/AHA guideline on the assessment of cardiovascular risk: a report of the American College of Cardiology/American Heart Association Task Force on Practice Guidelines. Journal of the American College of Cardiology. 2014;63:2935–59. doi: 10.1016/j.jacc.2013.11.005. [DOI] [PMC free article] [PubMed] [Google Scholar]
- Goff DC, Jr, Lloyd-Jones DM, Bennett G, O’Donnell CJ, Coady S, Robinson J, D’Agostino RB, Sr, Schwartz JS, Gibbons R, et al. 2013 ACC/AHA Guideline on the Assessment of Cardiovascular Risk: A Report of the American College of Cardiology/American Heart Association Task Force on Practice Guidelines. Journal of the American College of Cardiology. 2013 doi: 10.1016/j.jacc.2013.11.005. [DOI] [PMC free article] [PubMed] [Google Scholar]
- Ishii S, Karlamangla AS, Bote M, Irwin MR, Jacobs DR, Jr, Cho HJ, Seeman TE. Gender, obesity and repeated elevation of C-reactive protein: data from the CARDIA cohort. PloS one. 2012;7:e36062. doi: 10.1371/journal.pone.0036062. [DOI] [PMC free article] [PubMed] [Google Scholar]
- Kengne AP, Batty GD, Hamer M, Stamatakis E, Czernichow S. Association of C-reactive protein with cardiovascular disease mortality according to diabetes status: pooled analyses of 25,979 participants from four U.K. prospective cohort studies. Diabetes care. 2012;35:396–403. doi: 10.2337/dc11-1588. [DOI] [PMC free article] [PubMed] [Google Scholar]
- Khoo CM, Tan M, Wu Y, Wai CH, Subramaniam T, Lee J, Tai ES. Central obesity and smoking are key modifiable risk factors for elevated C-reactive protein in Asian individuals who are not eligible for statin therapy. Nutrition & diabetes. 2011;1:e8. doi: 10.1038/nutd.2011.4. [DOI] [PMC free article] [PubMed] [Google Scholar]
- Lakoski SG, Cushman M, Palmas W, Blumenthal R, D’Agostino RB, Jr, Herrington DM. The relationship between blood pressure and C-reactive protein in the Multi-Ethnic Study of Atherosclerosis (MESA) Journal of the American College of Cardiology. 2005;46:1869–74. doi: 10.1016/j.jacc.2005.07.050. [DOI] [PubMed] [Google Scholar]
- Libby P, Ridker PM, Maseri A. Inflammation and atherosclerosis. Circulation. 2002;105:1135–43. doi: 10.1161/hc0902.104353. [DOI] [PubMed] [Google Scholar]
- Liu K, Daviglus ML, Loria CM, Colangelo LA, Spring B, Moller AC, Lloyd-Jones DM. Healthy lifestyle through young adulthood and the presence of low cardiovascular disease risk profile in middle age: the Coronary Artery Risk Development in (Young) Adults (CARDIA) study. Circulation. 2012;125:996–1004. doi: 10.1161/CIRCULATIONAHA.111.060681. [DOI] [PMC free article] [PubMed] [Google Scholar]
- Lloyd-Jones D, Hong Y, Labarthe D, Mozaffarian D, Appel L, Van Horn L, Greenlund K, Daniels S, Nichol G, et al. AHA Special Report. Defining and setting national goals for cardiovascular health promotion and disease reduction. The American Heart Association’s Strategic Impact Goal Through 2020 and Beyond. Circulation. 2010;121:586–613. doi: 10.1161/CIRCULATIONAHA.109.192703. [DOI] [PubMed] [Google Scholar]
- Lloyd-Jones DM, Hong Y, Labarthe D, Mozaffarian D, Appel LJ, Van Horn L, Greenlund K, Daniels S, Nichol G, et al. Defining and setting national goals for cardiovascular health promotion and disease reduction: the American Heart Association’s strategic Impact Goal through 2020 and beyond. Circulation. 2010;121:586–613. doi: 10.1161/CIRCULATIONAHA.109.192703. [DOI] [PubMed] [Google Scholar]
- Lloyd-Jones DM, Leip EP, Larson MG, D’Agostino RB, Beiser A, Wilson PW, Wolf PA, Levy D. Prediction of lifetime risk for cardiovascular disease by risk factor burden at 50 years of age. Circulation. 2006;113:791–8. doi: 10.1161/CIRCULATIONAHA.105.548206. [DOI] [PubMed] [Google Scholar]
- Pirzada A, Reid K, Kim D, Garside DB, Lu B, Vu TH, Lloyd-Jones DM, Zee P, Liu K, et al. Chicago healthy aging study: objectives and design. American journal of epidemiology. 2013;178:635–44. doi: 10.1093/aje/kwt020. [DOI] [PMC free article] [PubMed] [Google Scholar]
- Ridker PM. Clinical application of C-reactive protein for cardiovascular disease detection and prevention. Circulation. 2003;107:363–9. doi: 10.1161/01.cir.0000053730.47739.3c. [DOI] [PubMed] [Google Scholar]
- Ridker PM, Hennekens CH, Buring JE, Rifai N. C-reactive protein and other markers of inflammation in the prediction of cardiovascular disease in women. The New England journal of medicine. 2000;342:836–43. doi: 10.1056/NEJM200003233421202. [DOI] [PubMed] [Google Scholar]
- Ross R. Atherosclerosis--an inflammatory disease. The New England journal of medicine. 1999;340:115–26. doi: 10.1056/NEJM199901143400207. [DOI] [PubMed] [Google Scholar]
- Skouby SO, Gram J, Andersen LF, Sidelmann J, Petersen KR, Jespersen J. Hormone replacement therapy: estrogen and progestin effects on plasma C-reactive protein concentrations. American journal of obstetrics and gynecology. 2002;186:969–77. doi: 10.1067/mob.2002.122414. [DOI] [PubMed] [Google Scholar]
- Stamler J, Rhomberg P, Schoenberger JA, Shekelle RB, Dyer A, Shekelle S, Stamler R, Wannamaker J. Multivariate analysis of the relationship of seven variables to blood pressure: findings of the Chicago Heart Association Detection Project in Industry, 1967–1972. Journal of chronic diseases. 1975;28:527–48. doi: 10.1016/0021-9681(75)90060-0. [DOI] [PubMed] [Google Scholar]
- Stamler J, Dyer AR, Shekelle RB, et al. Relationship of baseline major risk factors to coronary and all-cause mortality, and to longevity: findings from long-term follow-up of Chicago cohorts. Cardiol. 1993;82(2-3):191–222. doi: 10.1159/000175868. [DOI] [PubMed] [Google Scholar]
- Stamler J, Stamler R, Neaton JD, Wentworth D, Daviglus ML, Garside D, Dyer AR, Liu K, Greenland P. Low risk-factor profile and long-term cardiovascular and noncardiovascular mortality and life expectancy: findings for 5 large cohorts of young adult and middle-aged men and women. JAMA: the journal of the American Medical Association. 1999;282:2012–8. doi: 10.1001/jama.282.21.2012. [DOI] [PubMed] [Google Scholar]
- Strandberg A, Strandberg TE, Salomaa VV, Pitkala K, Happola O, Miettinen TA. A follow-up study found that cardiovascular risk in middle age predicted mortality and quality of life in old age. Journal of clinical epidemiology. 2004;57:415–21. doi: 10.1016/j.jclinepi.2003.09.013. [DOI] [PubMed] [Google Scholar]
- Strandberg TE, Tilvis RS. C-reactive protein, cardiovascular risk factors, and mortality in a prospective study in the elderly. Arteriosclerosis, thrombosis, and vascular biology. 2000;20:1057–60. doi: 10.1161/01.atv.20.4.1057. [DOI] [PubMed] [Google Scholar]
- Visser M, Bouter LM, McQuillan GM, Wener MH, Harris TB. Elevated C-reactive protein levels in overweight and obese adults. JAMA: the journal of the American Medical Association. 1999;282:2131–5. doi: 10.1001/jama.282.22.2131. [DOI] [PubMed] [Google Scholar]
- Vu TH, Stamler J, Liu K, McDermott MM, Lloyd-Jones DM, Pirzada A, Garside DB, Daviglus ML. Prospective relationship of low cardiovascular risk factor profile at younger ages to ankle-brachial index: 39-year follow-up--the Chicago Healthy Aging Study. Journal of the American Heart Association. 2012;1:e001545. doi: 10.1161/JAHA.112.001545. [DOI] [PMC free article] [PubMed] [Google Scholar]
- Wong ND, Malik S. C-reactive protein for cardiovascular risk assessment in the metabolic syndrome: response to Kholeif et al. Diabetes care. 2005;28:2598–9. doi: 10.2337/diacare.28.10.2598. [DOI] [PubMed] [Google Scholar]
- Zhang X, Shu XO, Signorello LB, Hargreaves MK, Cai Q, Linton MF, Fazio S, Zheng W, Blot WJ. Correlates of high serum C-reactive protein levels in a socioeconomically disadvantaged population. Dis Markers. 2008;24:351–9. doi: 10.1155/2008/509138. [DOI] [PMC free article] [PubMed] [Google Scholar]