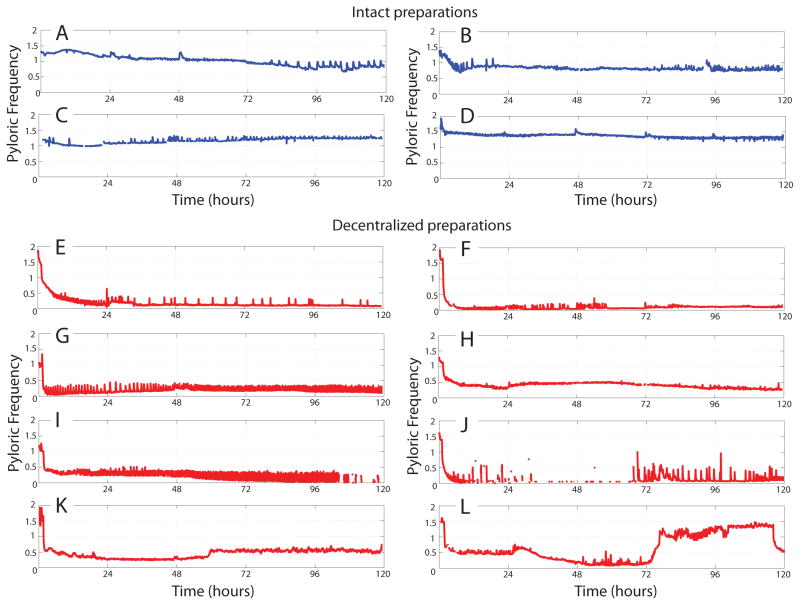
Figure 3.
Example long-term pyloric cycle frequency plots of intact (A–D) and decentralized (E–L) preparations of the STNS. Data are plotted after binning frequencies into 0.1 hour bins. Intact preparations (blue) tend to maintain stable pyloric rhythms with frequencies in the normal range of controls. Decentralized preparations (red) display more varied and variable behavior. Decentralization was accomplished approximately one hour following the beginning of these recordings.

