Abstract
Introduction
Small cell lung cancer (SCLC) accounts for 15% of all lung cancers and has been under-studied for novel therapies. Signaling through fibroblast growth factors (FGF2, FGF9) and their high-affinity receptor (FGFR1) has recently emerged as a contributing factor in the pathogenesis and progression of non-small cell lung cancer (NSCLC). In the present study, we evaluated FGFR1 and ligand expression in primary SCLC samples.
Methods
FGFR1 protein expression, mRNA levels and gene copy number were determined by immunohistochemistry (IHC), mRNA ISH, and silver in situ hybridization (SISH), respectively, in primary tumors from 90 SCLC patients. Protein and mRNA expression of the FGF2 and FGF9 ligands were determined by IHC and mRNA ISH, respectively. Additionally, a second cohort of 24 SCLC biopsy samples with known FGFR1 amplification by fluorescence in situ hybridization (FISH) were assessed for FGFR1 protein expression by IHC. Spearman correlation analysis was performed to evaluate associations of FGFR1, FGF2 and FGF9 protein levels, respective mRNA levels and FGFR1 gene copy number.
Results
FGFR1 protein expression by IHC demonstrated a significant correlation with FGFR1 mRNA levels (p<0.0001) and FGFR1 gene copy number (p=0.03). The prevalence of FGFR1 mRNA positivity was 19.7%. FGFR1 mRNA expression correlated with both FGF2 (p=0.0001) and FGF9 (p=0.002) mRNA levels, as well as with FGF2 (p=0.01) and FGF9 (p=0.001) protein levels. There was no significant association between FGFR1 and ligands with clinical characteristics or prognosis. In the second cohort of specimens with known FGFR1 amplification by FISH, 23 of 24 had adequate tumor by IHC, and 73.9% (17 of 23) were positive for FGFR1 protein expression.
Conclusions
A subset of SCLCs is characterized by potentially activated FGF/FGFR1 pathways, as evidenced by positive FGF2, FGF9 and FGFR1 protein and/or mRNA expression. FGFR1 protein expression is correlated with FGFR1 mRNA levels and FGFR1 gene copy number. Combined analysis of FGFR1 and ligand expression may allow selection of SCLC patients to FGFR1 inhibitor therapy.
Keywords: small cell lung cancer, FGFR1, FGF2, FGF9
INTRODUCTION
Small cell lung cancer (SCLC) comprises approximately 15% of all lung cancers with more than 30,000 new cases per year in the United States (1). SCLC is an extremely aggressive malignancy, with less than 5% survival three years after diagnosis. No major therapeutic progress has been achieved in SCLC in the past decades. Identification of new therapies in SCLC is urgently needed.
Novel molecularly targeted therapies such as epidermal growth factor receptor (EGFR) tyrosine kinase inhibitors and anaplastic lymphoma kinase (ALK) inhibitors have dramatically improved the clinical course for advanced non-small cell lung cancer (NSCLC) patients with EGFR mutations and ALK rearrangements, respectively (2,3). However, there are no approved molecularly targeted therapies for patients with SCLC. Part of the reason for the lack of improvement in care of patients with SCLC is that there is limited availability of tissue for molecular studies due to difficulties in obtaining sufficient tumor samples. This highlights the value of performing and reporting research on available SCLC tissue to advance the identification of novel therapeutically relevant genomic alterations in this disease.
This study focuses on defining the fibroblast growth factor (FGF)/fibroblast growth factor receptor (FGFR) signaling pathway as a target for drug therapy in patients with SCLC. FGFs comprise a complex family of signaling molecules that have been implicated in angiogenesis and inflammation in a wide variety of human disorders (4). Activation of the FGFR1 signaling pathway is thought to drive epithelial – to – mesenchymal transition (EMT), transforming normal cells to tumor cells. Twenty three FGFs and four FGFRs (FGFR1-FGFR4) have been identified. Results of several studies have demonstrated the co-expression of FGF2 and FGF9 ligands in association with FGFR1 in human lung cancers (5, 6). The binding of FGF ligands to FGFRs mediates signal transduction via induction of receptor dimerization and promotes a cascade of downstream Ras-dependent mitogen-activated protein kinase (MAPK) and Ras-independent phosphoinositide 3-kinase (PI3K)-Akt signaling pathways. Other pathways can also be activated by FGFRs, including STAT-dependent signaling (7). The FGF/FGFR signaling pathway has been implicated as an autocrine signaling loop that leads to tumor proliferation and angiogenesis in a variety of NSCLC cell lines (6).
The FGFR1 gene is located on the short arm of chromosome 8 (8p12) and is a member of the FGFR family of tyrosine kinase receptors. FGFR1 amplification, translocation, and point mutations have been described in several tumor types, including breast, prostate, esophageal, bladder, and endometrial cancers and recently in 13–25% of squamous-cell lung cancers (SqCCs) (7–10). In addition, FGFR1 amplification/overexpression has also been found in a subset of patients with non-SqCC NSCLC (11). Recent genomic analysis of a set of 29 SCLC samples has revealed focal FGFR1 amplification among other molecular aberrations (12).
FGF2 is a mitogen and a survival factor in many experimental models and is involved in neo-angiogenesis in vivo. Evidence suggests that FGF2 induces proliferation and chemoresistence in SCLC cells (13). High levels of serum FGF2 have been associated with poor prognosis in SCLC, possibly because of an FGF2 mediated cytoprotective effect, whereby the expression of antiapoptotic proteins are upregulated, promoting resistance to current anticancer treatment (14). However, studies of the FGF2, FGF9-FGFR1 signaling pathway have been typically performed on small series of SCLC tumor samples, likely due to limited availability of SCLC specimens.
Preclinical evidence suggests that SCLC patients may benefit from FGFR inhibitor therapy. Different FGFR inhibitors such as BGJ 398 (Novartis), AZD 4547 (AstraZeneca), Ponatinib (Ariad) and LY2874455 (Eli Lilly) are currently in phase I and II clinical trials (7). The FGFR inhibitor PD173074 has blocked SCLC growth both in vitro and in vivo (13). A small interfering RNA (siRNA) against FGF2 and FGF-ligand traps (FP-1039) have been developed to inhibit FGF ligands in vitro (15, 16). Thus, FGFR and its ligands are promising therapeutic targets.
The aim of this study was to describe the characteristics of the FGF-FGFR1 signaling pathway in SCLC. We first assessed the frequency of FGFR1, FGF2 and FGF9 protein and mRNA expression, and FGFR1 gene amplification from a series of 90 surgically resected primary SCLCs. Next, we assessed the frequency of FGFR1 protein expression in second cohort of 24 SCLC biopsy samples with known FGFR1 amplification. Our goal with the second cohort was to confirm the ability of our selected FGFR1 antibody and methods to detect FGFR1 amplification and to better understand the correlation between FGFR1 amplification and protein expression. We analyzed the data to investigate associations among levels of FGFR1, FGF2, and FGF9 protein and respective mRNA levels, FGFR1 gene amplification, and clinical characteristics. To our knowledge, this is the first study to provide a comprehensive analysis of the FGF2, FGF9- FGFR1 signaling pathway in SCLC.
MATERIALS AND METHODS
Patient population and tumor specimens
Two cohorts of SCLC specimens were studied sequentially. The first cohort was primary SCLC tumor specimens collected from a series of patients with limited disease who underwent pulmonary resection (17). Archival formalin-fixed paraffin-embedded tumor samples were obtained from a unique series of 90 SCLC patients who underwent pulmonary resection between 1982 and 2002 at the Medical University of Gdansk, Poland. In most patients, SCLC histology was established at the time of surgery. All primary diagnoses were reviewed by three experienced pathologists according to the 2004 World Health Organization (WHO) criteria (18). For all patients, medical records were reviewed to obtain clinical characteristics, including age, gender, tumor diameter, TNM stage, and overall survival. In all patients, surgery was followed by standard chemotherapy. Median follow-up was 17.8 months (range, 1–212 months), median survival was 18.7 months and the probability of survival two years after diagnosis was 42%.
The second cohort of 24 SCLC biopsy cases was from the Institute of Pathology at the University Hospital Cologne, Germany with known FGFR1 amplification by fluorescence in situ hybridization (FISH) (19). All of these cases met our criteria for FGFR1 amplification (FGFR1 gene signals ≥ 6 per nucleus or FGFR1/CEN8 ratio ≥ 2).
Tissue microarray (TMA) construction
Ninety surgically resected SCLC specimens from the first cohort were constructed into a tissue microarray (TMA) using a manual MTA-1 Beecher Instrument. Briefly, morphologically representative areas of SCLC were identified and annotated on a hematoxylin and eosin (H&E) stained slide under the microscope by a pathologist. The annotated slides were used to guide dissection of three 0.6 mm diameter cores from different tumor areas of the paraffin embedded blocks. The triplicate cores were set into TMA blocks.
Immunohistochemistry (IHC)
Immunohistochemistry on 4-μm sections was performed using primary commercially available antibodies [FGFR1, Clone EPR806Y, 1:50, Origene, catalog (Cat). TA301021, Rockville, MD; FGF2, Clone N-19, 1:50, Santa Cruz, Cat. Sc - 1390-R; FGF9, Clone D-8, 1:250, Santa Cruz, Cat. Sc - 8413] following manufacturer instructions. The specimens were processed on the Ventana BenchMark XT autostainer utilizing the ultraView detection kit (Ventana, Tucson, AZ, US).
Scoring for protein expression was determined according to the “hybrid scoring system” (H-score) criteria. Specimens were scored based on whichever cellular compartment predominantly stained. For FGFR1, the predominantly stained and scored compartment was always cytoplasmic and/or membranous. For FGF2 and FGF9 specimens demonstrated cytoplasmic and/or nuclear staining. Scoring was performed with the H-score based on the percentage of tumor cells staining at various intensities as follows: 0 × (% tumor cells with no staining) + 1 × (% with faint expression) + 2 × (% with moderate expression) + 3 × (% with strong expression). H-scores for specimens with multiple cores were averaged. Specimens were deemed adequate if at least one core was scored. Three pathologists (LZ, TB and HY) independently scored the first (N=90) and the second cohort (N=24). For discrepant results, a final score was determined by a consensus conference of the pathologists.
mRNA in-situ hybridization (ISH)
mRNA ISH was performed on the tumor tissue using the RNA scope 2.0 assay system with recommended probes from Advanced Cell Diagnostics, Inc (FGFR1 Cat.310071, FGF2 Cat. 312111, FGF9 Cat. 300031). ISH scores were generated and recorded using the following algorithm at 200 x magnification: “0”, no staining; “1”, 1–3 dots per tumor cell; “2”, 4–10 dots per tumor cell; “3”, >10 dots per cell with less than 10% tumor cells with dot clusters; “4”, >10 dots per cell or more than 10% tumor cells with dot clusters as per the RNA scope system scoring guidelines (20).
FGFR1 gene copy number analysis by silver in situ hybridization (SISH)
Dual-color silver in situ hybridization (SISH) was performed on 4-μm sections of the TMA, using a fully automated protocol on the Ventana BenchMark® XT instrument (Ventana, Tucson, AZ, US). All reagents, including FGFR1 DNP probe (FGFR1 locus on 8p12, Cat. 760-1217) and chromosome 8 DIG probe (Centromere 8, CEN8, Cat. 760-1220) cocktails, ultraView SISH and ultraView Alkaline Phosphatase Red ISH detection kits, were obtained from Ventana Medical Systems Inc. (Tucson, AZ, US).
FGFR1 and CEN8 signals were counted separately in 50 non-overlapping tumor nuclei per core. FGFR1 minor signal clusters and major signal clusters were counted as 6 and 12 signals respectively (according to the Ventana Interpretation Guide by Grogan TM et al, see supplemental material).
For each core, the mean copy number per nucleus of each probe (FGFR1 and CEN8), the FGFR1/CEN8 ratio, and the percentage of cells with FGFR1 signal clusters were calculated. FGFR1 amplification was defined as an average of ≥ 4 FGFR1 signals per nucleus or FGFR1/CEN8 ratio ≥ 2. These criteria are in accordance with the American Society of Clinical Oncology/College of American Pathologists updated 2013 guidelines for assessment of HER2 amplification status in breast cancer and have been used in prior FGFR1 studies (11, 21, 22). Two pathologists (LZ, TB) independently scored each core. Any specimens with discrepant results were re-evaluated by both pathologists for a consensus final result.
FGFR1 evaluation by FISH
FISH was performed on 2 cases with positive protein expression but negative FGFR1 SISH amplification results. Slides were subjected to a 3 color FISH assay using a FGFR1 break-apart/amplification probe set consisting of three reagents: a green telomeric probe for FGFR1, a red centromeric probe for FGFR1, and an aqua centromeric probe for the centromere of chromosome 8 (CEN8, Cytocell, Cambridge, UK, Cat. LPS 018 - SA). Fifty nuclei per specimen were analyzed for FGFR1 amplification or rearrangement (described more in detail in supplemental material). FGFR1 amplification was defined as average FGFR1 copies of ≥ 6 fused red/green signals per nucleus or a FGFR1/CEN8 ratio ≥ 2.
Statistical analysis
Statistical analyses were performed with SAS (version 9.4; SAS Institute Inc., Cary, NC). The Student’s t-test was used to evaluate associations between continuous variables including protein expression (H-score 0–300), mRNA expression (score 0–4), gene amplification (copy number), and patient characteristics (age and tumor diameter). The Fisher’s exact test was used to evaluate associations between categorical variables including protein expression, mRNA expression and FGFR1 amplification (positive versus negative) and patient characteristics (sex and stage of disease). Spearman correlation was used to analyze the correlation between FGFR1, FGF2, FGF9 protein and mRNA expression levels and FGFR1 amplification. Kaplan-Meier survival curves were plotted based on overall survival time defined as time from surgery to last follow-up date or date of death. The association between overall survival time with protein expression, mRNA expression and FGFR1 amplification were analyzed using the log-rank test. All tests were considered statistically significant with p-values less than 0.05.
RESULTS
Prevalence and correlation of FGFR1, FGF2 and FGF9 protein expression
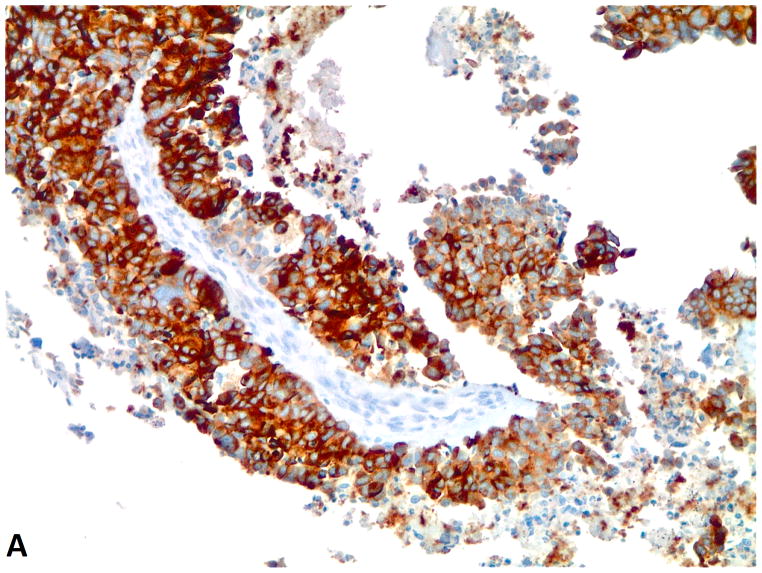
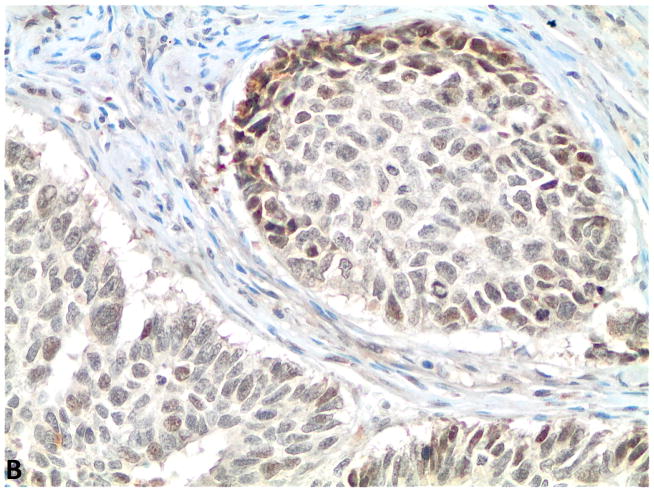
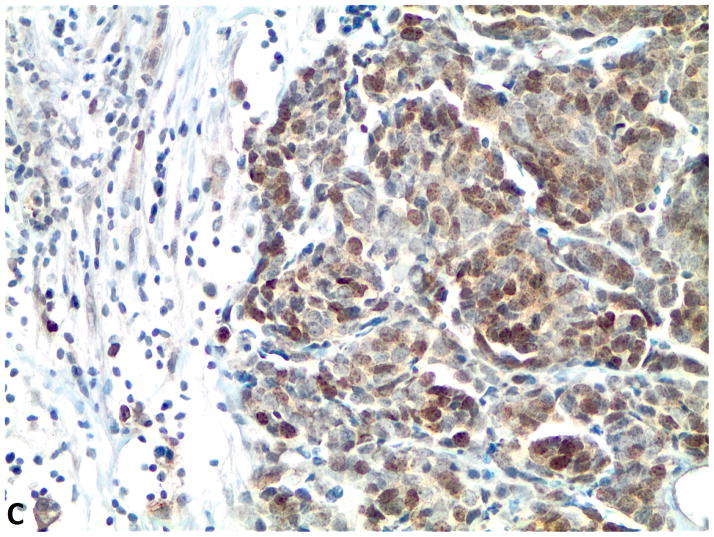
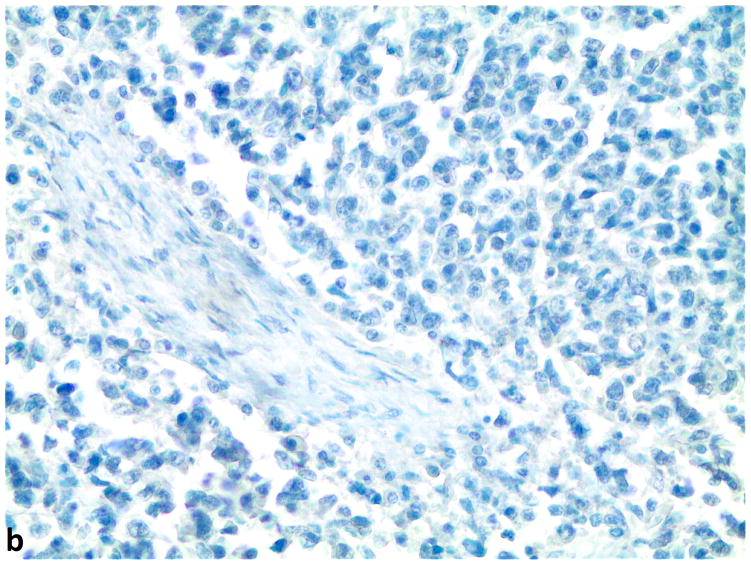
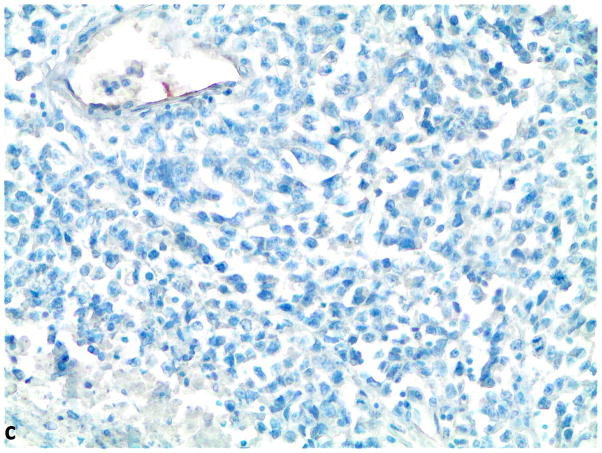
Of 90 specimens from the first cohort of SCLC cases from Poland, FGFR1, FGF2 and FGF9 protein expression was evaluable in 83, 75 and 76 specimens, respectively. Of the specimens that could not be evaluated, we either lacked adequate tissue for all biomarkers or deemed the slide for a tested biomarker inadequate due to too few viable tumor cells. Most of the specimens showed homogeneous staining with little variability of staining of tumor cells in each specimen for FGFR1, FGF2 and FGF9 protein (Supplemental Table 1). FGFR1 protein expression tended to be observed in the cytoplasm and/or membrane, whereas for FGF2 and FGF9, staining was more often localized to the nucleus and/or cytoplasm (Figure 1). These observations are consistent with prior studies demonstrating that FGF ligands translocate to the cell nucleus (5, 23). Scoring was performed on whichever cellular compartment showed the highest protein expression. The average H-score per specimen was calculated based on all evaluable cores. An H-score >10 was defined as the cutoff for FGFR1, FGF2, and FGF9 protein expression positivity due to the inherent difficulty in distinguishing between protein expression and artifact in specimens with H-scores of 10 and under. However, there is no standardized definition for positivity for the FGFR1, FGF2, or FGF9 proteins by the H-score system with no known biologically relevant cutoff for positivity.
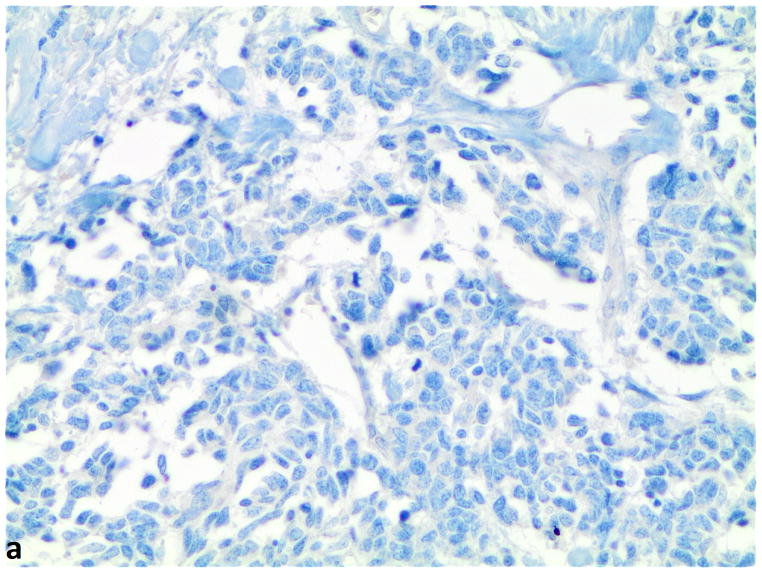
Figure 1.
A–C, FGFR1, FGF2 and FGF9 protein expression in small cell lung cancer (immunohistochemistry, 200x original magnification). A, Positive for cytoplasmic and membranous FGFR1 protein expression (H score=285). B, Positive for nuclear and cytoplasmic FGF2 protein expression (H score =160). C, Positive for nuclear and cytoplasmic FGF9 protein expression (H score=100); a–c, Negative for FGFR1, FGF2 and FGF9 protein expression (H score=0).
Of the evaluated specimens, 7.2% (6/83) were FGFR1 protein expression positive. The H-scores of FGFR1 protein were zero in 75 cases (90.4%), between 0 and 10 for 2 cases, and greater than ten in 6 cases (7.2%). The mean H-score was 9.4 and the range of H-scores was 0 to 285. There was a clear separation between the H-score of 5 for the highest negative case and the H-score of 40 for the lowest positive case (Supplemental Table 1 and Supplemental Figure 1). FGF2 protein expression was positive in 82.7% (62/75) of the specimens, and 63.2% (48/76) were FGF9 protein expression positive. Significant positive correlations were observed between FGFR1 and FGF9 (p=0.01, N=71), and FGF2 and FGF9 protein expression levels (p<0.0001, N=74, Table 1). The analysis for correlation between FGFR1 and FGF2 expression levels did not achieve statistical significance (p=0.1, N=71).
Table 1.
Spearman’s correlation matrix of the FGFR1, FGF2 and FGF9 in SCLC specimens
| FGFR1 IHC |
FGF-2 IHC |
FGF-9 IHC |
FGFR1 mRNA |
FGF-2 mRNA |
FGF-9 mRNA |
|
|---|---|---|---|---|---|---|
|
FGF-2 IHC |
r2: 0.19 p: 0.11 N: 71 |
|||||
|
FGF-9 IHC |
0.29 0.01 71 |
0.57 <0.0001 74 |
||||
|
FGFR1 mRNA |
0.51 <0.0001 73 |
0.30 0.01 73 |
0.37 0.0012 73 |
|||
|
FGF-2 mRNA |
0.28 0.02 75 |
0.31 0.01 74 |
0.42 0.0002 74 |
0.42 0.0001 76 |
||
|
FGF-9 mRNA |
0.14 0.23 73 |
0.26 0.03 74 |
0.21 0.08 74 |
0.36 0.002 75 |
0.40 0.0004 76 |
|
|
FGFR1 SISH |
0.25 0.04 68 |
0.06 0.64 66 |
0.12 0.36 66 |
0.05 0.69 69 |
−0.10 0.39 69 |
−0.01 0.92 68 |
Note: The numbers in the first row are the Spearman correlation coefficients (r2), in the second row are the P values (p), and the third row are the numbers of observations (N). The sample sizes used for the correlation analysis ranged from 66 to 76 due to limits in specimen tumor quality and adequacy for testing of all biomarkers.
No significant association was observed between FGFR1, FGF2, or FGF9 protein expression and clinical characteristics (age, gender, or tumor diameter). A significant association between FGFR1 protein expression and stage was observed with the Fisher’s exact test (p=0.012) but does not follow a logical order by stage with 3.6% positivity for Stage I (N=28), 25.0% for Stage II (N=16), and 2.7% for Stages III and IV (N=38). The significant p-value may be the result of a chance finding due to a small overall number of positive samples (N=6). FGFR1, FGF2 and FGF9 protein expressions were not associated with prognosis (all log rank p-values >0.05).
Prevalence and correlation of FGFR1, FGF2 and FGF9 mRNA levels
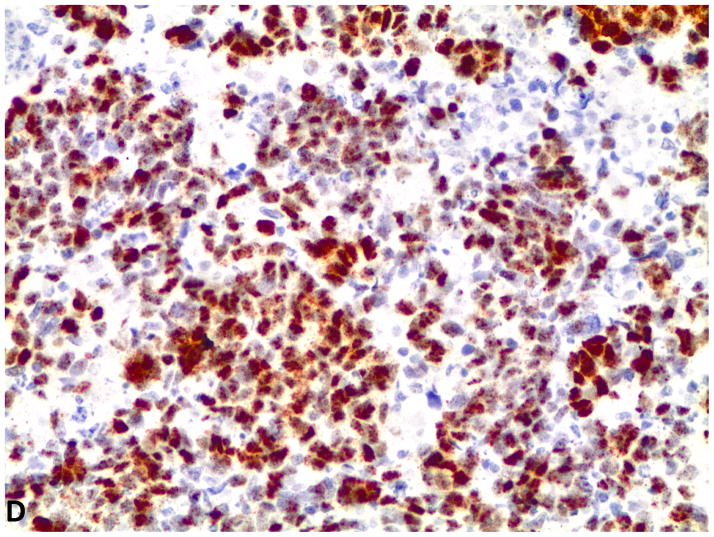
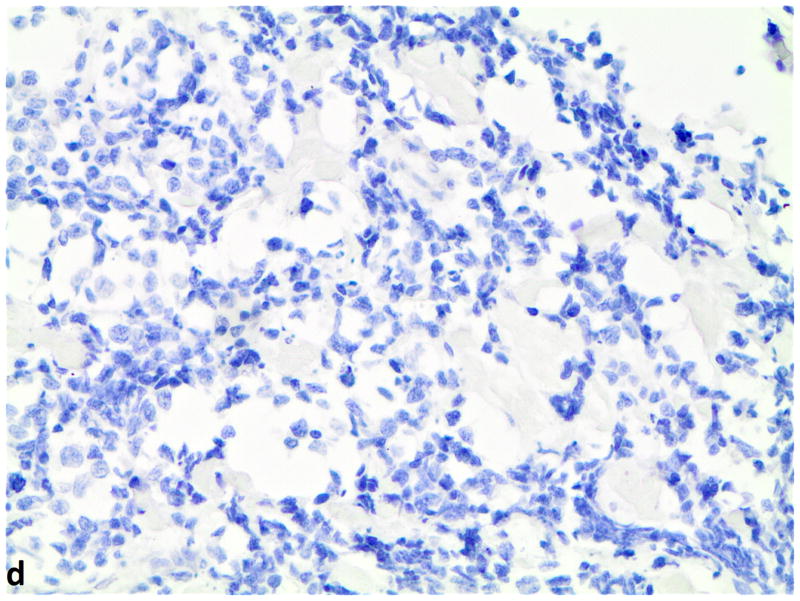
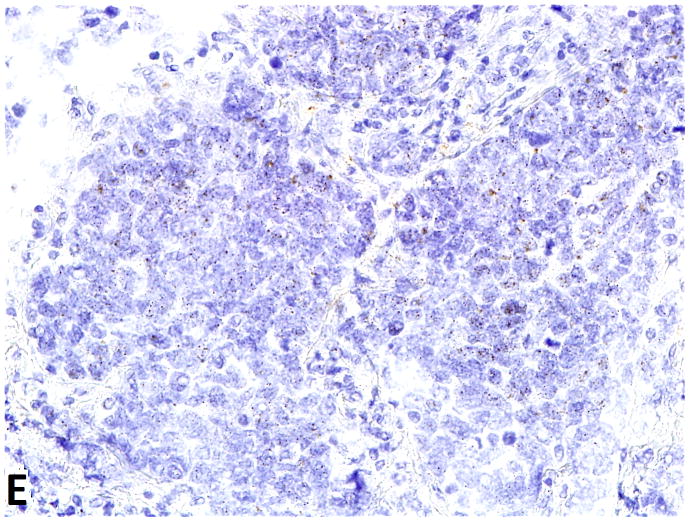
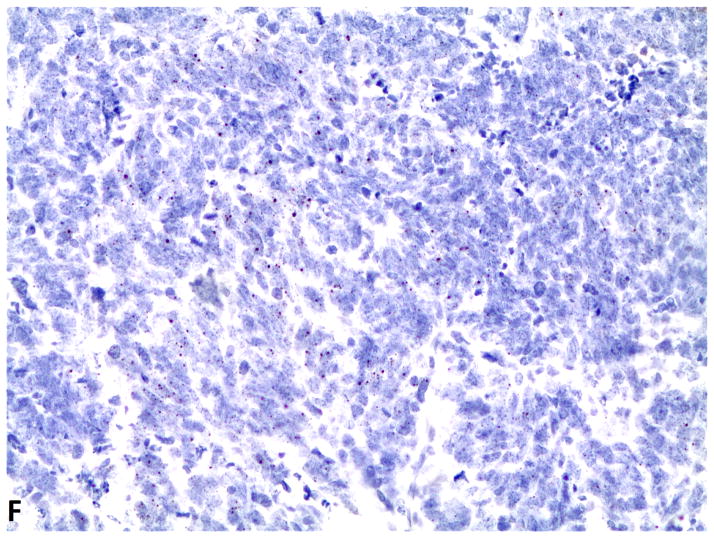
Evaluation of 76 SCLC specimens by FGFR1 mRNA ISH revealed 19.7% (15 of 76) with a positive score defined as ≥3; 9.2% (7 of 76) had a score of 4. Since there is no standard definition for positivity of mRNA ISH, we defined ≥ 3 as the cutoff for mRNA ISH positivity based on the presence of mRNA signal dot clusters in cases with a score of 3 or higher. All of the specimens were negative for FGF2 and FGF9 mRNA expression with RNA expression scores of less than 3. Even so, FGFR1 mRNA expression correlated with both FGF2 mRNA levels (p=0.0001) and FGF9 mRNA levels (p=0.002) (Figure 2). There was also a significant correlation between FGF2 and FGF9 mRNA expression levels (p=0.0004). No significant association was observed between FGFR1, FGF2 and FGF9 mRNA expression and clinical characteristics or prognosis.
Figure 2.
D–F, FGFR1, FGF2 and FGF9 mRNA in small cell lung cancer (in-situ hybridization, 200x original magnification). Brown dots in cells represent mRNA expression. D, FGFR1 mRNA ISH expression (score=4); d, FGFR1 mRNA ISH no expression (score=0). E, FGF2 mRNA ISH expression (score=2). F, FGF9 mRNA ISH expression (score=2).
Prevalence of FGFR1 amplification by SISH
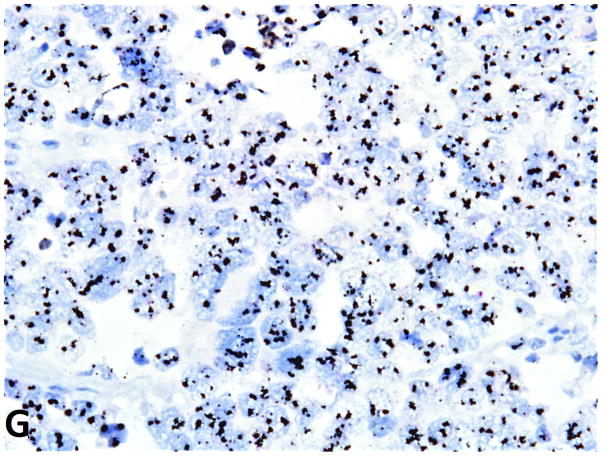
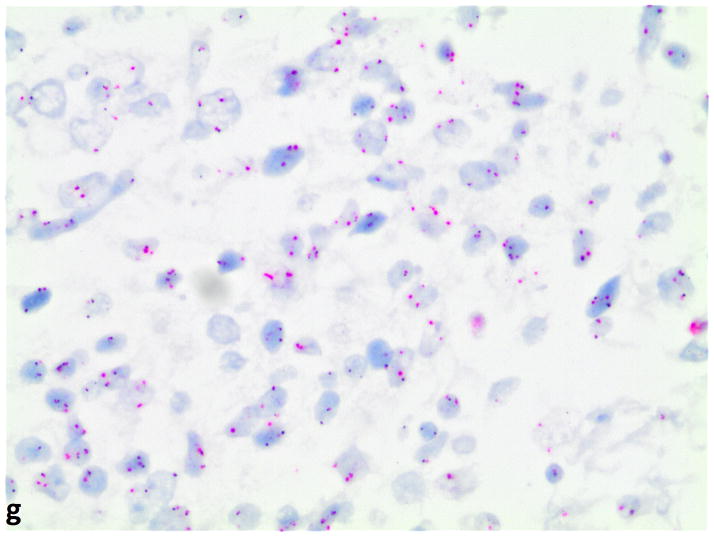
FGFR1 gene copy number was evaluable by SISH in 77 SCLCs. FGFR1 amplification, defined as ≥ 4 FGFR1 signals per nucleus or FGFR1/CEN8 ratio ≥ 2.0, was identified in 6 of 77 of cases (7.8%). A representative image of a case with positive FGFR1 amplification is depicted in Figure 3. All amplified cases (N=6) were positive for both high FGFR1 gene copy number and high FGFR1/CEN8 ratio. In the amplified cases, mean FGFR1 signal per nucleus was 6.2 (range 4.4 to 8.9) and mean FGFR1/CEN8 ratio was 4.5 (range 2.2 to 8.0). The amplified tumors had gene signal clusters in 30–90% of the tumor cells. Tumor FGFR1 amplification was caused by increased gene copy number gain on the chromosome and not chromosome polysomy since none of the positive specimens had more than 3 CEN8 signals per nucleus. No associations were detected between FGFR1 amplification and age, gender, tumor diameter, stage, or overall survival.
Figure 3.
FGFR1 gene amplification in small cell lung cancer (silver in-situ hybridization, 400x original magnification). G, FGFR1 signals are black; CEN8 signals are red in nuclei. FGFR1 amplification (ratio=8); g, nonamplified FGFR1 (ratio=1).
FGFR1 gene analysis by FISH
FISH was performed on two cases which were positive for FGFR1 protein expression by immunohistochemistry but negative for FGFR1 gene amplification by SISH. One specimen had an average of 7 FGFR1 signals and 4 CEN8 signals per nucleus with a normal FGFR1/CEN8 ratio of 1.6. This specimen met our criteria for FGFR1 amplification due to polysomy. The other case was not amplified with a mean FGFR1 signal per nucleus of 2.1 and a FGFR1/CEN8 ratio of 1.1. Neither of those two cases had evidence of FGFR1 gene fusions based on the FISH assay.
Correlation between protein expression, mRNA expression, and gene amplification in the FGF ligand/receptor pathway
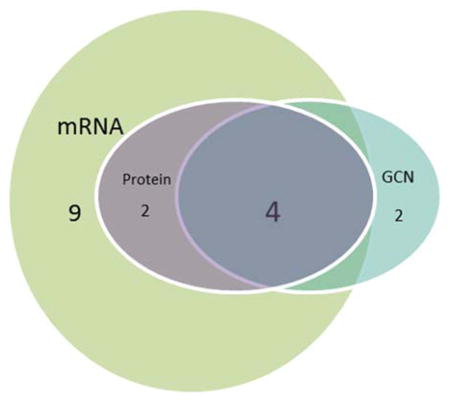
We used correlation analysis to compare protein expression (FGFR1, FGF2, and FGF9), mRNA expression (FGFR1, FGF2, and FGF9), and gene copy number (FGFR1) data from the SCLC patients (Table 1). Analysis of 75 specimens with complete data for FGFR1 protein, mRNA and gene amplification demonstrated significant correlations between FGFR1 protein and FGFR1 mRNA levels (p<0.0001), as well as between FGFR1 protein and FGFR1 gene amplification (p=0.03). Four of the 6 cases with FGFR1 amplification (66.7%) were also positive for FGFR1 protein expression. FGFR1 mRNA expression levels also correlated with FGF2 (p=0.01) and FGF9 (p=0.001) protein levels (Table 1). Overall, 17 of 75 of cases (22.7%) were positive for FGFR1 protein expression and/or mRNA expression and/or amplification (Table 2).
Table 2.
Characteristics of FGFR1 positive cases in the SCLC TMA cohort
| ||||||
|---|---|---|---|---|---|---|
| Gender | Age | Amplification Status by SISH | mRNA ISH score | H-score | Protein Expression | |
| 1 | F | 43 | Amplified | 4 | 80 | Positive |
| 2 | F | 51 | Amplified | 4 | 285 | Positive |
| 3 | M | 62 | Amplified | 4 | 252 | Positive |
| 4 | F | 66 | Amplified | 4 | 60 | Positive |
| 5 | M | 64 | Not amplified* | 4 | 56 | Positive |
| 6 | M | 56 | Not amplified | 4 | 40 | Positive |
| 7 | M | 74 | Amplified | 0.5 | 0 | Negative |
| 8 | M | 59 | Amplified | No score | 0 | Negative |
| 9 | M | 55 | Not amplified | 3 | 0 | Negative |
| 10 | M | 70 | Not amplified | 4 | 0 | Negative |
| 11 | F | 65 | Not amplified | 3 | 0 | Negative |
| 12 | M | 54 | Not amplified | 3 | 0 | Negative |
| 13 | M | 51 | Not amplified | 3 | 0 | Negative |
| 14 | F | 69 | Not amplified | 3 | 0 | Negative |
| 15 | M | 67 | Not amplified | 3 | 0 | Negative |
| 16 | M | 56 | Not amplified | 3 | 0 | Negative |
| 17 | F | 69 | Not amplified | 3.5 | 5 | Negative |
NOTE: The positive cases were defined as cases with gene amplification and/or mRNA positivity and/or protein expression positivity. GCN: gene copy number.
Case 5 was negative for FGFR1 gene amplification by SISH but positive by FISH due to polysomy. Tissue was not available from case 8 for testing by mRNA ISH.
All but one of the 24 SCLC biopsy samples from the German cohort with known FGFR1 amplification could be evaluated for FGFR1 protein expression. Seventeen of the 23 cases (73.9%) were positive for FGFR1 protein expression (H-score > 10) and zero in the remaining 6 cases (26.1%). The mean H-score was 68.3. The H-score of positive cases ranged from 20 to 210 (Supplemental Table 2). Overall, the pattern of FGFR1 protein expression appeared homogenous.
Collectively, there were 29 cases with FGFR1 amplification in the two cohorts. Among these FGFR1 amplified cases, 72.4% (21/29) were FGFR1 protein expression positive. Of the non-amplified cases within the first cohort, 3% (2 of 69) were positive for FGFR1 protein expression. Positive FGFR1 protein expression was significantly more frequent in SCLC amplified cases compared to non-amplified cases (Fisher Exact Test, p=0.0001).
DISCUSSION
The FGF/FGFR signaling axis plays an important role in normal organ, vascular, and skeletal development. Dysregulation of FGF/FGFR signaling has been observed in different tumor settings and plays a key role in driving tumor angiogenesis (7). Also, the FGF/FGFR signaling pathway has been implicated as an EGFR-therapy resistance pathway in studies of lung cancer cell lines, as well as in vivo studies (6, 7, 8, 11, 12, 19). Our studies of protein, mRNA and gene amplification of FGFR1 and its associated ligands, FGF2 and FGF9, in resected SCLC specimens provide a better understanding of the FGF/FGFR signaling axis biomarkers in SCLC, and reinforce the FGFR pathway as a potential relevant targeted pathway for drug development in SCLC, which has an unmet need for new treatment options.
The prevalence of FGFR1 protein expression that we detected in the first SCLC cohort (7.2%) was lower than the study of SCLC by Yang et al (43.7%) (24). This difference may be due to a difference in antibodies used (Origene versus Abcam), specimen processing, scoring protocol, cutoffs for positivity, or cohort characteristics. Nevertheless, the high level of this discrepancy clearly indicates the need for standardization. One unknown factor in our study is the role of storage on the restropective analysis of archival material. The stability of the FGFR1 protein over time is not known. As with all biomarkers, it will be important to develop standardized methods for IHC evaluation of FGFR1 protein expression. Analysis comparing FGFR1 protein expression with stage was inconclusive due to the small number of positive samples (N=6). The prior study by Yang et al. (24) suggests that FGFR1 protein expression in SCLC may be associated with stage.
The prevalence of FGFR1 mRNA positive expression in this current SCLC study (19.7%) is lower than that in our prior studies in SqCC (28%, N=89) and adenocarcinoma (22%, N=45) (11). The prevalence of FGFR1 amplification in our SCLC cohort by SISH (7.8%) is similar to that in prior SCLC studies of FGFR1 amplification by FISH (5.6% –7% prevalence) (18,25). The FGFR1 amplification prevalence in SCLC specimens is lower than that reported for SqCC specimens (13–25%) (8–10). Interestingly, FGFR1 amplification by FISH was not observed in a study including 97 lung adenocarcinomas (0%) (26). These differences in FGFR1 amplification prevalence may be attributed to several factors, including a different prevalence of smoking associated with these tumor subtypes (27). Indeed, almost all of patients with SCLC and SqCC are smokers (28).
FGFR1 protein expression significantly correlated with both FGFR1 mRNA expression level (p<0.0001) and FGFR1 gene copy number (p=0.03). Of note, all cases with positive protein expression had the highest score (score of 4) for FGFR1 mRNA expression. Five of 6 specimens positive for protein expression were also positive for FGFR1 amplification by SISH or FISH. FISH detected amplification due to polysomy in one specimen that was negative for amplification by SISH. Possible explanations for this discrepancy between the SISH and FISH are tumor heterogeneity, differences in specimen processing, assay sensitivities, or scoring criteria.
FGFR1 gene copy number has been used as a biomarker in multiple studies to predict sensitivity to FGFR1 inhibitors (8, 9, 29), but a recent preclinical study concludes that FGFR1 protein and mRNA expression predict TKI sensitivity better than FGFR1 gene copy number (11). In addition, some phase I studies using FGFR inhibitors in patients with advanced solid tumors suggest that FGFR1 amplification is not an absolute predictor of FGFR inhibition (8, 30, 31). Furthermore, fusions of the FGFR gene have been described in NSCLC, but their clinical significance is still unknown (32, 33). We are not aware of any fusions/mutations described in SCLC. In comparing methodologies for screening, it is important to consider the lower cost and greater availability of IHC in pathology laboratories compared to methods such as FISH which requires more specialized training and equipment.
Similar to studies of other biomarkers, such as ALK and EGFR, we identified several cases with discrepancies between positivity for FGFR1 protein expression, mRNA expression and gene copy number. Other preclinical FGFR1 studies have also reported on such discrepancies (11,34,35). FISH methodology may not detect complex amplifications or other alterations of the FGFR1 gene, such as point mutations, fusions and chromosomal translocations, which may all result in changes in protein expression. However, several patients with NSCLC and positive ALK protein expression but negative ALK amplification have shown dramatic response to ALK-inhibitors (35, 36, 37). In a recent study, FISH and IHC were systematically used to test for EML4-ALK rearrangements in 51 lung adenocarcinoma specimens, with additional testing of discordant cases by next-generation sequencing (NGS)(38). NGS confirmed ALK alterations in 4 of 5 patients who were positive with IHC and negative with FISH. Two of these IHC-positive, FISH-negative patients were treated with crizotinib and had progression- free survival of 6 and 18 months (38). Thus, patients with changes in a biomarker protein or mRNA expression may benefit from directed therapy, even without a detected genetic abnormality for the corresponding biomarker gene (11). Hence, we suggest that patients with SCLC with positive FGFR1, FGF2, and FGF9 protein and/or mRNA expression levels be considered for further clinical studies of FGFR inhibitors.
Our analysis showed that FGFR1 mRNA expression correlated with both FGF2 and FGF9 mRNA levels, as well as with FGF2 and FGF9 protein levels. These findings are consistent with several independent studies which have shown co-expression of FGF2 and FGFR1 in NSCLC specimens (5, 39). Some researchers propose that co-expression of FGFR1 and one or more ligands represent the oncogenic driving event in lung cancer (11). FGFR1 and ligand double positivity may more accurately represent SCLC driven by the FGF signaling pathway than FGFR1, FGF2, or FGF9 as single biomarkers (11).
In summary, a subset of patients with SCLC is characterized by tumors with potentially activated FGF/FGFR1 pathways, as evidenced by positive FGF2, FGF9 and FGFR1 protein and/or mRNA expression and/or FGFR1 gene copy number. Further studies are needed to determine whether or not this subset of SCLC patients would benefit from FGF/FGFR1-directed targeted therapies.
Supplementary Material
Acknowledgments
Grant Support:
This study was supported by grants from NIH (Lung SPORE P50 CA058187), Colorado Lung Cancer Association, Medical University of Gdansk (grant ST-23), Cancer Center Molecular Pathology Shared Resource (CCSG NCI P30CA046934) and Ventana Roche Inc.
Contributor Information
Liping Zhang, Department of Pathology, Shanghai Pulmonary Hospital, Tongji University School of Medicine, Tongji University Institute, People’s Republic of China; Division of Medical Oncology, University of Colorado Anschutz Medical Campus, Aurora, CO, USA.
Hui Yu, Department of Pathology, Shanghai Pulmonary Hospital, Tongji University School of Medicine, Tongji University Institute, People’s Republic of China; Division of Medical Oncology, University of Colorado Anschutz Medical Campus, Aurora, CO, USA.
Andrzej Badzio, Department of Oncology and Radiotherapy, Medical University of Gdansk, Poland.
Theresa A Boyle, Division of Medical Oncology, University of Colorado Anschutz Medical Campus, Aurora, CO, USA.
Hans-Ulrich Schildhaus, Institute of Pathology, University Hospital Cologne, Cologne, Germany.
Xian Lu, Department of Biostatisitcs and Informatics, University of Colorado Anschutz Medical Campus, Aurora, CO, USA.
Rafal Dziadziuszko, Department of Oncology and Radiotherapy, Medical University of Gdansk, Poland.
Jacek Jassem, Department of Oncology and Radiotherapy, Medical University of Gdansk, Poland.
Marileila Varella-Garcia, Division of Medical Oncology, University of Colorado Anschutz Medical Campus, Aurora, CO, USA.
Lynn E. Heasley, Department of Craniofacial Biology, University of Colorado Anschutz Medical Campus, Aurora, CO, USA.
Ashley A. Kowalewski, Division of Medical Oncology, University of Colorado Anschutz Medical Campus, Aurora, CO, USA.
Kim Ellison, Division of Medical Oncology, University of Colorado Anschutz Medical Campus, Aurora, CO, USA.
Gang Chen, Department of Pathology, Shanghai Pulmonary Hospital, Tongji University School of Medicine, Tongji University Institute, People’s Republic of China.
Caicun Zhou, Department of Oncology, Shanghai Pulmonary Hospital, Tongji University School of Medicine, Tongji University Institute, People’s Republic of China.
Fred R. Hirsch, Division of Medical Oncology, University of Colorado Anschutz Medical Campus, Aurora, CO, USA.
References
- 1.Govindan R, Page N, Morgensztern D, et al. Changing epidemiology of small-cell lung cancer in the United States over the last 30 years: analysis of the surveillance, epidemiologic, and end results database. J Clin Oncol. 2006;24:4539–4544. doi: 10.1200/JCO.2005.04.4859. [DOI] [PubMed] [Google Scholar]
- 2.Giaccone G. Epidermal growth factor receptor inhibitors in the treatment of non-small-cell lung cancer. J Clin Oncol. 2005;23:3235–3242. doi: 10.1200/JCO.2005.08.409. [DOI] [PubMed] [Google Scholar]
- 3.Kwak EL, Bang YJ, Camidge DR, et al. Anaplastic lymphoma kinase inhibition in non-small-cell lung cancer. N Engl J Med. 2010;363:1693–1703. doi: 10.1056/NEJMoa1006448. [DOI] [PMC free article] [PubMed] [Google Scholar]
- 4.Beenken A, Mohammadi M. The FGF family: biology, pathophysiology and therapy. Nat Rev Drug Discov. 2009;8:235–253. doi: 10.1038/nrd2792. [DOI] [PMC free article] [PubMed] [Google Scholar]
- 5.Behrens C, Lin HY, Lee JJ, et al. Immunohistochemical expression of basic fibroblast growth factor and fibroblast growth factor receptors 1 and 2 in the pathogenesis of lung cancer. Clin Cancer Res. 2008;14:6014–6022. doi: 10.1158/1078-0432.CCR-08-0167. [DOI] [PMC free article] [PubMed] [Google Scholar]
- 6.Marek L, Ware KE, Fritzsche A, et al. Fibroblast growth factor (FGF) and FGF receptor-mediated autocrine signaling in non-small-cell lung cancer cells. Mol Pharmacol. 2009;75:196–207. doi: 10.1124/mol.108.049544. [DOI] [PMC free article] [PubMed] [Google Scholar]
- 7.Brooks AN, Kilgour E, Smith PD. Molecular pathways: fibroblast growth factor signaling: a new therapeutic opportunity in cancer. Clin Cancer Res. 2012;18:1855–1862. doi: 10.1158/1078-0432.CCR-11-0699. [DOI] [PubMed] [Google Scholar]
- 8.Weiss J, Sos ML, Seidel D, et al. Frequent and focal FGFR1 amplification associates with therapeutically tractable FGFR1 dependency in squamous cell lung cancer. Sci Transl Med. 2010;2:62ra93. doi: 10.1126/scitranslmed.3001451. [DOI] [PMC free article] [PubMed] [Google Scholar]
- 9.Kim HR, Kim DJ, Kang DR, et al. Fibroblast growth factor receptor 1 gene amplification is associated with poor survival and cigarette smoking dosage in patients with resected squamous cell lung cancer. J Clin Oncol. 2013;31:731–737. doi: 10.1200/JCO.2012.43.8622. [DOI] [PubMed] [Google Scholar]
- 10.Tran TN, Selinger CI, Kohonen-Corish MR, et al. Fibroblast growth factor receptor 1 (FGFR1) copy number is an independent prognostic factor in non-small cell lung cancer. Lung Cancer. 2013;81:462–467. doi: 10.1016/j.lungcan.2013.05.015. [DOI] [PubMed] [Google Scholar]
- 11.Wynes MW, Hinz TK, Dexiang G, et al. FGFR1 mRNA and protein expression, not gene copy number, predict TKI sensitivity across all lung cancer histologies. Clin Cancer Res. 2014;20:3299–3309. doi: 10.1158/1078-0432.CCR-13-3060. [DOI] [PMC free article] [PubMed] [Google Scholar]
- 12.Peifer M, Fernández-Cuesta L, Sos ML, et al. Integrative genome analyses identify key somatic driver mutations of small-cell lung cancer. Nat Genet. 2012;44:1104–1110. doi: 10.1038/ng.2396. [DOI] [PMC free article] [PubMed] [Google Scholar]
- 13.Pardo OE, Latigo J, Jeffery RE, et al. The fibroblast growth factor receptor inhibitor PD173074 blocks small cell lung cancer growth in vitro and In vivo. Cancer Res. 2009;69:8645–8651. doi: 10.1158/0008-5472.CAN-09-1576. [DOI] [PubMed] [Google Scholar]
- 14.Pardo OE, Wellbrock C, Knanzada UK. FGF-2 protects small cell lung cancer cells from apoptosis through a complex involving PKCepsilon, B-Raf and S6K2. EMBO J. 2006;25:3078–3088. doi: 10.1038/sj.emboj.7601198. [DOI] [PMC free article] [PubMed] [Google Scholar]
- 15.Hideki T, Kenzo S, Hiroyuki Y, et al. Activation of the FGF2-FGFR1 autocrine pathway: a novel mechanism of acquired resistance to gefitinib in NSCLC. Mol Caner Res. 2013;11:759–767. doi: 10.1158/1541-7786.MCR-12-0652. [DOI] [PubMed] [Google Scholar]
- 16.Zhang H, Lorianne M, Baker K, et al. FP-1039 (FGFR1:Fc), a soluble FGFR1 receptor antagonist, inhibits tumor growth and angiogenesis; Proceedings of the AARC-NCI-EORTC International Conference: Molecular Targets and Cancer Therapeutics; 2007 Oct 22–26; San Francisco. Philadelphia (PA): AACR; 2007. p. Abstract nr B55. [Google Scholar]
- 17.Badzio A, Wynes MW, Dziadziuszko R, et al. Increased insulin-like growth factor 1 receptor protein expression and gene copy number in small cell lung cancer. J Thorac Oncol. 2010;5:1905–1911. doi: 10.1097/JTO.0b013e3181f38f57. [DOI] [PMC free article] [PubMed] [Google Scholar]
- 18.Travis WD, Brambilla E, Muller-Hermelink HK, et al., editors. Pathology and Genetics of Tumors of the Lung, Pleura, Thymus and Heart. IARC Press; Lyon: 2004. World Health Organization Classification of Tumors. [Google Scholar]
- 19.Schultheis AM, Bos M, Schmitz K, et al. Fibroblast growth factor receptor1(FGFR1) amplification is a potential therapeutic target in small-cell lung cancer. Mod Pathol. 2014;27:214–221. doi: 10.1038/modpathol.2013.141. [DOI] [PubMed] [Google Scholar]
- 20.Wang F, Flanagan J, Su N, et al. RNAscope: a novel in situ RNA analysis platform for formalin-fixed paraffin-embedded tissues. J Mol Diagn. 2012;14:22–29. doi: 10.1016/j.jmoldx.2011.08.002. [DOI] [PMC free article] [PubMed] [Google Scholar]
- 21.Kohler LH, Mireskandari M, Knösel T, et al. FGFR1 expression and gene copy numbers in human lung cancer. Virchows Arch. 2012;461:49–57. doi: 10.1007/s00428-012-1250-y. [DOI] [PubMed] [Google Scholar]
- 22.Wolff AC, Hammond ME, Hicks DG, et al. Recommendations for human epidermal growth factor receptor 2 testing in breast cancer: American Society of Clinical Oncology/College of American Pathologists clinical practice guideline update. J Clin Oncol. 2013;31:3997–4013. doi: 10.1200/JCO.2013.50.9984. [DOI] [PubMed] [Google Scholar]
- 23.Stachowiak MK, Macher PA, Stachowiak EK, et al. Integrative nuclear signaling in cell development – a role for FGFR-1. DNA Cell Biol. 2007;26:811–826. doi: 10.1089/dna.2007.0664. [DOI] [PubMed] [Google Scholar]
- 24.Yang F, Gao Y, Geng J, et al. Elevated expression of SOX2 and FGFR1 in correlation with poor prognosis in patients with small cell lung cancer. Int J Clin Exp Pathol. 2013;6:2846–2854. [PMC free article] [PubMed] [Google Scholar]
- 25.Anish T, Jih-Hsiang L, Zied A, et al. Characterization of fibroblast growth factor receptor 1 in small-cell lung cancer. J Thorac Oncol. 2014;9:567–571. doi: 10.1097/JTO.0000000000000089. [DOI] [PMC free article] [PubMed] [Google Scholar]
- 26.Schildhaus HU, Heukamp LC, Merkelbach-Bruse S, et al. Definition of a fluorescence in-situ hybridization score identifies high- and low-level FGFR1 amplification types in squamous cell lung cancer. Mod Pathol. 2012;25:1473–1480. doi: 10.1038/modpathol.2012.102. [DOI] [PMC free article] [PubMed] [Google Scholar]
- 27.An NS, Yan J, Hee JL, et al. FGFR1 amplification is associated with poor prognosis and smoking in non-small-cell lung cancer. Virchows Arch. 2014;465:547–558. doi: 10.1007/s00428-014-1634-2. [DOI] [PubMed] [Google Scholar]
- 28.Pesch B, Kendzia B, Gustavsson P, et al. Cigarette smoking and lung cancer- relative risk estimates for the major histological types from a pooled analysis of case- control studies. Int J Cancer. 2012;131:1210–1219. doi: 10.1002/ijc.27339. [DOI] [PMC free article] [PubMed] [Google Scholar]
- 29.Zhang J, Zhang L, Su X, et al. Translating the therapeutic potential of AZD4547 in FGFR1-amplified non–small cell lung cancer through the use of patient-derived tumor xenograft models. Clin Cancer Res. 2012;18:6658–6667. doi: 10.1158/1078-0432.CCR-12-2694. [DOI] [PubMed] [Google Scholar]
- 30.Wolf J, LoRusso PM, Camidge RD, et al. A phase I dose escalation study of NVP-BGJ398, a selective pan FGFR inhibitor in genetically preselected advanced solid tumors [Abstract]; Proceedings of the 103rd Annual Meeting of the American Association for Cancer Research; 2012 Mar 31–Apr 4; Chicago, IL. Philadelphia (PA): AACR; p. Abstract nr. LB-122. [Google Scholar]
- 31.Andre F, Ranson M, Dean E, et al. Results of a phase I study of AZD4547, an inhibitor of fibroblast growth factor receptor (FGFR), in patients with advanced solid tumors [Abstract]; Proceedings of the 104th Annual Meeting of the American Association for Cancer Research; 2013 Apr6–10; Washington, DC. Philadelphia (PA): AACR; p. Abstract nr. LB-145. [Google Scholar]
- 32.Rui W, Lei W, Yuan L, et al. FGFR1/3 tyrosine kinase fusions define a unique molecular subtype of non-small-cell lung cancer. Clin Cancer Res. 2014;20:4107–4114. doi: 10.1158/1078-0432.CCR-14-0284. [DOI] [PubMed] [Google Scholar]
- 33.Wu YM, Su F, Kalyana-Sundaram S, et al. Identification of targetable FGFR gene fusions in diverse cancers. Cancer Discov. 2013;3:636–647. doi: 10.1158/2159-8290.CD-13-0050. [DOI] [PMC free article] [PubMed] [Google Scholar]
- 34.Hirsch FR, Varella-Garcia M, Bunn PA, Jr, et al. Epidermal growth factor receptor in non-small-cell lung carcinomas: correlation between gene copy number and protein expression and impact on prognosis. J Clin Oncol. 2003;21:3798–3807. doi: 10.1200/JCO.2003.11.069. [DOI] [PubMed] [Google Scholar]
- 35.Peled N, Palmer G, Hirsch FR, et al. Next-generation sequencing identifies and immunohistochemistry confirms a novel crizotinib-sensitive ALK rearrangement in a patient with metastatic non-small-cell lung cancer. J Thorac Oncol. 2012;7:e14–16. doi: 10.1097/JTO.0b013e3182614ab5. [DOI] [PMC free article] [PubMed] [Google Scholar]
- 36.Sun JM, Choi YL, Won JK, et al. A dramatic response to crizotinib in a non-small-cell lung cancer patient with IHC-positive and FISH-negative ALK. J Thorac Oncol. 2012;7:e36–38. doi: 10.1097/JTO.0b013e318274694e. [DOI] [PubMed] [Google Scholar]
- 37.Ren S, Hirsch FR, Varella-Garcia M, et al. Atypical negative ALK break-apart FISH harboring a crizotinib-responsive ALK rearrangement in non-small-cell lung cancer. J Thorac Oncol. 2014;9:e21–23. doi: 10.1097/JTO.0000000000000013. [DOI] [PMC free article] [PubMed] [Google Scholar]
- 38.Marina PZ, Hirsch FR, Lior SG, et al. Fluorescence in situ hybridization, immunohistochemistry, and next-generation sequencing for detection of EML4-ALK rearrangement in lung cancer. The Oncologist. 2015;20:1–7. doi: 10.1634/theoncologist.2014-0389. [DOI] [PMC free article] [PubMed] [Google Scholar]
- 39.Donnem T, Al-Shibli K, Al-Saad S, et al. Prognostic impact of fibroblast growth factor 2 in non-small cell lung cancer: coexpression with VEGFR-3 and PDGF-B predicts poor survival. J Thorac Oncol. 2009;4:578–585. doi: 10.1097/JTO.0b013e31819f2e38. [DOI] [PubMed] [Google Scholar]
Associated Data
This section collects any data citations, data availability statements, or supplementary materials included in this article.


