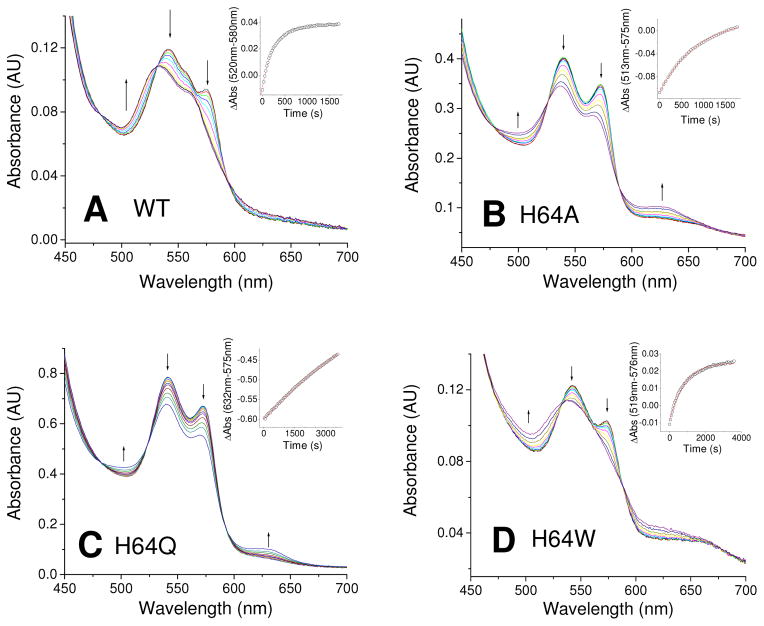
Figure 2. Autoxidation of Ngb wild type and His64 mutants.
The plots show selected spectra during the time course of autoxidation for each mutant. Arrows indicate the direction of the absorbance change. Insets show the fitting of the decay to a single exponential equation. A; Wild-type; B, H64A; C, H64Q, D, H64W.

