

Abstract
Breast cancer is the leading cause of cancer-related mortality for females worldwide.1 Improving early screening strategies and understanding the events that lead to tumor initiation have led to demonstrable improvements in clinical outcome. Our previous work revealed a variance in the tumorigenic capacity between different mammary epithelial cell populations in an MMTV-ErbB2 mouse model. In order to greater understand how different mammary epithelial cells influence the tumorigenic capacity in ErbB2-induced breast cancer, we transplanted different cell populations from pre-neoplastic MMTV-ErbB2 female mice into recipient mice for tumorigenic study. We found that different mammary epithelial cells bear different tumorigenic potential even when induced by the same ErbB2 proto-oncogene. To understand the difference in tumors formed from different epithelial cells, we performed gene expression profiling using these tumors (GSE64487). Several genes were further validated using real-time reverse transcription polymerase chain reaction (RT-PCR). Here we provide further details on the experimental methods and microarray analysis. This data provides a resource to further understanding how different mammary cell populations can initiate ErbB2-driven tumors and the role of these cell populations as putative tumor-initiating cells (TICs).
Keywords: Breast cancer, tumor-initiating cells, mammary stem cells, luminal progenitors, myoepithelial cells
Specifications
| Organism/cell line/tissue | Mus musculus |
| Sex | Female |
| Sequencer or array type | Illumina Infinium MouseWG-6 v2.0 |
| Data format | Raw: Available in TXT file Processed: Available in series_matrix.TXT |
| Experimental factors | Mammary tumors derived from basal and luminal mammary compartments. |
| Experimental features | Gene expression profiling in MMTV-ErbB2 tumors derived from wild-type (WT) luminal progenitors (LP), myoepithelial cells (Myo), and mammary stem cells (MSC). Additional expression profiling for tumors derived from LP from MMTV-ErbB2/lkkaAA/AA (AA). The expression levels of selected genes were confirmed using RT-PCR. |
| Consent | N/A |
| Sample source location | Department of Pathology, University of Iowa, Iowa City, IA |
Direct link to deposited data
Microarray: http://www.ncbi.nlm.nih.gov/geo/query/acc.cgi?acc=GSE64487
Experimental Design, Materials and Methods
Tumor Samples
Tumor samples were collected from paired primary cell grafts from our previous work.2 Briefly, 5×10⁴ sorted mammary epithelial cells from MMTV-ErbB2 background were orthotopically transplanted into the #2 mammary fat pad of Rag1-/- female mice in a pairwise fashion. The sorting scheme for individual cell populations consisted of epithelial enrichment using Mammary Epithelial Cell Enrichment Kit (Stemcell, Vancouver, BC, Canada), and magnetic purification against CD45-, CD31-, and Ter119-positve cells. Luminal and basal cell populations were isolated using fluorescence activated cell sorting (FACS) in the following scheme: CD24medCD49fhi mammary stem cells (MSC), CD24medCD49flo mature myoepithelial cells (Myo), and CD24hiCD49floCD61+ luminal progenitors (LP). Tumor growth was monitored over 3 months and tumor samples were harvested before RNA extraction. Sample IDs in GSE64487 correspond to Tumor_Cell Type_Allele_Mouse, i.e. Tumor_LP_WT_1. The final number on the ID corresponds to paired tumors derived from the same mouse.
RNA Preparation
Total RNA was isolated from 20 mg of tumor samples that were homogenized into RLT buffer (QIAGEN, Venlo, Limburg, Netherlands). RNA was isolated using the RNeasy Plus mini kit (QIAGEN), according to the manufacturer's instruction. RNA extracts were assessed for quality by Agilent 2100 Bioanalyzer, samples with A260/280 (2.0±0.1), A260/230 (2.0±0.1), and RNA integrity number (RIN) ≥ 8.7 were used for further experimentation.3 Twelve tumor samples were selected: 3 WT LP, 3 WT MSC, 3 WT Myo, and 3 MTV-ErbB2/lkkaAA/AA (AA) LP.
Gene Expression Microarray
A total of 100 ng of RNA for each sample was submitted to the Iowa Institute of Human Genetics Genomics Division for RNA sample preparation (cDNA synthesis and in vitro transcription). The Genomics Division also performed the subsequent hybridization onto the Illumina Mouse WG-6 v2.0 for 17 h at 58° C. Chips were stained with streptavidin-Cy3 (GE Healthcare, Piscataway, NJ) and scanned. More detailed methodology of the Iowa Institute of Human Genetics Genomics Division procedure for Illumina Mouse WG-6 v2.0 for this microarray profiling has been described previously in supplemental methods.4
Microarray Analysis
Beadchips were scanned with the Illumina iScan System and data was collected using GenomeStudio software v2011.1. Microarray data was quantile normalized and transformed into log2 expression by the Iowa Institute of Human Genetics Bioinformatics Division (Figure 1).
Figure 1.
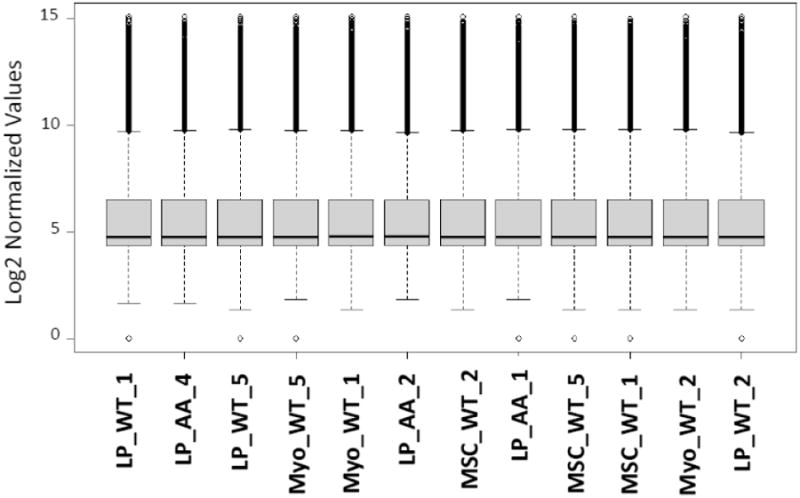
Box plot of the quantile normalized expression level for the 12 microarrays. The line bisecting the boxplot is the mean probe value. Samples appear in the order of series matrix file of GSE64487 dataset, the order of the original blinding of the RNA experiment.
A total of 33,622 coding transcripts were analyzed using the quantile-normalized values. Fold change was calculated by the average log2 expression differences in the indicated group comparisons. The volcano plots were generated in R with the use of Student's T test and generic plot function. Genes highlighted in the volcano plots had a P-value < 0.05 and an absolute value of the average log2 fold change > 1 (red ≥ 1 log2 fold change and green ≤ -1). The 20 genes with the greatest fold change between the groups were further displayed in heatmaps, generated in R using the gplots package.5
Expression values were compared based on the tumor-initiating cells (TIC) that gave rise to the tumors. Previously, we published the comparison between LP- and MSC-derived tumors, finding that the non-canonical Wnt5a was downregulated in MSC-derived tumors.4 We also conducted comparisons between the tumors from LP WT versus LP AA to investigate the transcriptional differences with the inactivation of IKK-α (CHUK) in luminal progenitors (Figure 2A, 2B). We continued our transcriptional comparisons with the analysis of tumors derived from Myo and MSC, two cell types of the basal compartment that gave rise to ErbB2-driven tumors (Figure 3A, 3B). Finally, as another comparison between tumors derived from cells of the basal versus luminal compartments, we compared the transcriptional profiles of the Myo- and LP-derived tumors (Figure 4A, 4B).
Figure 2.
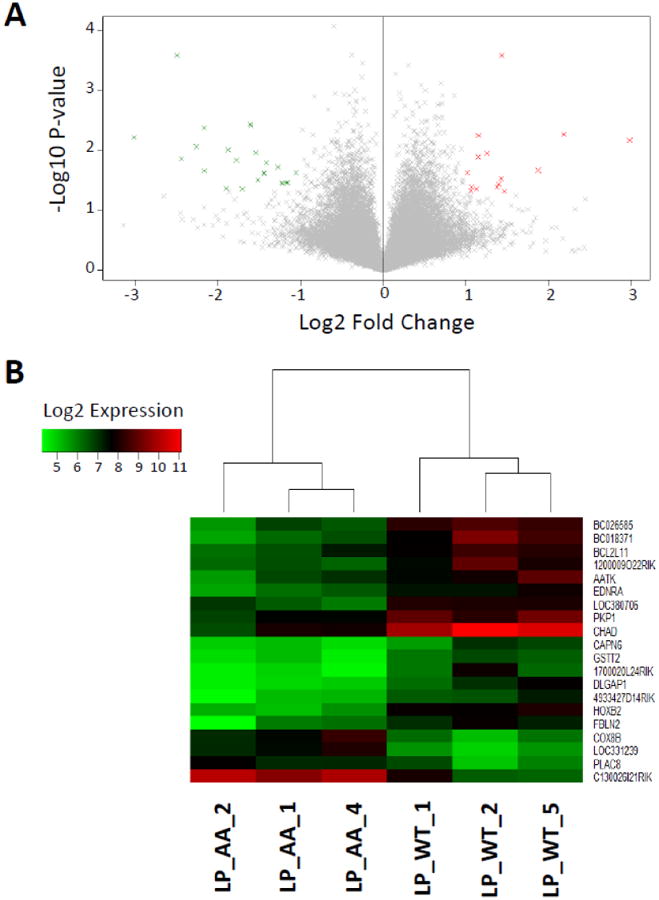
A. Volcano plot displaying the gene expression fold change and P-value for LP WT versus LP IKKAAA/AA (AA). Genes with fold-change ≥ 1 and p-value ≤ 0.05 (15 genes) are highlighted in red and fold-change ≤ -1 and p-value ≤ 0.05 (23 genes) in green. B. Heatmap of the 20 most differentially expressed genes, as measured by absolute fold-change difference. Samples are labeled according to the GSE64487 dataset.
Figure 3.
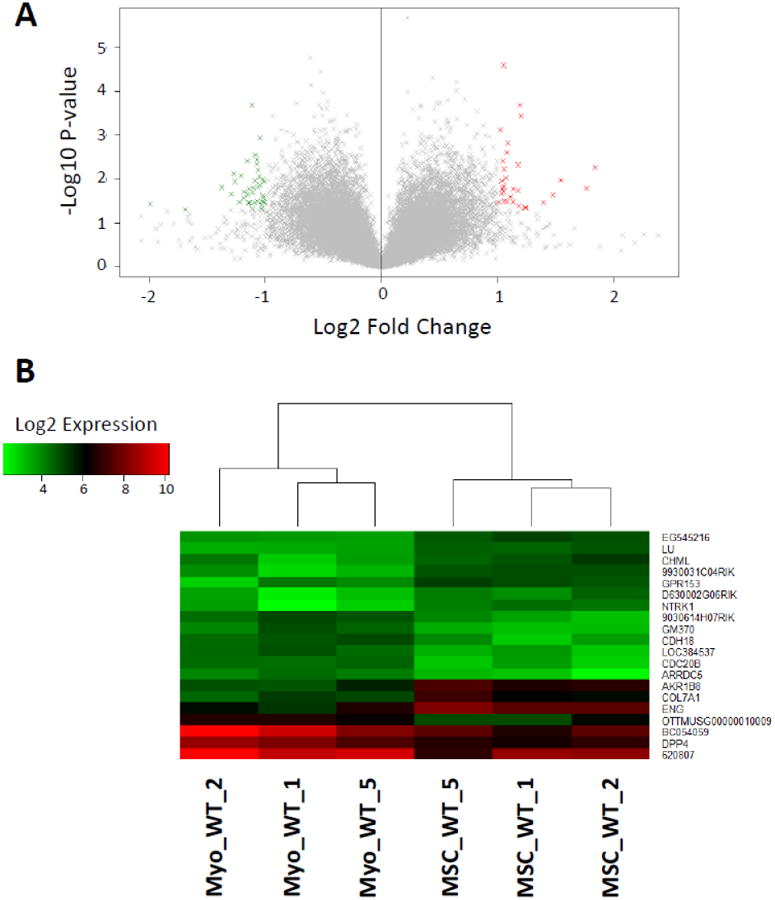
A. Volcano plot displaying the gene expression fold change and P-value for Myo WT versus MSC WT. Genes with fold-change ≥ 1 and p-value ≤ 0.05 (30 genes) are highlighted in red and fold-change ≤ -1 and p-value ≤ 0.05 (39 genes) in green. B. Heatmap of the 20 most differentially expressed genes, as measured by absolute fold-change difference. Samples are labeled according to the GSE64487 dataset.
Figure 4.
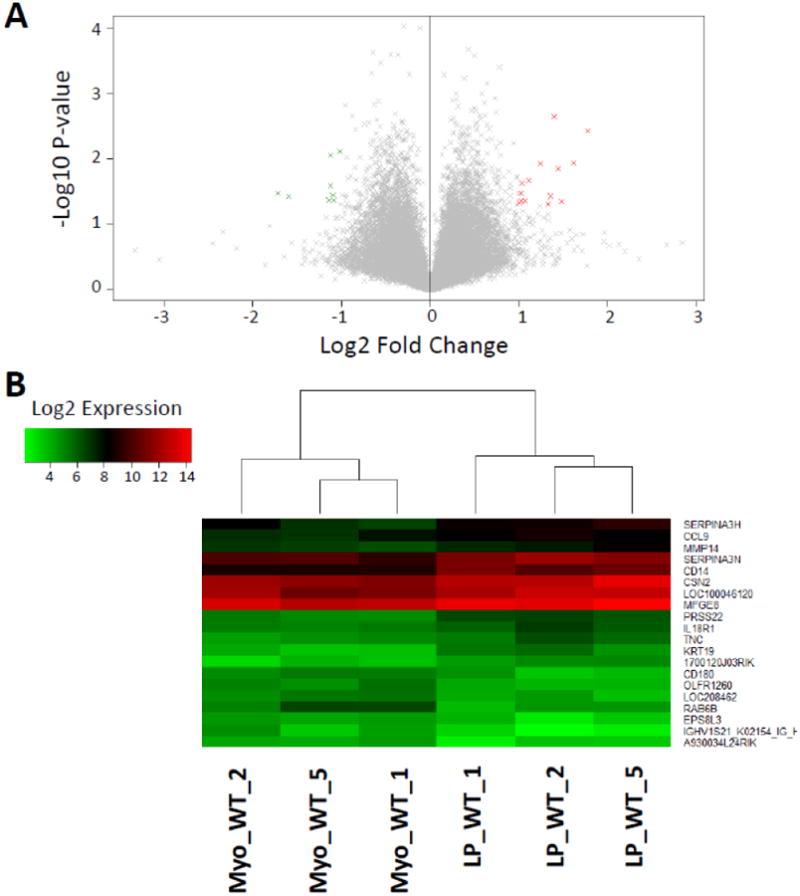
A. Volcano plot displaying the gene expression fold change and P-value for Myo WT versus LP WT. Genes with fold-change ≥ 1 and p-value ≤ 0.05 (14 genes) are highlighted in red and fold-change ≤ −1 and p-value ≤ 0.05 (8 genes) in green. B. Heatmap of the 20 most differentially expressed genes, as measured by absolute fold-change difference. Samples are labeled according to the GSE64487 dataset.
RT-PCR Validation
For each isolated RNA sample, 1 μg was reverse-transcribed with iSCript cDNA synthesis Kit (Bio-Rad, Hercules, CA). cDNA samples were diluted (1:12) in nuclease-free water before RT-PCR was performed using 96-Well Optical Reaction Plates (Applied Biosystems, Life Technologies, Carlsbad, CA) and iTaq Universal SYBER Green Supermix (Bio-Rad). A total of 15 μL of total reaction volume was used in a ViiA 7 RT-PCR system (Applied Biosystems). Relative gene expression was quantified using the 2− ΔΔCT method6, using Cyclophillin A (Ppia) (Forward 5′-CAGTGCTCAGAGCTCGAAAGT-3′ and Reverse 5′-GTGTTCTTCGACATCACGGC-3′) as a housekeeping gene. A total of 24 genes were examined based on the differential expression of LP- versus MSC-derived tumors. Results and primer sequences can be found in previously published supplemental material.4
Discussion
Herein we describe transcriptional profiling of breast tumors derived from LP, MSC and Myo cell populations in the MMTV-ErbB2 background. We believe this dataset could provide insights into the characteristics of ErbB2-driven tumors derived from basal and luminal tumor-initiating cells, as both compartments are able to generate tumors.2 As MMTV-ErbB2-driven tumors are a murine model of the aggressive HER2+ molecular subtype of breast cancer, we believe this data may assist in further elucidation of the divergence in the 2 clinically defined subclasses of HER2+ breast tumors: HER2-enriched mRNA subclass and luminal-mRNA/HER2+ subclass.7
Acknowledgments
We would like to thank Dr. Kevin Knudtson and Dr. Tom Bair of the Iowa Institute of Human Genetics for their help and insight into the microarray workflow. This work was supported by NIH grant K99/R00 CA158055 (W.Z.), NIH T32 GM007337 (N.B.), NIH T32 AI007260 (R.K.), a V Scholar award from the V Research Foundation for the Cancer (W.Z.). Additional support for this work was received from the Department Startup Grant and Seed Grant from the Department of Pathology (W.Z.). Lastly, this work benefited from funding through a Breast Cancer Research Grant and an ACS Seed Grant from Holden Comprehensive Cancer Center, University of Iowa Carver College of Medicine (W.Z.).
Footnotes
Disclosures: All authors possess no conflicts of interests.
Publisher's Disclaimer: This is a PDF file of an unedited manuscript that has been accepted for publication. As a service to our customers we are providing this early version of the manuscript. The manuscript will undergo copyediting, typesetting, and review of the resulting proof before it is published in its final citable form. Please note that during the production process errors may be discovered which could affect the content, and all legal disclaimers that apply to the journal pertain.
References
- 1.Global Cancer Facts & Figures. 2nd. American Cancer Society; American Cancer Society; Atlanta: 2011. [Google Scholar]
- 2.Zhang W, et al. A NIK-IKKalpha module expands ErbB2-induced tumor-initiating cells by stimulating nuclear export of p27/Kip1. Cancer cell. 2013;23:647–659. doi: 10.1016/j.ccr.2013.03.012. [DOI] [PMC free article] [PubMed] [Google Scholar]
- 3.Schroeder A, et al. The RIN: an RNA integrity number for assigning integrity values to RNA measurements. BMC molecular biology. 2006;7:3. doi: 10.1186/1471-2199-7-3. [DOI] [PMC free article] [PubMed] [Google Scholar]
- 4.Borcherding N, et al. Paracrine WNT5A signaling inhibits expansion of tumor-initiating cells. Cancer research. 2015 doi: 10.1158/0008-5472.CAN-14-2761. [DOI] [PMC free article] [PubMed] [Google Scholar]
- 5.Warnes GR, Bolker B, Bonebakker L, Gentleman R, Huber W, Liaw A, Lumley T, Maechler M, Magnusson A, Moeller S, Schwartz M, Venables B. gplots: Various R programming tools for plotting data. R package version. 2009;2 [Google Scholar]
- 6.Livak KJ, Schmittgen TD. Analysis of relative gene expression data using real-time quantitative PCR and the 2(-Delta Delta C(T)) Method. Methods. 2001;25:402–408. doi: 10.1006/meth.2001.1262. [DOI] [PubMed] [Google Scholar]
- 7.Cancer Genome Atlas Network. Comprehensive molecular portraits of human breast tumours. Nature. 2012;490:61–70. doi: 10.1038/nature11412. [DOI] [PMC free article] [PubMed] [Google Scholar]