

Abstract
The primate superior colliculus (SC) has long been known to be involved in saccade generation. However, SC neurons also exhibit fixation-related and smooth-pursuit-related activity. A parsimonious explanation for these seemingly disparate findings is that the SC contains a map of behaviorally relevant goal locations, rather than just a motor map for saccades and fixation. This explanation predicts that SC activity should reflect the behavioral goal, even when the behavioral response is not fixation or saccades, and even if the goal does not correspond to a visual stimulus. We tested this prediction by employing a tracking task that dissociates the stimulus and goal locations. In this task, monkeys tracked the invisible midpoint between two peripheral bars, such that the visual stimuli were peripheral but the goal was foveal/parafoveal. We recorded from SC neurons representing peripheral locations associated with the stimulus or central locations associated with the goal. Most neurons with peripheral response fields did not respond differently during tracking than during passive viewing of the stimulus under fixation; most neurons with central response fields responded more during tracking than during fixation, despite the lack of a visual stimulus. Moreover, the spatial distribution of activity during tracking was larger than that during fixation or tracking of a foveal stimulus, suggesting that the greater spatial uncertainty about the invisible goal corresponded to more widespread SC activity. These results demonstrate the flexibility with which activity across the SC represents the location - and also the spatial precision - of behaviorally relevant goals for multiple eye movements.
Keywords: Superior Colliculus, Pursuit, Voluntary Eye Movement, Stimulus-Response, Behavioral Goal, Population Coding
Introduction
Much of our understanding about the brain mechanisms for controlling where we look derives from minimalist behavioral tasks relying on simple spots of light as the potential targets. However, visual targets in natural scenes are rarely individual, point-like sources of light. Instead, they are typically larger visual objects that may or may not contain explicit features to look at (Melcher & Kowler, 1999). Despite this ambiguity in the sensory input, the motor output always directs gaze to individual spatial locations. The process of “looking” at a visual object therefore requires a mechanism for transforming the sensory representations of the object's various features into a representation of “goal” location that can directly support the spatially-precise movements accomplished by the oculomotor system.
In this paper, we show that the primate superior colliculus (SC) plays a crucial role in this transformation into goal locations. The SC is a brainstem structure that is perhaps best known for its role in generating saccades. Neurons in the SC's deep layers form a retinotopic map of saccade endpoints, such that rostral neurons represent foveal locations and more caudal neurons represent peripheral ones (Robinson, 1972; Schiller & Stryker, 1972; Wurtz & Albano, 1980). However, many of these same neurons are also modulated during smooth pursuit (Krauzlis et al., 1997,2000). Such modulation can be explained fairly simply if it is considered in relation to the instantaneous location of the pursuit target relative to the neurons' response fields: the discharge rates of SC neurons increase when the pursuit target enters their response fields and decrease otherwise (Krauzlis et al., 1997,2000). These observations suggest that the distribution of SC activity across the map may provide a real-time estimate of retinotopic target locations, and this interpretation is supported by microstimulation and inactivation experiments (Basso et al., 2000). This interpretation is also supported by studies investigating the role of the SC in representing the behavioral relevance of visual targets, regardless of the type of voluntary eye movement generated to follow these targets (Krauzlis & Dill, 2002; Carello & Krauzlis, 2004).
These previous studies of the SC have used targets specified by small visual stimuli. Here, we investigated the scenario of orienting towards an extended stimulus composed of multiple visual features. We recorded from neurons across the SC map while monkeys tracked an invisible goal whose location was inferred based on two large peripheral stimuli moving together as parts of one object. We found that SC activity was largely determined by the location of the goal, not the visual features. Such activity persisted during periods of smooth tracking in the absence of saccades, and was therefore not related to motor commands for saccades or fixation. We also found that the spatial distribution of SC activity representing the goal was broader when this goal was less spatially precise, suggesting that both spatial uncertainty and behavioral relevance influence which SC neurons are active when orienting towards the types of extended stimuli normally encountered in natural environments.
Materials and Methods
General laboratory setup
The experiments were controlled by a computer using the Tempo software package (Reflective Computing, St. Louis, MO), and a second computer running Matlab's (MathWorks, Natick, MA) Psychophysics Toolbox (Brainard, 1997; Pelli, 1997) acted as a server device for presenting the visual stimuli. Stimuli were presented with a video monitor (75 Hz, ~20 pixels/°) at a viewing distance of 41 cm. Eye movements were recorded using scleral search coils (Judge et al., 1980) and the electromagnetic induction technique (Fuchs & Robinson, 1966) using standard phase detector circuits (Riverbend Instruments, Birmingham, AL). All data and events related to the onset of stimuli were stored on disk during the experiment (1 kHz sampling rate) for further analysis.
Animal preparation
We collected data from two (J and W) adult rhesus monkeys (Macaca mulatta) that were 10-11 years of age and weighed 15-16 kg. These monkeys were prepared using standard surgical techniques that have been described in detail previously (Krauzlis, 2003), and all experimental protocols for the monkeys were approved by the Institutional Animal Care and Use Committee and complied with United States Public Health Service policy on the humane care and use of laboratory animals.
Behavioral tasks
The extrafoveal tracking and extrafoveal stimulation conditions
Our monkeys were presented with a display consisting of a small white spot over a uniform gray background. Once they fixated this spot, an experimental trial initiated.
In “extrafoveal tracking” trials, the central spot disappeared while two white bars appeared simultaneously at symmetrically opposite locations (Figure 1A). The bars were oriented perpendicular to the axis connecting their centers to the display center, and they moved sinusoidally together (as one rigid configuration) along this axis (radial amplitude: 4°, frequency: 0.71 Hz, duration: 3500 ms, starting phase: 0° or 180°). Bar separation (12°-28°) and the motion axis orientation (-73°-63° from horizontal) depended on the SC site visited (see below). Bar dimensions (in degrees of visual angle) were scaled with their separation as follows: height = (3.6/16)*separation, width = (1/28)*separation.
Figure 1.

Behavioral paradigms and recorded SC sites. (A) In the “extrafoveal tracking” task, monkeys were presented with two peripheral bars moving together sinusoidally along the axis connecting their centers to the display center. The monkeys had to infer the invisible midpoint between the two bars and track it. “Extrafoveal stimulation” trials were identical except that there was also a central, stationary fixation spot. (B) The left panel shows a mathematical model of the SC's anatomical map (Ottes et al., 1986; Quaia et al., 1998) with the approximate locations of our recorded neurons indicated. Black squares indicate neurons that were assessed during the experiment to be peripheral enough to represent the location of the contralateral bar. Gray circles indicate neurons that were assessed to be central enough to represent locations associated with the invisible midpoint. The right panel shows the initial location of the contralateral bar. For the gray neurons in the left panel, peripheral bar locations (gray circles in the right panel) were at more than twice the preferred eccentricities of these neurons. The figure indicates sites on a single SC map, but we recorded from neurons in either the right or left SC.
For extrafoveal tracking trials, the monkeys were trained to infer the invisible midpoint between the two bars and track it as well as they could. Specifically, we required that the monkeys' line of sight remain within 2°-3.5° from the true midpoint by the end of an initial grace period (J: 500 ms, W: 700 ms). This constraint on spatial accuracy was slightly more lenient than is typically used with explicit foveal pursuit stimuli, mainly because extrafoveal tracking was associated with a larger uncertainty about goal location that was reflected in the monkeys' eye positions. Spatial accuracy was not enforced during the initial grace period in order to allow the monkeys enough time to initiate their tracking. Thus, during ongoing tracking, the visual features of the tracked stimulus were in the worst possible case (which was quite rare) at least 4° away from the monkeys' gaze (range: 4°-11°).
“Extrafoveal stimulation” trials used an identical stimulus configuration for the peripheral bars, except that the central stationary spot remained on. The monkeys were required to maintain fixation on this spot and ignore the moving bars as well as their midpoint. We enforced spatial accuracy of fixation by aborting a trial whenever we detected an eye position that was more than 1° away from the central spot.
We collected 35-50 trials for each motion starting phase, giving 70-100 trials per eye movement condition per experiment.
The foveal tracking condition
For 58% (68/117) of our neurons, we also ran “foveal tracking” trials that were identical to those of extrafoveal tracking, but in which the midpoint between the two bars was explicitly shown with a low contrast small spot. The luminance of the spot was 21 cd/m2, which was lower than that of the peripheral bars (65 cd/m2 luminance) but high enough above background luminance (18 cd/m2) to be easily visible for the monkeys. We collected 35-50 trials for each motion starting phase in this condition, giving 70-100 trials per experiment.
The extrafoveal tracking blink condition
In the “extrafoveal tracking blink” condition, we transiently blinked off one of the two peripheral bars for 200 ms. The blink occurred when eye velocity was normally near its peak value (starting at t = 2013 ms from trial onset), but because the starting phase of tracking was randomized, the blinked bar could be either leading or lagging with respect to the direction of pursuit eye velocity. Pursuit performance did not show a difference between leading and lagging blinks; consequently, we pooled these conditions together and analyzed the data based on whether the removed bar was contralateral or ipsilateral with respect to the SC recording site. We collected 36 trials for each condition in this task, resulting in a total of 72 trials per experiment.
Single-neuron recordings and neuron classification
We used tungsten microelectrodes with impedances of 900kΩ-1.7MΩ to record extracellular action potentials of individual neurons in the deep layers of the SC (1.5-2.9 mm below surface). We used standard fixation and saccade tasks to identify and confirm recorded sites in the SC.
Our criterion for inclusion of neurons was that they were more active in a prelude interval before memory guided saccades to targets presented near the center of their response fields (75 ms interval starting 100 ms before saccade onset) than during an earlier fixation interval (100 ms before fixation target offset) (Krauzlis, 2001,2003,2004). Thus, the neurons that we targeted could be classified as buildup neurons described previously (Glimcher & Sparks, 1992; Munoz & Wurtz, 1995a,b; Krauzlis, 2001,2003,2004). We did not include pure “burst” neurons with no prelude activity before memory guided saccades.
A subset of our neurons (40%) - in rostral SC sites - also passed a previously described criterion for being so-called “fixation-related neurons” (Munoz & Guitton, 1991; Munoz & Wurtz, 1993a,b): they maintained >10 spikes/s while monkeys fixated during a blank interval in a fixation-blink paradigm, and they paused for 10° ipsiversive and contraversive saccades (Munoz & Wurtz, 1993a,b; Krauzlis et al., 2000; Krauzlis, 2001,2003,2004). However, we did not treat these neurons as a separate class of neurons in our analyses - primarily because our present results and those of earlier studies (Munoz & Wurtz, 1995a; Krauzlis et al., 1997,2000,2004; Basso et al., 2000) supported the conclusion that these neurons are functionally a foveal extension of other “buildup” neurons in the SC map (also see Discussion for further arguments in support of this).
We also did not subdivide our neurons based on the presence of clipped, partially clipped, or unclipped saccade-related responses (Waitzman et al., 1991), although all of these subtypes were present in our population. For example, when tested with memory guided saccades, 56% of our neurons had a “clipping” index, λ, that was less than 0.7 (Waitzman et al., 1991). However, our main results were qualitatively similar for clipped and partially-clipped neurons.
Finally, we did not further classify neurons as either possessing a visual response to stimuli inside their response fields or not because such classification also did not influence the main finding of our experiments that goal-representations - rather than stimulus-representations - dominate SC activity during extrafoveal tracking.
Response field mapping
We mapped the response field of each neuron using a delayed visually guided saccade task (Munoz & Wurtz, 1995a,b; Krauzlis, 2001,2003,2004). Response field mapping typically required 50-140 trials, with each location sampled several times. For each such sample, we computed the average firing rate of the neuron in a 75-ms interval starting 100 ms before saccade onset. We then interpolated across sampled locations to obtain continuous firing rate maps. When we observed a visual response to target onsets inside a neuron's response field, we also mapped this (sensory) response using measurements from the same saccade task. Specifically, we computed the average firing rate during a 50-ms interval starting 75 ms after stimulus onset in this saccade task. Such an interval included the time of “peak” discharge in response to stimulus onset and allowed measuring gradations in this discharge for different stimulus locations inside and around the response field. Visual and saccade-prelude response fields generally coincided spatially - and had similar widths - but we always used the saccadeprelude ones when making comparisons with our main behavioral tasks.
Recording sites relative to stimulus and goal locations
We tailored our extrafoveal tracking stimulus configuration depending on the spatial location and extent of the response field of each neuron. For neurons with preferred eccentricities larger than ~6°
we placed one bar inside the neurons' response fields (and the other bar was at a symmetrically opposite location). For neurons with more central preferred eccentricities (<5°; average: 2.2° +/- 1.4° s.d.), we placed the bars at more than twice these eccentricities (we typically chose a bar eccentricity of 11°-13°, regardless of the exact neuronal preferred eccentricity). We also placed the bars in a manner that allowed the motion axis (and, therefore, the inferred movement goal during extrafoveal tracking) to intersect these neurons' response fields.
To visualize the relationship between neuronal preferred eccentricities and peripheral bar locations (Figure 1B), we plotted each of these parameters on a mathematical model of the SC's anatomical map defined by the following equation (Ottes et al., 1986; Quaia et al., 1998):
| (equation 1) |
where R,θ are the polar coordinates of visual space (eccentricity and direction) and x,y are the anatomical SC coordinates (in millimeters). The parameters A, Bx, and By were chosen to be 3, 1.4, and 1.8, respectively (Quaia et al., 1998).
Data analysis
Eye movement analysis
Saccades were detected using velocity and acceleration thresholds (Krauzlis & Miles, 1996). During tracking, these thresholds were applied relative to the average eye velocity and acceleration in order to avoid erroneously flagging periods of smooth tracking with non-zero velocity as saccades (de Brouwer et al., 2002). All detected saccades were manually verified.
We characterized pursuit gain by fitting rectified sinusoids to the monkeys' radial eye velocities and comparing their amplitudes to the target velocity amplitude. We also fitted sinusoids to the monkeys' eye positions and compared their phase lags relative to stimulus position.
We characterized the variability in two-dimensional eye position during the extrafoveal tracking, extrafoveal stimulation, and foveal tracking conditions in order to relate it to our neuronal data. For times after the end of the grace period, we computed the average (desaccaded) horizontal and vertical eye position relative to the center of the tracked stimulus for each trial. We then computed the standard deviation of this position across trials and used this standard deviation as the measure of variability.
Exclusion of saccade-related activity
For all of our analyses of neuronal responses, we excluded any activity associated with catch-up or fixational saccades. We specifically excised all data intervals starting from 100 ms before saccade onset until 50 ms after saccade offset.
Analysis of raw neuronal responses during extrafoveal tracking and other conditions
We obtained spike densities for each trial by convolving spike times with a Gaussian of 10 ms s.d. We then obtained an average spike density per condition (for example, extrafoveal tracking) for each neuron by averaging the trial spike densities. Whenever we computed average normalized spike densities across multiple neurons, we first normalized the spike density of each neuron by its maximum in the plotted interval before averaging across neurons.
Measuring responses as a function of retinotopic stimulus or goal location
We also recalculated neuronal responses as a function of either visual feature location (one of the bars) or inferred goal location (invisible midpoint between the bars) along the tracking axis - depending on whether the neurons' response fields covered peripheral or central retinotopic locations, respectively. This analysis - performed for times in a trial after the end of the initial grace period to ensure that tracking and fixation were in steady-state - allowed us to establish whether any modulation of activity that we observed could be explained in terms of the spatial tuning of our neurons for either the stimulus or the goal location. This analysis also allowed us to compare activity in the different behavioral tasks under similar retinal conditions, which ruled out differences in sensory stimulation as the sources of differences in neuronal responses across tasks. To summarize neuronal responses across the different tasks, we computed the average firing rate of each neuron when the visual stimulus (for peripheral neurons) or the invisible midpoint (for central neurons) was within 0.5° of the retinotopic location that was expected to best drive the neuron based on its response field profile at the locations visited by the stimulus or invisible midpoint during the tasks.
To further visualize the activity observed during extrafoveal tracking, we also performed an analysis similar to the one above but taking into account the entire range of two-dimensional instantaneous retinotopic locations of the goal. This gave rise to effective “response field” maps (for the central neurons representing goal locations) that could be directly compared to the maps obtained conventionally using the delayed visually guided saccade task.
Spatial distribution of activity during sustained extrafoveal tracking and other conditions
We exploited the fact that our recorded neurons covered a continuum of preferred eccentricities (Figure 1B - left) to assess the spatial extent of SC activity during our tasks. We analyzed the responses of all of our neurons - in the extrafoveal tracking, foveal tracking, and extrafoveal stimulation conditions - as a function of neuronal preferred eccentricity (i.e. location on the SC map) for a given retinotopic goal location. Specifically, we binned neurons according to their preferred eccentricity as obtained earlier from response field mapping (bin width: 0.5°; bin spacing: 0.75°). For each eccentricity bin having at least three neurons (i.e. for each sampled location on the SC map), we computed the average firing rate when the goal was within 0.5° of the line of sight (0° retinotopic goal location). For example, if a neuron had a preferred eccentricity of 5°, we measured its response when the goal was at 0°. Thus, this analysis was equivalent to taking a “snapshot” of SC activity across the map when the goal was centered on the fovea. Although tracking generally involved more variable eye positions than fixation, by analyzing the epochs from each eye movement condition that shared the same 0° retinotopic goal location, the differences in the distribution of activity between conditions obtained with this analysis cannot be attributed to differences in orienting performance. Thus, the aim of this analysis was to avoid - as much as possible - the confound presented by the fact that the spatial accuracy and precision of eye movements varied across the different conditions depending on the certainty of the tracked or fixated goal location (see, for example, Figure 10).
Figure 10.
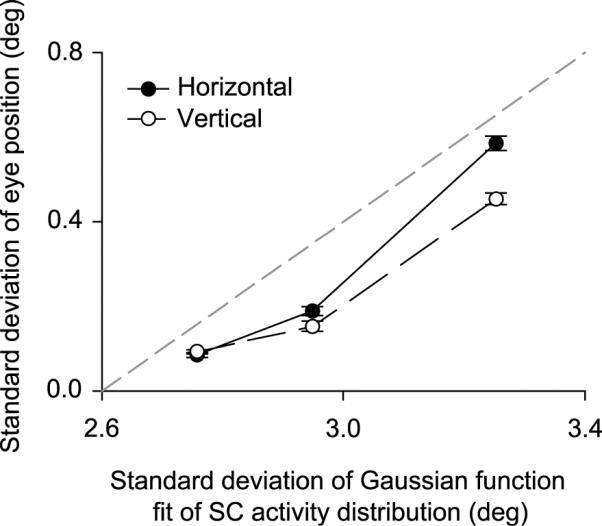
Behavioral correlate of the changes in the spatial extent of SC activity representing goal location. We computed the standard deviations of horizontal and vertical eye position relative to the tracked goal (i.e. the two-dimensional spatial precision of eye movements) and plotted them against the standard deviation of the Gaussian function fits of SC activity shown in Figure 9. When a larger population of SC neurons was recruited to represent the behavioral goal, there was also a greater variability of two-dimensional eye position around this goal. Error bars denote 95% confidence intervals (across sessions), and the dashed gray line is the line of unity slope. Each data point on the x-axis (in increasing order) corresponds to the extrafoveal stimulation, foveal tracking, and extrafoveal tracking conditions, respectively.
To quantify the spatial distribution of the activity obtained with this analysis, we fit the data with Gaussian functions having a spread parameter (standard deviation) that described the spatial extent of activity in each condition:
| eqation 2 |
where E is the neurons' preferred eccentricity, y is the average firing rate of neurons at this eccentricity, β is a scaling parameter, and σ and α describe the spatial spread and asymptote of firing rate, respectively.
We also applied this analysis to the firing rates during fixation of a stationary spot with no other peripheral visual stimuli on the display. We obtained data for this condition by measuring responses during a fixation interval at the beginning of each trial of the delayed visually guided saccade task used to map response fields. For each neuron, we computed the average firing rate in a 100-ms interval starting 50 ms before trial onset in this task, and we then binned neurons according to their preferred eccentricity as above.
To further test the goal location interpretation of SC function, we repeated the analysis above for the extrafoveal tracking, extrafoveal stimulation, and foveal tracking conditions but during times in which the midpoint between the two peripheral bars (the goal in tracking) was not aligned with line of sight. That is, we took a different “snapshot” of activity across the SC map with the goal (whether tracked or ignored) occupying either contralateral or ipsilateral retinotopic locations. In these cases, we added a center-of-mass parameter to equation 2 in order to quantify shifts in the locus of activity with shifts of goal location. We also restricted our analyses to locations along the axis of motion because these locations were the most commonly shared across the three conditions; this eliminated the confounds associated with significantly different visual inputs between conditions, which were caused by the differing effects of these conditions on the spatial accuracy and precision of the two monkeys' eye movements.
Results
Behavioral performance summary for the extrafoveal tracking task
We characterized our monkeys' extrafoveal tracking performance by computing smooth pursuit gain and phase lag for each session. Smooth pursuit gain across sessions was 0.75 +/- 0.01 s.e.m., and the average smooth pursuit phase lag was 0.3 ms +/- 0.9 ms s.e.m. Consistent with previous findings (Kettner et al., 1996), pursuit gain was better for tracking axes close to the horizontal direction and worse for ones close to the vertical direction. Catch-up saccades were more frequent when pursuit changed direction, and they had an average amplitude of 1.5° +/- 0.04° s.e.m. (across sessions). Supplementary Movie 1 illustrates a sample trial from the extrafoveal tracking task.
Summary of recording sites and stimulus configurations for extrafoveal tracking
Figure 1B summarizes the recording sites of our 117 eye-movement-related neurons (left panel) as well as the initial retinotopic locations of the peripheral bars used during extrafoveal tracking (right panel). The neurons indicated with black squares in the figure were located relatively caudally in the SC and had response fields that were eccentric enough to place one of the peripheral bars in the extrafoveal tracking stimulus near the center of these fields (compare black squares in the right and left panels). The neurons indicated with gray circles were located relatively rostrally in the SC and had response fields in the central visual field that overlapped with the inferred movement goal during extrafoveal tracking. For these neurons, we placed the peripheral bars of our stimuli at an average eccentricity of 11.1° +/- 0.1° s.e.m. - which was always more than twice the neurons' preferred eccentricity - and we confirmed that the bars did not enter the response fields of these neurons in the data presented below.
Raw responses of sample neurons with the goal inside their response fields
We found that SC neurons with central response fields (gray circles in Figure 1B) were the most significantly modulated during extrafoveal tracking. There were no visual stimuli at these neurons' preferred eccentricities. However, these neurons did represent the more central retinotopic locations associated with the inferred movement goal during tracking. Figure 2 summarizes the results obtained from two such neurons.
Figure 2.

Sample neurons having the inferred goal of extrafoveal tracking inside their response fields (RF). Each column plots the responses of one neuron during memory guided saccades (A, B), extrafoveal stimulation (C, D), and extrafoveal tracking (E, F). (A, B) The left traces of each column show eye position (black for horizontal and gray for vertical) and neuronal responses (rasters and spike density) aligned on target onset. The right traces in each column show these same variables aligned on saccade onset. These two neurons exhibited saccade-related activity for small saccades, and also exhibited fixation-related activity (data not shown). Thin dashed lines indicate s.e.m. (C, D) Each column plots eye position (top two rows) and average spike density functions in the extrafoveal stimulation condition for each neuron individually. The black and gray traces show responses for the rightward and leftward starting phases of stimulus motion, respectively. The neurons were active, but there was no strong modulation in their activity level as a function of time or stimulus phase. (E, F) Same as (C, D) but for extrafoveal tracking. The neurons were more active (on average) during extrafoveal tracking than during extrafoveal stimulation, and their activity level was clearly modulated as a function of time. Red indicates veridical goal trajectory in each phase. For all horizontal and vertical eye positions, upward deflections indicate rightward and upward, respectively. Also, the eye position scale bars in (E, F) apply for the curves of (C, D) as well.
Each of the two sample neurons was spatially tuned for a particular retinotopic location near the center of gaze. This was evidenced by significant eye-movement-related activity during memory guided saccades to locations near each neuron's preferred eccentricity - approximately 3° for the neuron on the left (Figure 2A) and approximately 4° for the neuron on the right (Figure 2B).
The tuning for central retinotopic locations of these two neurons allowed us to place the peripheral bars such that the movement goal during extrafoveal tracking could enter the neurons' response fields while the visual stimuli remained peripheral. For the neuron in Figure 2A, we placed the contralateral bar at 12°,0° (x,y); for the neuron in Figure 2B, we placed the contralateral bar at -11°,2° (x,y). Thus, for both neurons, the locations of the peripheral bars were approximately 3-4 times more eccentric than the neurons' preferred locations - and outside their response fields as mapped earlier with saccades - but the axes of motion were such that the inferred movement goal could approach the neurons' preferred locations.
The two neurons were significantly more active during extrafoveal tracking than during extrafoveal stimulation with similar peripheral visual stimuli (Figure 2C-F). The amount of modulation in these neurons' activity as a function of time was also stronger. This modulation was not a visual response, and it was also not time-locked to catch-up saccade occurrence - since we excluded any saccade-related activity from our firing rate analyses. Thus, in addition to exhibiting activity related to memory guided saccades (as well as fixation), these two sample neurons also exhibited significant modulations based on the invisible movement goal during extrafoveal tracking.
Raw responses of sample neurons with a stimulus inside their response fields
We observed very different results for neurons with more eccentric response fields. These neurons were not significantly modulated during extrafoveal tracking even though one of the peripheral bars guiding tracking was placed inside these neurons' response fields. Figure 3 illustrates this observation for two sample neurons, which were also classified as buildup neurons based on their activity during memory guided saccades (Figure 3A,B).
Figure 3.

Sample neurons having one of the peripheral bars inside their response fields (RF). This figure is organized like Figure 2. For the neuron in (A), the contralateral bar was placed at 10.5°,-2° (x,y), and for the one in (B), it was at 8°,0° (x,y). Both of these locations were inside the neurons' respective RF's, as indicated by the strong activity for saccades to similar locations. (C, D) The neuron in the left column exhibited a visual burst at trial onset (arrow and Supplementary Figure 1) followed by low-level, relatively unmodulated responses during maintained fixation. The second neuron was similar except that it had no visual response at trial onset. (E, F) The responses of each neuron during extrafoveal tracking appeared similar to its responses during extrafoveal stimulation (see Figure 4 for detailed comparison).
The activity of these neurons was not strongly modulated during either the extrafoveal stimulation or the extrafoveal tracking conditions, despite the presence of a visual stimulus inside their response fields. For the first sample neuron, the contralateral bar was placed at 10.5°,-2° (x,y), which was very close to the center of its response field (~10.2°eccentricity). During the extrafoveal stimulation condition, the neuron exhibited an initial transient response immediately after trial onset (arrow in Figure 3C; for a higher resolution view of this response, see Supplementary Figure 1), consistent with its sensory response observed during memory guided saccades (Figure 3A). However, the neuron was otherwise not highly active. During the extrafoveal tracking condition (Figure 3E), the neuron again exhibited an initial transient response immediately after trial onset, but its firing rate during sustained tracking remained well below that seen before memory guided saccades. In fact, the neuron's average level of activity during sustained extrafoveal tracking (Figure 3E) appeared very similar to its average level of activity during passive viewing of the moving bars (Figure 3C), even though the bar inside the response field was used to guide tracking in one condition but could be ignored in the other.
Qualitatively similar observations were made for the sample neuron in the right column of Figure 3 (B,D,F), with the exception that this second neuron did not exhibit a strong sensory response to stimulus onsets inside its response field (Figure 3B).
Thus, for the two sample neurons of Figure 3 - both representing the location of the peripheral visual stimulus guiding extrafoveal tracking - there was no apparent selective increase in activity when the stimulus inside their response fields was actively used to guide the behavior as opposed to when it was passively viewed.
Responses recalculated as a function of retinotopic stimulus or goal location
The pattern of results observed during sustained extrafoveal tracking suggests that neurons in our population were modulated based on the location of the inferred movement goal rather than the retinotopic stimulus. To test this idea explicitly, we plotted neuronal responses as a function of the instantaneous retinotopic location of either the peripheral visual stimulus or the inferred movement goal inside the neuron's response field. Moreover, we did so for locations that were shared across the extrafoveal tracking and extrafoveal stimulation conditions, which allowed us to establish that differences in responses across the two conditions were not due to differences in the retinotopic stimulus. This analysis thus controlled for the variability in behavior that confounds direct comparisons of raw temporal traces, such as the ones presented in Figures 2 and 3.
Figure 4A shows the results of this analysis for the two sample neurons having a visual stimulus inside their response fields (same neurons as in Figure 3). During sustained extrafoveal tracking, each neuron's activity was low, and this activity was not modulated by the retinotopic position of the bar even though this stimulus was used by the monkeys to guide the eye movement. Moreover, the activity of the two neurons was not different from their activity for similar bar locations during the passive extrafoveal stimulation condition.
Figure 4.

Spatial tuning of the sample neurons of Figures 2 and 3 for stimulus or goal location. (A) For the neurons in Figure 3, we recalculated responses during sustained extrafoveal tracking (black curves) and extrafoveal stimulation (gray curves) as a function of the retinal eccentricity of the contralateral bar along the tracking axis. Each neuron's results (left and right) demonstrate that the bar inside the RF did not recruit much more activity when it was being used to guide extrafoveal tracking than when it was passively viewed. (B) The same analysis, but for the neurons of Figure 2, and now showing responses as a function of the location of the invisible midpoint between the two bars. 0° on the x-axis indicates the vertical meridian. During extrafoveal tracking (solid black curves), each neuron increased its responses when the goal occupied retinal locations approaching the center of the contralateral RF (estimated with the dotted line from visually guided saccade data), and decreased it otherwise. During extrafoveal stimulation (gray curves), there was no apparent change in the responses of the same neurons with changes in the (ignored) midpoint location. Error bars denote s.e.m.
For the two sample neurons of Figure 2, which had more central response fields and which showed significant modulation as a function of time during extrafoveal tracking, we plotted the responses of the neurons as a function of the retinotopic goal location. This analysis, shown in Figure 4B, revealed that these neurons' activity during extrafoveal tracking increased when the inferred goal occupied certain locations in the contralateral visual field and decreased otherwise. During the extrafoveal stimulation condition, similar retinotopic locations of the invisible midpoint between the two bars did not cause similar variation in the same neurons' activity - presumably because the invisible midpoint was not a behaviorally relevant goal in this condition (when compared to the stationary fixation spot). Moreover, the preference of the two neurons for particular contralateral goal locations reflected these neurons' preference based on mapping their response fields using a delayed visually guided saccade task (compare peak locations in the solid and dotted black curves). The modulation of activity for these two neurons during extrafoveal tracking can thus be explained as a consequence of the inferred goal sweeping in and out of the neurons' response fields as the monkey was not quite perfect in following the stimulus.
This “spatial tuning” for the goal was even more evident when we included the entire range of goal locations observed during extrafoveal tracking. Specifically, due to imperfections in extrafoveal tracking, the inferred movement goal in any given session occupied a continuum of 2-D retinotopic locations near the center of gaze. Plotting the firing rate of each neuron as a function of each of these locations therefore produced a response field map for the neuron - but one that was derived from extrafoveal tracking data rather than from saccade data. Figure 5A and B (left column) show such response fields obtained for the two sample neurons of Figures 4B. As can be seen, each of these neurons had its own region of preferred retinotopic goal locations during extrafoveal tracking, and this region was similar to that predicted from the conventional response field mapping procedure using saccades - shown in Figure 5A and B (right column). Figure 5C and D show two additional neurons that further illustrate how activity across our population of central SC neurons during extrafoveal tracking comprised a real-time, distributed representation of the goal location. This point is also illustrated by Supplementary Figure 2 for the same four neurons of Figure 5.
Figure 5.

Spatial tuning for goal location that was consistent across different experimental conditions. Each row shows data from a single neuron. The left panel of each row plots responses as a function of the instantaneous retinotopic location of the inferred movement goal during extrafoveal tracking. As with other analyses, this analysis excluded activity in the vicinity of catch-up saccades. The right panel of each row plots saccade-prelude activity as a function of delayed visually guided saccade endpoints. (A) Activity of the sample neuron of Figure 2 (A,C,E) and Figure 4B (left). (B) Activity of the sample neuron of Figure 2 (B,D,F) and Figure 4B (right). (C,D) Activity of two additional neurons from our group with central response fields. As can be seen, each neuron exhibited a preference for a particular retinotopic goal location during extrafoveal tracking, and this preference was correlated with the neuron's preference during saccades.
Population summary of sustained extrafoveal tracking and extrafoveal stimulation responses
The sample neuron results from Figures 2-5 indicate that during extrafoveal tracking, SC activity was dominated by goal location representations rather than stimulus representations. We summarized these results for our entire population of recorded SC neurons by computing the average firing rate of each neuron when the stimulus or the invisible midpoint (inferred movement goal during extrafoveal tracking) was at the location that was expected to best drive the neuron based on its response field tuning profile, as measured from the delayed visually guided saccade task. The results of this analysis - designed to match the visual stimulation environment across the compared conditions and also to emphasize the idea that our neurons were spatially tuned for particular locations - are shown in Figure 6. Of the 62 neurons representing the foveal and parafoveal locations associated with the invisible midpoint between the two bars, most (41/62, 66%) were more active during extrafoveal tracking than during passive viewing when this midpoint (at a similar optimal retinotopic location, and with similar peripheral bar locations) was ignored (p<0.05, t-test). On the other hand, only 11/55 (20%) of the more peripheral neurons having a stimulus inside their response fields were more active during extrafoveal tracking than during passive viewing of the stimulus (p<0.05, t-test).
Figure 6.

Summary of population activity during sustained extrafoveal tracking and extrafoveal stimulation. Extrafoveal tracking responses are plotted against extrafoveal stimulation responses for peripheral (left) and central (right) neurons. Responses were measured when one of the bars (left) or the invisible midpoint between the two bars (right) was at the best location that drove each neuron, and these locations were matched retinally across the two eye movement conditions (i.e. comparisons of neuronal responses across conditions were made for similar locations of the peripheral visual stimuli). Most neurons with a stimulus inside their response fields (RF) did not differentiate between extrafoveal stimulation and extrafoveal tracking. On the other hand, most central neurons were more active during extrafoveal tracking - despite the absence of visual stimuli at their preferred eccentricities - than during extrafoveal stimulation. Filled symbols denote significant differences between tracking and fixation (p<0.05, t-test).
Figure 6 also highlights two additional aspects of our population responses that are noteworthy. First, the overall level of activity during extrafoveal tracking was significantly higher for the neurons with central response fields than for the more peripheral neurons having a visual stimulus inside their response fields (compare the right and left panels of the figure). Second, while they were a minority, a number of neurons with central response fields (right panel) were equally active in extrafoveal tracking and extrafoveal stimulation, instead of being more active in the former condition. Both of these observations can be explained if we take each neuron's preferred eccentricity into account when performing the analysis, as we show in Supplementary Figure 3 (also see Figure 9 for more details). Specifically, extrafoveal tracking involved foveal and parafoveal goal locations, resulting in significant activity in the SC's foveal and parafoveal sites; extrafoveal stimulation involved a foveal goal (the fixation spot), resulting in significant activity in foveal SC sites. Thus, neurons from our central group (representing foveal and parafoveal locations) were generally expected to be the most active neurons in our population, regardless of condition; in addition, out of those neurons, the ones with the smallest preferred eccentricities were generally expected to be equally active in the two conditions.
Figure 9.

Spatial distribution of SC activity during sustained extrafoveal tracking, foveal tracking, extrafoveal stimulation, and fixation. (A) In the extrafoveal tracking condition, we binned all neurons according to their preferred eccentricity and then plotted the average firing rate in each eccentricity bin when the inferred movement goal was aligned with the center of gaze. The activity was centered on the fovea and could be described with a Gaussian function fit. The map on the right of the panel shows the putative distribution of SC activity based on this Gaussian fit, if circular symmetry is assumed (red is maximal activity, blue is minimal activity). (B) Similar observations were made for the foveal tracking condition - except that the spatial extent of activity was smaller, suggesting a smaller population of active neurons in this condition (compare putative SC map to that in A). (C) Extrafoveal stimulation had an even narrow distribution of SC activity. (D) The smallest population of recruited SC neurons that we could estimate was that during fixation of a small spot with no other peripheral stimuli. The size of the activity distribution estimated in this condition was similar to that obtained earlier (see Figures 7H & 12 of Munoz & Wurtz, 1995b) with a similar behavior. (E) Summary of the standard deviation of the Gaussian function fits for all four conditions shown in A-D. This standard deviation is shown in degrees of visual angle (left y-axis) and in mm of SC coordinates according to the mathematical model of equation 1 (right y-axis).
Comparison of extrafoveal tracking responses to foveal tracking responses
We found that the goal-related activity that we observed during extrafoveal tracking was similar to the activity observed during the tracking of an explicit foveal target. For 68/117 neurons (mostly from the group of neurons preferring foveal and parafoveal locations), the monkeys tracked an identical stimulus to extrafoveal tracking, except that we also displayed the midpoint between the two peripheral bars as a small spot. Figure 7 shows sample raw responses during foveal and extrafoveal tracking from the same sample neuron of the right column of Figure 2 (B,D,F). Two main observations can be made from this figure. First, note that the variance in tracking, evidenced by the dispersion of the individual trial eye position traces, was lower in the foveal tracking condition (B) than in the extrafoveal tracking condition (A). This might be expected, since the movement goal in the foveal tracking condition was small and visible as opposed to being completely invisible (also see Figure 10). Second, both the average level of activity and its modulation as a function of time were somewhat lower during the foveal tracking condition than during the extrafoveal tracking condition. These effects were also evident when the responses of the same neuron were recalculated as a function of the retinotopic location of the tracked goal (Figure 7C): the neuron had a lower overall level of activity during foveal tracking than during extrafoveal tracking, but it nonetheless continued to exhibit similar dependence on the retinotopic goal location. This dependence was also consistent with the profile of the neuron's response field obtained during visually guided saccades (dotted black curve).
Figure 7.

Similarities and differences between extrafoveal tracking and foveal tracking. (A) Sample eye position traces and neuronal responses during extrafoveal tracking from the same neuron of Figure 2 (B,D,F). Neuronal responses are now shown as average spike densities (with s.e.m. envelopes) and as raw spike rasters. (B) Responses of the same neuron when the midpoint between the two bars was shown explicitly with a small spot. The neuron was still modulated, but to a lesser extent. (C) These observations were also made when we measured responses as a function of retinotopic goal location along the tracking axis. In both conditions, the neuron exhibited similar preference for goal location, regardless of whether the goal was visible or not. The curve for foveal tracking has fewer sampled positions on the x-axis because of the higher spatial precision of tracking in this condition. The red curves in (A,B) indicate veridical goal location, and the dotted black curve in (C) indicates our estimate of the response field (RF) profile of the neuron at the displayed locations.
We found similar results for all neurons tested with the foveal tracking condition. We summarized these results by repeating the same analysis shown in Figure 6, but now comparing foveal tracking to extrafoveal tracking. For the same retinotopic goal locations, the neurons' responses during extrafoveal tracking and during foveal tracking were highly correlated (correlation coefficient: 0.86; p<0.01). However, foveal tracking generally recruited slightly lower activity than extrafoveal tracking. Across neurons, the slope of the linear regression function relating firing rates during foveal tracking to firing rates during extrafoveal tracking was 0.85 (which was significantly smaller than 1; p<0.05). Our analysis of the spatial spread of SC activity in the two conditions - described in the next section - provides a possible explanation for this difference in activity level.
Thus, our results from both the extrafoveal and foveal tracking conditions are consistent with the hypothesis that SC neurons represent the location of a behaviorally relevant goal, whether or not it is represented by a visual stimulus.
Spatial distribution of activity during extrafoveal tracking and other behaviors
During the extrafoveal tracking task, because many SC neurons exhibited sensory responses to stimuli appearing inside their response fields (for example, Figure 3A,C,E), the spatial locus of activity across the SC map initially represented the peripheral bars before transforming to signal the inferred goal location. This observation is documented in Figure 8, which summarizes the activity of either the peripheral or central neurons in our population during the first 200 ms of extrafoveal tracking trials - and excluding any activity for which the first catch-up saccade occurred with a latency shorter than 300 ms. The figure shows that shortly after bar onset, neurons with one of the peripheral bars inside their response fields had a burst of activity starting on average approximately 50 ms after stimulus onset. More central neurons with no visual stimuli inside their response fields exhibited a modest reduction in their activity during a similar time frame. This distribution of activity was short-lived, because by the time of the first catch-up saccade (histogram at the bottom of the figure), activity in the SC was predominated by the central neurons representing the inferred movement goal. When extrafoveal tracking was in steady-state, and after any initial catch-up saccades had ended, the peripheral neurons lowered their activity even further, while the central neurons remained more active (data point for t > 500 ms).
Figure 8.
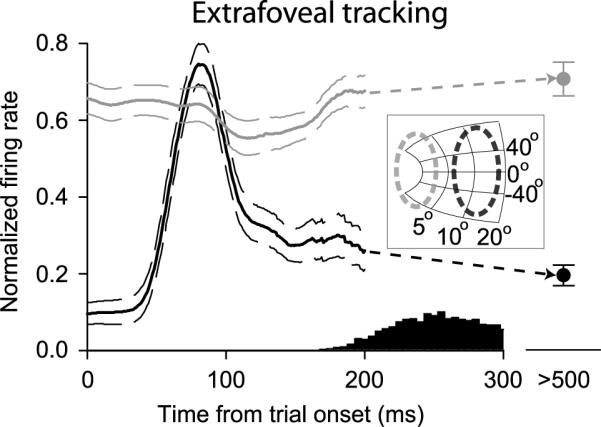
Spatial locus of SC activity immediately after trial onset in the extrafoveal tracking condition. We plotted average spike density functions for the first 200 ms of extrafoveal tracking trials - i.e. before tracking had started. Neurons with peripheral response fields and having one of the bars inside these fields often exhibited a transient burst of activity after bar onset (black curves). Neurons with more central response fields had relatively high levels of activity at trial onset - during maintained fixation of a small spot - and these neurons exhibited a transient reduction in their activity shortly after bar onset (gray curves). The histogram on the bottom shows first saccade latencies (to initiate tracking), and the data point labeled “> 500”, shows the average activity during sustained extrafoveal tracking (after any initiation saccades had completed). The inset shows the approximate recorded locations on the SC map of the two groups of neurons described in this figure. Thin curves and error bars denote s.e.m.
We further documented the spatial distribution of SC activity when extrafoveal tracking was sustained and in steady-state. We did this by computing the responses of all of our neurons when the goal was at a 0° retinotopic location. Plotting these responses as a function of the neurons' preferred eccentricities (obtained earlier during response field mapping with saccades) is equivalent to displaying a “snapshot” of the spatial distribution of SC activity across the map when the goal was aligned with the line of sight. This analysis exploited the fact that the chosen retinotopic goal location along the tracking axis was common for all neurons - regardless of preferred eccentricity. The analysis was therefore not significantly influenced by any variations in tracking performance across sessions. This analysis also exploited our earlier observations that SC activity during sustained extrafoveal tracking was relatively insensitive to stimulus location (Figures 2-6), which allowed us to lump all neurons into one group regardless of bar location.
The results of this analysis are shown in Figure 9A, which indicates that when the inferred movement goal during extrafoveal tracking was aligned with the line of sight, SC activity was centered on the fovea. This activity fell-off for more eccentric neurons representing locations further from the (foveal) goal, as might be expected. For example, a neuron preferring a 5° eccentricity was less active than a more central neuron with a response field closer to the 0° goal location. However, this fall-off of activity with eccentricity had a relatively shallow slope - indicating a fairly wide distribution of SC activity in this condition. We quantified the width of this distribution by obtaining a Gaussian function fit for the data (equation 2), and we found that the standard deviation of this fit - a measure of the spatial distribution - was ~3.25°. This value translates into ~1.03 mm from the rostral pole of the SC (equation 1; with θ set to 0°).
We found that the width of the distribution of SC activity was modulated by the behavioral context. Specifically, the spatial extent of SC activity was consistently smaller in conditions that involved a small visual stimulus as the behavioral goal than in the extrafoveal tracking condition that involved an invisible goal. We documented this observation using data from each of our other behavioral conditions. During foveal tracking, when the monkeys tracked a small spot placed at the midpoint between the two peripheral bars, the bulk of SC activity was again centered on the fovea as during extrafoveal tracking. However, this activity was more restricted spatially, even though the analysis was done for a similar retinotopic goal location (0° as in the extrafoveal tracking analysis): the Gaussian function fit to this data had a standard deviation of ~2.9° (Figure 9B). During extrafoveal stimulation, when the monkeys fixated a small spot during presentation of the two peripheral bars, the spatial extent of SC activity was again smaller than that during extrafoveal tracking (Figure 9C; s.d. of fitted Gaussian: ~2.76°).
We also estimated the spatial distribution of SC activity during visual fixation, when the monkeys fixated a small central spot with no other visual stimuli present in the display. We observed the narrowest profile of SC activity in this condition (Figure 9D), obtaining a Gaussian function fit with a standard deviation of only ~2.33°. Expressed in SC anatomical coordinates as in (Munoz & Wurtz, 1995b), this value translates into ~0.81 mm from the rostral pole of the SC, which is similar to earlier estimates with a similar behavioral task (see in particular Figure 7H and Figure 12 of Munoz & Wurtz, 1995b). Therefore, the analyses of Figures 9A-D show a progressive reduction in the spatial distribution of SC activity across these four conditions (extrafoveal tracking, foveal tracking, extrafoveal stimulation, and fixation of a small spot), even though in each of these cases, the analyses were restricted to epochs in which the goal was at the same 0° retinotopic location (Figure 9E).
Figure 12.

Activity of SC neurons during the extrafoveal tracking blink condition. (A) For 9 neurons with peripheral preferred eccentricities, we recorded activity while one of the bars was transiently blanked for 200 ms (top schematic). The bar that was blanked was either the one inside the neuron's response field (contra blink - dashed oval in schematic) or the one outside it (ipsi blink). The top row of data shows the average normalized eye velocity traces for the 9 neurons in the baseline extrafoveal tracking condition (gray) and in the blink condition (black). Each trace is the average for one neuron, with normalization done based on the gray curves. Eye velocity was reduced by bar blanking, but it did so similarly regardless of which bar was removed (compare contra and ipsi blink plots). The second row of data plots the average normalized spike density curves across neurons (with s.e.m. envelopes) when the contra and ipsi bars were blanked (black curves). The gray curves show the average responses of the same neurons when no bars were blanked. When the contra bar was blanked, a visual burst occurred shortly after the bar reappeared (arrow). (B) The same analyses were made for 10 neurons representing the invisible goal location. These neurons maintained their activity during the blank interval, regardless of which bar was removed (compare black and gray neuronal responses; arrow during blink). When the contra bar was removed, the neurons also exhibited a short-lived reduction after the peripheral bar reappeared (arrow after blink). RF stands for “response field”.
The size of the active population of SC neurons estimated above was directly related to the precision of the animals' eye movements across the different behavioral tasks. To illustrate this, we compared the observed two-dimensional variability of the monkeys' eye positions during the different behavioral tasks (qualitatively described in Figure 7) to the spatial distribution of activity in the SC. We computed the standard deviation of horizontal and vertical goal-centered eye position (during steady-state tracking or fixation) for each session of each condition, and we found that extrafoveal tracking always exhibited the largest variability in two-dimensional eye position (horizontal and vertical s.d.: 0.59°, 0.45°), followed by foveal tracking (horizontal and vertical s.d.: 0.19°, 0.15°) and then extrafoveal stimulation (horizontal and vertical s.d.: 0.09°, 0.09°; p<0.01; One-way ANOVA for horizontal or vertical dimension across sessions). When we plotted these values from the eye position data as a function of the standard deviations of the Gaussian functions fit to the spatial distribution of active SC neurons obtained above (Figure 9), we found a consistent relationship (Figure 10): as the width of the SC activity profile increased by ~0.5° across the three conditions, the variability in eye position around the behavioral goal increased by 0.4°-0.5°. Thus, a narrower profile of SC activity representing the behavioral goal was associated with more spatially precise eye positions around this goal, and vice versa. Again, these differences in the spatial profiles of activity are not due to differences between the tracking errors in the tasks, because the analysis matched the goal locations across experimental conditions.
These results therefore imply that the SC contains a representation of behaviorally relevant goal locations, and that the spatial extent of this representation in the anatomical map is related to the observed eye movement variability. If the SC does indeed represent the instantaneous retinotopic location of a goal, then the locus of SC activity as described above should also shift with shifts of goal location. Our analysis of the spatial spread of activity (Figure 9) allowed us to look for evidence of such shifts - essentially by taking additional “snapshots” of the activity distribution when the goal was not at 0°. Specifically, when we binned the responses of our neurons during the extrafoveal tracking condition according to their preferred eccentricities, we found that the resulting distribution shifted contralaterally when the eye was offset from its goal on the ipsilateral side and ispilaterally when the eye was offset from its goal on the contralateral side during sustained tracking. Figure 11A illustrates this for the cases in which the intended goal was within 0.5° of the following retinotopic locations along the tracking axis: -1.5° and +1.5° (with positive meaning contralateral). Such shifting was not evident for similar locations of the invisible midpoint between the two bars (and of the bars themselves) in the extrafoveal stimulation condition (Figure 11B) - because the behavioral goal in this case was the (retinotopically) stationary fixation spot. During the foveal tracking condition, when the small spot could occupy different retinotopic locations as the monkey was actively trying to track it, we again saw evidence of shifts of the locus of SC activity with shifts of the goal location (Figure 11C).
Figure 11.

Assessing shifts in the population of active neurons during extrafoveal tracking, extrafoveal stimulation, and foveal tracking with shifts in the retinotopic location of the midpoint between the two bars. (A) We performed an analysis similar to that of Figure 9 but for different retinotopic goal locations during extrafoveal tracking. We plotted the activity of our neurons when the goal was at a 1.5° eccentricity relative to gaze on either the contralateral (gray) or ipsilateral side (black) - along the axis of motion. Our neurons changed their activity with goal location (see Figures 2 and 5 for samples illustrating this) in a manner that was consistent with the entire center of mass of the active population shifting to reflect this goal location. (B) The same analysis on the same set of neurons revealed much smaller changes in neuronal activity during the extrafoveal stimulation condition when the monkeys could ignore the (invisible) midpoint. (C) During foveal tracking, we again observed shifts in the center of mass of the active population as the goal (now visible) shifted retinotopically. The smaller range of tracking errors in this condition meant that to have enough data to perform this analysis, we could only test for shifts associated with 1.25° goal locations as opposed to 1.5°.
Independence of extrafoveal tracking responses from visual stimulus presence
Finally, to show that the goal-related activity that we observed during extrafoveal tracking did not depend on the presence of a visual stimulus anywhere in the visual field, we also recorded SC activity during an “extrafoveal tracking blink” condition from one of our monkeys (Figure 12 - top schematics). In this condition, we transiently blinked off either the bar leading tracking or the one lagging it. Ten of the neurons recorded in this condition had central response fields with no visual stimuli inside these response fields. Nine of them had peripheral response fields and had one of the peripheral bars - but not the movement goal - inside the response fields.
Figure 12A shows average eye velocity traces and average neuronal responses in this condition for the 9 neurons having a visual stimulus inside their response fields. The left column of eye velocity traces and neuronal responses illustrates the behavioral and neuronal effects of blanking the bar on the contralateral side of retinotopic space (i.e. the bar inside the neurons' response fields). As can be seen, transient blanking of the bar inside the response field of a neuron caused a transient increase in response shortly after bar reappearance. This transient increase is similar to that observed at trial onset for our peripheral neurons (Figure 8), and it further supports the conclusion that the low level of activity that we saw during sustained extrafoveal tracking for these neurons (gray curves and Figure 6 - left) was not always because the neurons lacked sensory responses. Instead, these sensory responses remained latent during ongoing extrafoveal tracking because the inferred goal location dominated SC activity and was outside these neurons' response fields. Transient blanking of a bar on the opposite side of a neuron's response field did not influence the already low neuronal activity (right column in A).
Complementary results were obtained for the neurons shown in Figure 12B representing the invisible goal location. These neurons maintained their activity - relative to the regular extrafoveal tracking condition - during the transient blanking of one of the bars. Moreover, when the contralateral bar (left column neuronal responses) reappeared after being blanked, the neurons often exhibited a transient reduction in activity that was similar to that observed earlier at trial onset in the extrafoveal tracking condition (Figure 8).
These results indicate that during sustained extrafoveal tracking, SC activity maintains a representation of the tracked movement goal and not the visual stimuli, and that this representation is transiently perturbed by the abrupt onset of visual stimuli.
Discussion
In this paper, we showed that activity in the SC reflects the location of the behavioral goal rather than the visual stimulus defining this goal. We designed a task in which visual stimuli were only presented in the periphery. We found that SC activity initially reflected the location of these stimuli before quickly transforming to represent the location of the inferred movement goal. We also found that the spatial extent of SC activity in this task was consistently larger than in tasks in which the goal was specified by a small visible spot. These results suggest that the distribution of SC activity depends not only on the location of the behaviorally relevant goal, but also on the spatial precision with which the goal can be defined.
The goal location hypothesis
Our results suggest that low-frequency SC activity serves the function of representing the relative behavioral relevance of a particular retinotopic location. The invisible midpoint between the two peripheral bars in extrafoveal tracking was the most behaviorally relevant location, and it is this location that was represented.
Such an interpretation is consistent with the known malleability of low-frequency SC activity under different behavioral conditions. For example, such activity increases with increasing probability that a location will be the target of a saccade (Basso & Wurtz, 1997,1998; Dorris & Munoz, 1998), and it also reflects (Kustov & Robinson, 1996; Ignashchenkova et al., 2004) - and possibly influences (Cavanaugh & Wurtz, 2004; Müller et al., 2005) - the locus of visuo-spatial attention. These observations, together with our current results, place the SC at an intermediate functional level that is downstream of pure sensory representations but upstream of strict motor control - consistent with the goal location hypothesis.
However, the buildup of SC activity before saccades might raise the concern that this activity is strictly saccade-preparatory (Munoz & Wurtz, 1995a; Dorris & Munoz, 1998), and that it exists during smooth tracking because of the potential for catch-up saccades. We noticed that our tracking-related activity persisted even when there were no saccades for extended intervals of up to one second - rendering an interpretation of such activity as purely saccade-preparatory less plausible. Also, causal manipulations of the SC influence smooth pursuit initiation, suggesting that pre-motor SC activity is not restricted to saccades (Basso et al., 2000). The “goal location” interpretation of our results allows another prediction: reversible inactivation of portions of the SC during extrafoveal tracking should result in a biased estimate of goal location that can be dissociated from inactivation-induced changes in catch-up saccades. In a related study, we validate this prediction (Hafed et al., 2008).
Relationship to gaze error models of the SC
The SC is often described as providing an error signal for saccadic gaze shifts (for example, Bergeron et al., 2003). According to this view, the locus of activity on the SC map encodes the distance between the eye and target, and a rostral zone of the SC - representing “zero error” - issues commands to maintain fixation (Munoz & Guitton, 1991; Munoz & Wurtz, 1993a,b). However, the modulations in firing rate that we observed in our experiments occurred during saccade-free epochs of smooth tracking. Consistent with previous findings (Krauzlis et al., 1997,2000), our data therefore show that SC activity is not only associated with the motor control of saccades. Moreover, because the tracking-related activity in our tasks was in the rostral SC - representing central locations - our results do not support the concept of a “fixation zone”. Besides exhibiting saccade-related and smooth-pursuit-related activity (Figures 2, 4, and 5; Supplementary Figure 4; Munoz & Wurtz, 1993a; Krauzlis et al., 2000), our rostral neurons were tuned for particular retinotopic regions (Figure 5 and Krauzlis et al., 2000), suggesting a continuous topographic representation even inside this so-called “zone”.
A related principle of current gaze error models of the SC is that neurons in the “fixation zone” also encode gaze error in their absolute firing rates (Bergeron & Guitton, 2000; Choi & Guitton, 2006). That is, these neurons pause at saccade onset, and gradually increase their discharge as the gaze error decreases during the movement. Again, this view cannot explain our results, because it suggests an inverse relationship between gaze error and the firing rate of rostral neurons: when gaze error increases, firing rate should decrease - ultimately pausing for large errors. This is the exact opposite of what we found: our rostral neurons very often increased their activity when the goal was slightly off-center (i.e. when gaze error was non-zero). In addition, proposing that rostral SC neurons encode gaze error in this manner is at odds with the fact that the entire SC contains a topographic representation of space. This representation would be rendered redundant if information about the retinal eccentricity of targets were encoded by the activity level of rostral neurons. Instead, our results suggest that the changes in these neurons' activity with gaze error (or equivalently, with goal location) simply occur because of shifts in the entire distribution of active neurons (Figure 11). In other words, the firing rate modulations of rostral SC neurons with gaze error are a manifestation of the spatial tuning characteristics of these neurons (Figure 5).
Gaze error models of the SC also rely on anatomical evidence supporting the concept of a “fixation zone”. Large portions of the SC project to the brainstem omnipause neurons (OPN's) that help prevent saccades from occurring, and the strongest of these projections originate from the rostral SC (Gandhi & Keller, 1997; Büttner-Ennever et al., 1999; Takahashi et al., 2005). However, anatomical projections alone do not elucidate function. If this were true, then “saccade-related” neurons in the caudal SC that also project to OPN's (Gandhi & Keller, 1997) might also be designated as so-called “fixation neurons”. We believe that the goal location hypothesis provides an alternative explanation for how the SC supports fixation. Specifically, OPN's may use the projections that they receive from the SC in order to detect imbalances in SC activity, not whether or not the rostral SC is active. When the center-of-mass of SC activity is sufficiently biased (which would happen when there is a peripheral movement goal), OPN's would shut down and trigger a saccade. With such a model, strong projections from the rostral SC to OPN's are expected because the rostral SC represents foveal goals that are often stationary and require fixation. However, projections from other portions of the SC are also expected, because these inputs would promote stability of fixation in the presence of noisy inputs.
Finally, with their focus on the role of the SC in forming motor commands, gaze error models are not helpful for understanding recent evidence that the SC also contributes to non-motor processes, such as the control of visual attention (Cavanaugh & Wurtz, 2004; Müller et al., 2005). In contrast, the goal location interpretation encompasses both motor and non-motor functional scopes of the SC.
Spatial distribution of activity representing goals in the SC
The observation of a larger population of active neurons during extrafoveal tracking than during other tasks has implications for our understanding of the functional organization of SC neurons. Specifically, our results suggest that the contribution of a particular neuron to representing a given goal varies depending on the size of the active population needed to represent its location. For example, we found neurons with preferred eccentricities of ~5° that supported smooth tracking when the foveal goal was invisible, but that were significantly less modulated when the goal was a small, visible target at the same foveal location.
Our analysis of the spatial profile of SC activity across multiple tasks also allows comparisons to similar analyses performed earlier for saccades and fixation (Munoz & Wurtz, 1995b). We found a spatial spread during fixation of a single stationary spot that was similar to that reported earlier for a similar behavior (Munoz & Wurtz, 1995b). However, we also found that tracking of a small spot recruited a slightly larger population than fixation. This could be due to the fact that the motion of the goal in tracking increases its effective spatial uncertainty at any one time. Consistent with this interpretation, we found that the standard deviation of eye position was consistently larger during tracking of a small spot than during fixation of a similarly sized stationary spot.
Location versus motion information in extrafoveal tracking
Finally, our results complement those found with a qualitatively similar behavioral paradigm in area MST (Ilg & Thier, 2003). MST neurons respond during pursuit even in the absence of a foveal stimulus, suggesting that these neurons contribute to the maintenance of eye velocity through receiving extraretinal information about the ongoing movement. However, the ability to perform extrafoveal tracking (Wyatt et al., 1994; Ilg & Thier, 1999) also involves a certain amount of spatial precision during such tracking - in addition to a mechanism for velocity maintenance. By representing the location of the inferred movement goal rather than the visual stimuli, SC neurons may contribute to such precision.
Supplementary Material
Acknowledgements
Z.M.H. was funded by the Natural Sciences and Engineering Research Council (Canada), the Sloan-Swartz Center for Theoretical Neurobiology, and National Institutes of Health (Grant EY12212). R.J.K. was funded by the National Institutes of Health (Grant EY12212). The authors are grateful for feedback from L. Goffart and C. Wehrhahn, as well as for the help of Natalie Dill in the experiments.
Footnotes
Supplemental Material: 1 movie, 4 figures, 1 html containing movie and figure legends
References
- Basso MA, Krauzlis RJ, Wurtz RH. Activation and inactivation of rostral superior colliculus neurons during smooth-pursuit eye movements in monkeys. J Neurophysiol. 2000;84:892–908. doi: 10.1152/jn.2000.84.2.892. [DOI] [PubMed] [Google Scholar]
- Basso MA, Wurtz RH. Modulation of neuronal activity by target uncertainty. Nature. 1997;389:66–69. doi: 10.1038/37975. [DOI] [PubMed] [Google Scholar]
- Basso MA, Wurtz RH. Modulation of neuronal activity in superior colliculus by changes in target probability. J Neurosci. 1998;18:7519–7534. doi: 10.1523/JNEUROSCI.18-18-07519.1998. [DOI] [PMC free article] [PubMed] [Google Scholar]
- Bergeron A, Guitton D. Fixation neurons in the superior colliculus encode distance between current and desired gaze positions. Nat Neurosci. 2000;3:932–939. doi: 10.1038/78847. [DOI] [PubMed] [Google Scholar]
- Bergeron A, Matsuo S, Guitton D. Superior colliculus encodes distance to target, not saccade amplitude, in multi-step gaze shifts. Nat Neurosci. 2003;6:404–413. doi: 10.1038/nn1027. [DOI] [PubMed] [Google Scholar]
- Brainard DH. The psychophysics toolbox. Spat. Vis. 1997;10:433–436. [PubMed] [Google Scholar]
- Büttner-Ennever JA, Horn AK, Henn V, Cohen B. Projections from the superior colliculus motor map to omnipause neurons in monkey. J Comp Neurol. 1999;413:55–67. doi: 10.1002/(sici)1096-9861(19991011)413:1<55::aid-cne3>3.0.co;2-k. [DOI] [PubMed] [Google Scholar]
- Carello CD, Krauzlis RJ. Manipulating intent: evidence for a causal role of the superior colliculus in target selection. Neuron. 2004;43:575–583. doi: 10.1016/j.neuron.2004.07.026. [DOI] [PubMed] [Google Scholar]
- Cavanaugh J, Wurtz RH. Subcortical modulation of attention counters change blindness. J Neurosci. 2004;24:11236–11243. doi: 10.1523/JNEUROSCI.3724-04.2004. [DOI] [PMC free article] [PubMed] [Google Scholar]
- Choi WY, Guitton D. Responses of collicular fixation neurons to gaze shift perturbations in head-unrestrained monkey reveal gaze feedback control. Neuron. 2006;50:491–505. doi: 10.1016/j.neuron.2006.03.032. [DOI] [PubMed] [Google Scholar]
- de Brouwer S, Missal M, Barnes G, Lefèvre P. Quantitative analysis of catch-up saccades during sustained pursuit. J Neurophysiol. 2002;87:1772–1780. doi: 10.1152/jn.00621.2001. [DOI] [PubMed] [Google Scholar]
- Dorris MC, Munoz DP. Saccadic probability influences motor preparation signals and time to saccadic initiation. J Neurosci. 1998;18:7015–7026. doi: 10.1523/JNEUROSCI.18-17-07015.1998. [DOI] [PMC free article] [PubMed] [Google Scholar]
- Fuchs AF, Robinson DA. A method for measuring horizontal and vertical eye movement chronically in the monkey. J Appl Physiol. 1966;21:1068–1070. doi: 10.1152/jappl.1966.21.3.1068. [DOI] [PubMed] [Google Scholar]
- Gandhi NJ, Keller EL. Spatial distribution and discharge characteristics of superior colliculus neurons antidromically activated from the omnipause region in monkey. J Neurophysiol. 1997;78:2221–2225. doi: 10.1152/jn.1997.78.4.2221. [DOI] [PubMed] [Google Scholar]
- Glimcher PW, Sparks DL. Movement selection in advance of action in the superior colliculus. Nature. 1992;355:542–545. doi: 10.1038/355542a0. [DOI] [PubMed] [Google Scholar]
- Hafed ZM, Goffart L, Krauzlis RJ. Superior colliculus inactivation causes stable offsets in eye position during tracking. J Neurosci. 2008;28:8124–8137. doi: 10.1523/JNEUROSCI.1317-08.2008. [DOI] [PMC free article] [PubMed] [Google Scholar]
- Ignashchenkova A, Dicke PW, Haarmeier T, Thier P. Neuron-specific contribution of the superior colliculus to overt and covert shifts of attention. Nat Neurosci. 2004;7:56–64. doi: 10.1038/nn1169. [DOI] [PubMed] [Google Scholar]
- Ilg UJ, Thier P. Eye movements of rhesus monkeys directed towards imaginary targets. Vision Res. 1999;39:2143–2150. doi: 10.1016/s0042-6989(98)00321-6. [DOI] [PubMed] [Google Scholar]
- Ilg UJ, Thier P. Visual tracking neurons in primate area MST are activated by smooth-pursuit eye movements of an “imaginary” target. J Neurophysiol. 2003;90:1489–1502. doi: 10.1152/jn.00272.2003. [DOI] [PubMed] [Google Scholar]
- Judge SJ, Richmond BJ, Chu FC. Implantation of magnetic search coils for measurement of eye position: an improved method. Vision Res. 1980;20:535–538. doi: 10.1016/0042-6989(80)90128-5. [DOI] [PubMed] [Google Scholar]
- Kettner RE, Leung HC, Peterson BW. Predictive smooth pursuit of complex two-dimensional trajectories in monkey: component interactions. Exp Brain Res. 1996;108:221–235. doi: 10.1007/BF00228096. [DOI] [PubMed] [Google Scholar]
- Krauzlis RJ. Extraretinal inputs to neurons in the rostral superior colliculus of the monkey during smooth-pursuit eye movements. J Neurophysiol. 2001;86:2629–2633. doi: 10.1152/jn.2001.86.5.2629. [DOI] [PubMed] [Google Scholar]
- Krauzlis RJ. Neuronal activity in the rostral superior colliculus related to the initiation of pursuit and saccadic eye movements. J Neurosci. 2003;23:4333–4344. doi: 10.1523/JNEUROSCI.23-10-04333.2003. [DOI] [PMC free article] [PubMed] [Google Scholar]
- Krauzlis RJ. Activity of rostral superior colliculus neurons during passive and active viewing of motion. J Neurophysiol. 2004;92:949–958. doi: 10.1152/jn.00830.2003. [DOI] [PubMed] [Google Scholar]
- Krauzlis RJ, Basso MA, Wurtz RH. Shared motor error for multiple eye movements. Science. 1997;276:1693–1695. doi: 10.1126/science.276.5319.1693. [DOI] [PubMed] [Google Scholar]
- Krauzlis RJ, Basso MA, Wurtz RH. Discharge properties of neurons in the rostral superior colliculus of the monkey during smooth-pursuit eye movements. J Neurophysiol. 2000;84:876–891. doi: 10.1152/jn.2000.84.2.876. [DOI] [PubMed] [Google Scholar]
- Krauzlis RJ, Dill N. Neural correlates of target choice for pursuit and saccades in the primate superior colliculus. Neuron. 2002;35:355–363. doi: 10.1016/s0896-6273(02)00756-0. [DOI] [PubMed] [Google Scholar]
- Krauzlis RJ, Liston D, Carello CD. Target selection and the superior colliculus: goals, choices and hypotheses. Vision Res. 2004;44:1445–1451. doi: 10.1016/j.visres.2004.01.005. [DOI] [PubMed] [Google Scholar]
- Krauzlis RJ, Miles FA. Release of fixation for pursuit and saccades in humans: evidence for shared inputs acting on different neural substrates. J Neurophysiol. 1996;76:2822–2833. doi: 10.1152/jn.1996.76.5.2822. [DOI] [PubMed] [Google Scholar]
- Kustov AA, Robinson DL. Shared neural control of attentional shifts and eye movements. Nature. 1996;384:74–77. doi: 10.1038/384074a0. [DOI] [PubMed] [Google Scholar]
- Melcher D, Kowler E. Shapes, surfaces and saccades. Vision Res. 1999;39:2929–2946. doi: 10.1016/s0042-6989(99)00029-2. [DOI] [PubMed] [Google Scholar]
- Müller JR, Philiastides MG, Newsome WT. Microstimulation of the superior colliculus focuses attention without moving the eyes. Proc Natl Acad Sci U S A. 2005;102:524–529. doi: 10.1073/pnas.0408311101. [DOI] [PMC free article] [PubMed] [Google Scholar]
- Munoz DP, Guitton D. Control of orienting gaze shifts by the tectoreticulospinal system in the head-free cat. II. Sustained discharges during motor preparation and fixation. J Neurophysiol. 1991;66:1624–1641. doi: 10.1152/jn.1991.66.5.1624. [DOI] [PubMed] [Google Scholar]
- Munoz DP, Wurtz RH. Fixation cells in monkey superior colliculus. I. Characteristics of cell discharge. J Neurophysiol. 1993a;70:559–575. doi: 10.1152/jn.1993.70.2.559. [DOI] [PubMed] [Google Scholar]
- Munoz DP, Wurtz RH. Fixation cells in monkey superior colliculus. II. Reversible activation and deactivation. J Neurophysiol. 1993b;70:576–589. doi: 10.1152/jn.1993.70.2.576. [DOI] [PubMed] [Google Scholar]
- Munoz DP, Wurtz RH. Saccade-related activity in monkey superior colliculus. I. Characteristics of burst and buildup cells. J Neurophysiol. 1995a;73:2313–2333. doi: 10.1152/jn.1995.73.6.2313. [DOI] [PubMed] [Google Scholar]
- Munoz DP, Wurtz RH. Saccade-related activity in monkey superior colliculus. II. Spread of activity during saccades. J Neurophysiol. 1995b;73:2334–2348. doi: 10.1152/jn.1995.73.6.2334. [DOI] [PubMed] [Google Scholar]
- Ottes FP, Van Gisbergen JA, Eggermont JJ. Visuomotor fields of the superior colliculus: a quantitative model. Vision Res. 1986;26:857–873. doi: 10.1016/0042-6989(86)90144-6. [DOI] [PubMed] [Google Scholar]
- Pelli DG. The VideoToolbox software for visual psychophysics: transforming numbers into movies. Spat. Vis. 1997;10:437–442. [PubMed] [Google Scholar]
- Quaia C, Aizawa H, Optican LM, Wurtz RH. Reversible inactivation of monkey superior colliculus. II. Maps of saccadic deficits. J Neurophysiol. 1998;79:2097–2110. doi: 10.1152/jn.1998.79.4.2097. [DOI] [PubMed] [Google Scholar]
- Robinson DA. Eye movements evoked by collicular stimulation in the alert monkey. Vision Res. 1972;12:1795–1808. doi: 10.1016/0042-6989(72)90070-3. [DOI] [PubMed] [Google Scholar]
- Schiller PH, Stryker M. Single-unit recording and stimulation in superior colliculus of the alert rhesus monkey. J Neurophysiol. 1972;35:915–924. doi: 10.1152/jn.1972.35.6.915. [DOI] [PubMed] [Google Scholar]
- Takahashi M, Sugiuchi Y, Izawa Y, Shinoda Y. Synaptic inputs and their pathways from fixation and saccade zones of the superior colliculus to inhibitory burst neurons and pause neurons. Ann N Y Acad Sci. 2005;1039:209–219. doi: 10.1196/annals.1325.020. [DOI] [PubMed] [Google Scholar]
- Waitzman DM, Ma TP, Optican LM, Wurtz RH. Superior colliculus neurons mediate the dynamic characteristics of saccades. J Neurophysiol. 1991;66:1716–1737. doi: 10.1152/jn.1991.66.5.1716. [DOI] [PubMed] [Google Scholar]
- Wurtz RH, Albano JE. Visual-motor function of the primate superior colliculus. Annu Rev Neurosci. 1980;3:189–226. doi: 10.1146/annurev.ne.03.030180.001201. [DOI] [PubMed] [Google Scholar]
- Wyatt HJ, Pola J, Fortune B, Posner M. Smooth pursuit eye movements with imaginary targets defined by extrafoveal cues. Vision Res. 1994;34:803–820. doi: 10.1016/0042-6989(94)90218-6. [DOI] [PubMed] [Google Scholar]
Associated Data
This section collects any data citations, data availability statements, or supplementary materials included in this article.