

Abstract
It has been reported that mechanical vibrations of the MRI scanner could produce spurious signal dropouts in diffusion-weighted images resulting in artifactual anisotropy in certain regions of the brain with red appearance in the Directionally Encoded Color maps. We performed a review of the frequency of this artifact across pediatric studies, noting differences by scanner manufacturer, acquisition protocol, as well as weight and position of the subject. We also evaluated the ability of automated and quantitative methods to detect this artifact. We found that the artifact may be present in over 50% of data in certain protocols and is not limited to one scanner manufacturer. While a specific scanner had the highest incidence, low body weight and positioning were also associated with appearance of the artifact for both scanner types evaluated, making children potentially more susceptible than adults. Visual inspection remains the best method for artifact identification. Software for automated detection showed very low sensitivity (10%). The artifact may present inconsistently in longitudinal studies. We discuss a published case report that has been widely cited and used as evidence to set policy about diagnostic criteria for determining vegetative state. That report attributed longitudinal changes in anisotropy to white matter plasticity without considering the possibility that the changes were caused by this artifact. Our study underscores the need to check for the presence of this artifact in clinical studies, analyzes circumstances for when it may be more likely to occur, and suggests simple strategies to identify and potentially avoid its effects.
Keywords: DTI, weight, position, quality, regrowth
INTRODUCTION
Diffusion Tensor Imaging (DTI) (Basser, Mattiello, and LeBihan 1994) is a quantitative Magnetic Resonance Imaging (MRI) technique used to study the structure and architecture of human brain tissue (Pierpaoli et al. 1996). However, DTI data is known to suffer from numerous artifacts, which affect the quantitative accuracy and precision of tensor derived metrics (Jones, Knösche, and Turner 2012; Pierpaoli 2010). Switching of the diffusion gradients produces vibrations in the gradient coils that propagate to other components of the MRI scanner, including the subject table. Although these vibrations may be exploited to measure tissue properties using magnetic resonance elastography (MRE) (Gallichan et al. 2009), they are also known to produce an unwanted artifact in diffusion weighted-images (DWI) (Gallichan et al. 2010; Hiltunen et al. 2006; Jones 2010; Tournier, Mori, and Leemans 2011). The artifact manifests as increased diffusivity in the left-right direction, mainly in parietal-occipital regions (Gallichan et al. 2010; Liu and Liu 2011) resulting in increased fractional anisotropy (FA) (Basser and Pierpaoli 1996), and red appearance in directionally encoded color (DEC) maps (Pajevic and Pierpaoli 1999).
Although the artifact is documented and methods to avoid, detect, or correct the artifact have been proposed (Farzinfar et al. 2013; Gallichan et al. 2010; Koch and Finsterbusch 2011; Mohammadi, Nagy, Hutton, et al. 2012; Scherrer and Warfield 2012; Sharman et al. 2011), few investigators mention inspecting for it in their diffusion MRI studies (Jensen and Helpern 2010; Mohammadi, Keller, et al. 2012). Even when mentioned, it is often cursorily discussed as a possible confound for their findings (Aso et al. 2013; Budde et al. 2011; Mohammadi, Nagy, Möller, et al. 2012; Mohammadi et al. 2013; Rapacchi et al. 2011; K. Mueller et al. 2011). Also, all references to the artifact are related to a specific scanner (Siemens 3T Trio) although some studies do not report the scanner manufacturer, leaving open the possibility that it could be found on other scanners (Mohammadi, Nagy, Möller, et al. 2012; Jones 2010; Budde et al. 2011). Systematic investigations have focused on quantifying the effects of the artifact on a single subject or gel phantom (Gallichan et al. 2010), or have measured the gradient induced vibration without assessing the presence of artifacts in the DWIs (Hiltunen et al. 2006), but prevalence of this artifact across a population of study participants has only been reported once for a Siemens scanner ranging from 1–54% across four sites (Farzinfar et al. 2013).
To achieve a more detailed understanding of the impact of this artifact in a clinical research setting, we conducted a retrospective review of our data and report the frequency of the artifact across datasets acquired on two scanners from different manufacturers (GE and Siemens). We identified the artifact by systematic visual inspection of the DWIs and the DEC maps, and evaluated the only automated tool publicly available for the detection of this artifact (entropy tool within DTIPrep) (Oguz et al. 2014; Farzinfar et al. 2013), as well as another quantitative tool for general DWI artifact detection, RESTORE (Chang, Jones, and Pierpaoli 2005). In addition, we analyzed whether two factors—weight and positioning—contribute to the presence of the artifact. Our attention toward positioning was based on our observations during visual inspection that suggested that positioning might influence the presence of the artifact. Our investigation of weight was based on references that identified weight load as an influential factor. Specifically, Siemens addressed the vibration artifact by designing a new patient table that no longer has the table board in contact with the gradient coil (Liu and Liu 2011). In the patent for the new scanner bed, it was noted that the artifact may be reduced if the load on the table is greater than approximately 30kg or if load distribution is adjusted. Thus, we hypothesized that greater weight and positioning away from center will be associated with decreased incidence of the artifact. On a prospective, single subject basis, we also implemented solutions previously suggested and investigated additional solutions for avoiding the artifact.
METHODS
Retrospective Analysis
We reviewed DWI data acquired on pediatric subjects from two scanner manufacturers (Siemens 3T Trio and General Electric (GE) Signa HDX). We examined whether weight and head position influenced the manifestation of the artifact. Two hundred thirty-one children were included with three acquisition protocols resulting in a review of 484 datasets. The subject population included patients (autism or epilepsy) and typically developing (TD) controls. GE Data: One hundred eighty-eight children ranging in age from 17 months to 10 years were scanned on a 1.5T GE Signa HDX. There were two acquisition protocols that were designed to reproduce the protocol used by the NIH MRI Study of Normal Brain Development (http://pediatricmri.nih.gov). Some children were scanned under both acquisition protocols and a subset had a repeat study for a total of 441 GE datasets. One hundred ninety-one scans were acquired with the higher resolution protocol (High-Res GE) of 60 directions at b=1100s/mm2, 10 directions at b=300s/mm2 and 10 b=0s/mm2 for 80 brain volumes, 2.5mm isotropic voxels, 86 slices at 2.5mm thickness, and TE/TR 84.5/21330ms. Two hundred fifty scans were acquired with the lower resolution protocol (Low-Res GE) 6 directions at b=1000s/mm2 repeated 4 times, 6 directions at b=500s/mm2 repeated 2 times, and 6 b=0s/mm2 for 42 brain volumes, 3mm isotropic voxels, 86 slices at 3mm thickness, and TE/TR 71.9/12408ms. Seventy-eight datasets were repeat studies (mean time between scans = 2.4 years; range = 15 days–3.63 years). This longitudinal data was examined to determine if the artifact persisted, disappeared, or appeared de novo at the second scan.
Siemens Data
Forty-three children were acquired on a 3T Siemens Trio ranging in age from 7 to 16 years. The Siemens DTI data were acquired with 30 directions at b=1000s/mm2 and 5 b=0s/mm2, repeated twice for 70 brain volumes, 2.5 mm isotropic voxels, 55 slices at 2.5mm thickness, GRAPPA=2, and TE/TR = 86/6300ms. Data were collected before and after a manufacturer upgrade, which did not include the updated scanner bed intended to eliminate the vibration artifact. The upgrade did include a gradient upgrade to the Siemens “TQ-engine system”, which has maximum gradient amplitude of 45 mT/m for the longitudinal direction and 40 mT/m for the horizontal and vertical directions.
Detection of the artifact was done by three methods. One method was a systematic visual inspection of both DWI and DEC maps. Visual inspection was compared to a second automated detection method using the entropy tool within DTIPrep (Oguz et al. 2014; Farzinfar et al. 2013). Lastly, we also evaluated the utility of a quantitative measure (chi-squared) as a possible method of detecting outlier data using RESTORE robust tensor fitting (Chang, Jones, and Pierpaoli 2005; Chang, Walker, and Pierpaoli 2012).
For visual inspection, DEC maps were available following a correction pipeline using TORTOISE (Pierpaoli et al. 2010) to reduce effects of motion, eddy current distortions, and EPI distortions. Corrections were performed in the native space of each subject. Following corrections, nonlinear tensor fitting was used to estimate the diffusion tensor and tensor derived metrics, which produced the DEC maps. Inter-rater reliability was measured using Cohen’s kappa (Mackinnon 2000) using the following criteria for determining whether the artifact was present:
Visual inspection of the diffusion-weighted images for signal dropouts.
If a signal dropout is evident, confirm that the dropout occurs in the areas that are suggestive of the vibration artifact (parietal-occipital) and consistently in a particular diffusion direction when looking across the entire acquisition for that subject. In contrast, bulk head motion has a different pattern of large or whole brain signal dropout occurring in any gradient direction, and within a volume, has a typical “venetian blind” or staircase pattern when viewed from an orthogonal plane.
Inspecting the DEC map for presence of a red hue in the parietal- occipital region of the brain, as well as any other unusual patterns such as in inferior, ventral frontal regions as described by Gallichan and colleagues.
For the automated detection, we imported Low-Res GE TORTOISE-corrected data into DTIPrep. We only conducted the entropy analysis with the Low-Res GE data because there was not enough artifact-free data in the Siemens data to establish the acceptable range of entropy values. The mean and standard deviation of acceptable entropy values were established from a set of artifact-free samples (n=41). Those values were then used to calculate z-scores to categorize the quality of the remaining Low-Res GE DTI scans. We used categories as described by the entropy tool developers (z<1.64 is Acceptable; z≥ 1.64 is Suspicious; z≥ 2.58 Unacceptable). In order to compare visual inspection with the entropy tool, we collapsed the suspicious/unacceptable categories to match the present/not present decision of a visual read. Sensitivity and specificity and the 95% confidence intervals (CI) of the entropy tool to detect the artifact as compared to visual inspection was calculated (Mackinnon 2000).
Evaluation of chi-squared was done by calculating mean chi-squared values for two regions of interest (ROI) within the vibration artifact. One ROI was drawn on the slice of the DEC map that was within the core of the vibration artifact where the vibration artifact was most visually intense (i.e., strongest degree of anisotropy (redness)). The second ROI was drawn at the periphery of the artifact where the artifact was still visually evident but often was the last slice before it was no longer apparent. The mean chi-squared values from each ROI were used to determine the percent of voxels in the entire brain for that subject that had a chi-squared value greater than or equal to that value. With this data we are able to get a sense of how specific the chi-squared values might be in detecting abnormalities related to the vibration artifact (e.g., the percentage of voxels in the brain that were at or above the values within the vibration artifact).
In addition to detection, analysis focused on assessing the prevalence of the artifact within the clinical dataset and across time points for the subset of longitudinal data. We conducted a chi-squared analysis to determine if prevalence of the artifact differed by protocol. A multivariate analysis of variance (MANOVA) was used to determine if weight and the six position parameters differed between the group with vibration and the group without vibration artifact across the different scanner protocols. Weight data in kilograms were collected at the time of scanning. Patient position data included translation and rotation. Translation was computed as the distance in millimeters (x,y,z) of the center of the central slice from the scanner isocenter, while rotation indicates the angle of the head from its native position to a standard AC_PC orientation (x rotation (pitch), y rotation (yaw), z rotation (roll)). Positioning information was obtained from the DICOM header and the parameters computed by the TORTOISE software (Pierpaoli et al. 2010) used for registering the subject data to standardized space. We also conducted a canonical linear discriminant analysis to determine if the presence of artifact could be predicted from a linear combination of these same variables.
Historical data analyzed in this study were acquired in studies approved by the Combined Neurosciences Institutional Review Board of the National Institutes of Health or the Institutional Review Board of the Children’s National Medical Center. Parents provided informed consent and minors—who were able—provided assent.
Single Subject Evaluation of Strategies for Avoiding the Artifact
We prospectively tested factors that could affect the presence of the artifact to optimize our DTI acquisition on a Siemens 3T Trio scanner. We examined the effect of different degree of k-space coverage in the acquisition, because Gallichan and colleagues suggested that acquiring full k-space parallel-accelerated data was the most feasible option for preventing the signal loss associated with the vibration artifact, while also managing increases in echo time (TE). Moreover, we also investigated head re-positioning—at a more extreme angle than is typical—as a strategy to avoid the artifact.
This pilot testing was conducted on a single healthy subject (age 32 male) on a 3T Siemens Trio scanner. The following correction strategies were tested: 1) using full k-space acquisition in place of the default ¾ k-space acquisition, 2) increasing the repetition time (TR), 3) using a dual spin-echo (Reese et al MRM 2003) for acquisition, 4) altering head position two ways. Six serial scans were acquired with a single-shot EPI sequence using the following parameters: 41 diffusion directions, 31 b=1100s/mm2, 5 b=300s/mm2, and 5 b=0s/mm2, and GRAPPA=2, matrix=96x96, FOV=240mm, slice thickness=2.5mm skip 0, 64 slices, TE/TR=87/7500ms. The first scan was with no correction strategy acquired with ¾ k-space. The second scan was modified for full k-space acquisition. The third scan had full k-space and TR = 11000ms. The fourth scan used a dual-spin-echo diffusion preparation period. The fifth scan altered head position by pitch ±30 degrees. The sixth scan altered head position by roll ±45 degrees.
RESULTS
Retrospective analysis
Detection of the Artifact
Inter-rater agreement of visual inspection was excellent (Cohen’s Kappa = 0.81 (95% CI: 0.63–0.99). Visual rating discrepancies were due to instances where the signal dropout was subtle. We found that that the entropy tool had a high percentage of false negatives resulting in 10% sensitivity (95% CI: 0.04–0.20) and 95% specificity (95% CI: 0.90–0.98) using visual rating as a reference. The entropy tool often missed subtle cases of the artifact (Figure 1). There were no instances of a false positive (i.e., identifying an artifact-free dataset as abnormal), but in a few instances the entropy tool identified abnormalities that were not specific to vibration artifact such as residual eddy distortion.
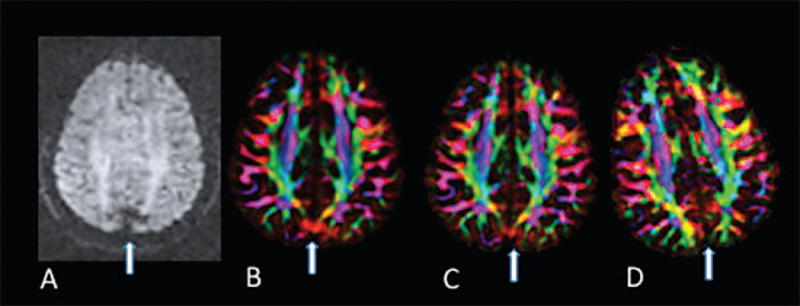
Figure 1.
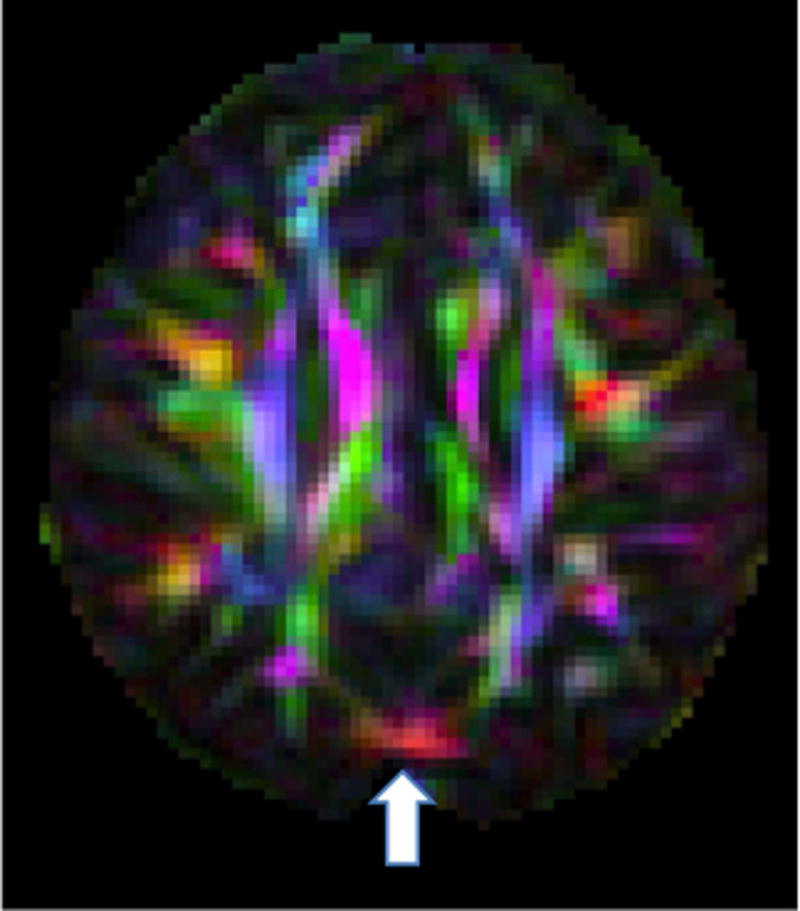
An example of a subtle artifact as seen in the DEC map of an axial slice in a GE dataset showing evidence of vibration artifact in the occipital area. The entropy tool of DTIPrep did not detect this artifact
The range of chi-squared values across core and periphery ROIs of the vibration artifact was large (Range: 0.74 – 60.86, Table I). This was true for both GE and Siemens data. By definition, it is expected that regions with no artifact should have chi-squared values near one. While on average the chi-squared values from artifact regions were higher than one, the standard deviation was large (Table I). This was true for ROIs in the core of the artifact as well as at the periphery. As a result, many voxels in which the artifact was not present shared the same chi-squared value as those with the artifact. At the extreme for one subject, 83% of brain voxels would have been identified as artifactual based on the chi-squared mean value from the artifact ROI. Chi-squared lacked specificity in detecting vibration abnormality in GE datasets as an average of 30.65% (SD 21.66%) of voxels shared the same or higher chi-squared values as those mean values from the core ROI. Chi-squared values were slightly more specific for Siemens data as an average of 7.39% (SD 10.93%) of voxels throughout the brain had the same or higher chi-squared value as the mean chi-squared value found in the core ROI. The lack of specificity is because there are instances when the vibration artifact is evident in the DEC map but the chi-squared is normal (Figure 2A &B). Moreover, even when an abnormality is present in both the DEC map (Figure 3A) and chi-squared (Figure 3B), after using RESTORE to remove the data contributing to the artifact, significant artifact persisted in the DEC map (Figure 3C) despite having a normalized chi-squared (Figure 3D).
Table I.
Descriptives by scanner of chi-square values within ROIs drawn within the vibration artifact
| Siemens | Lo-Res GE | |
|---|---|---|
| Range of mean chi-square values for ROIs with vibration artifact | 0.95–14.56 | 0.74–60.86 |
| Mean chi–square in the core of the vibration artifact ROI (SD) | 6.08 (4.33) | 6.49 (8.28) |
| Mean chi–square in the periphery of the vibration artifact ROI (SD) | 2.29 (0.797) | 5.49 (6.26) |
Figure 2.
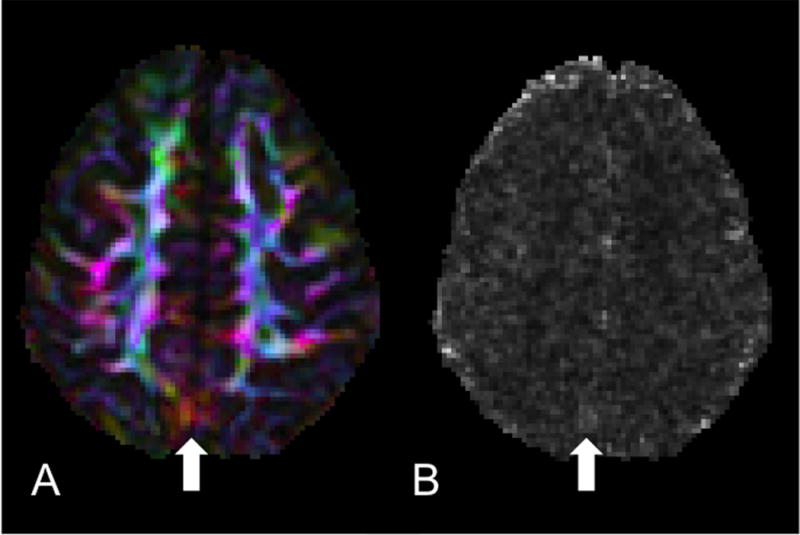
Lack of specificity of chi-squared. A) DEC map of an axial slice of a Siemens dataset where the vibration artifact is clearly visible yet subtle. B) Chi-squared map from the tensor fitting of the same slice showing no elevated chi-squared values in the region of the artifact but some elevated values elsewhere from the artifact.
Figure 3.
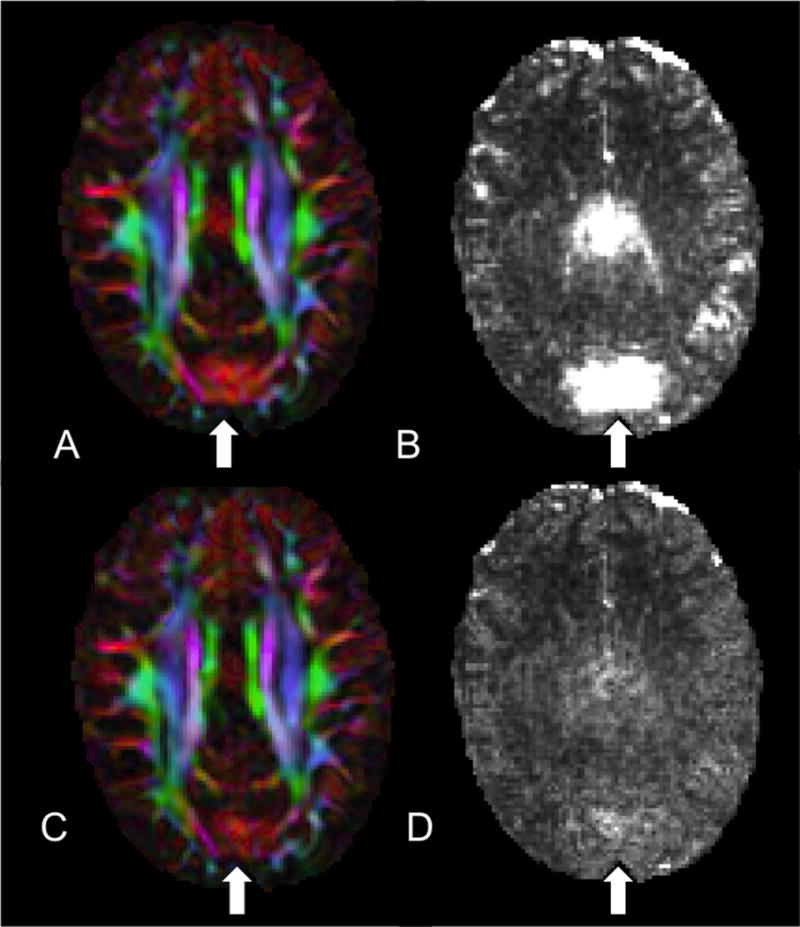
Assessing the use of RESTORE to identify and remediate the artifact. A) DEC map where the vibration artifact is present. B) Chi-squared is elevated in the same region as (A). C) DEC map still showing significant abnormalities yet the corresponding chi-squared map (D) after tensor fitting with RESTORE showing no abnormal values.
Frequency of the Artifact
By visual inspection, the artifact was identified in 18% of all pediatric datasets (n=87 of 484). The artifact was more frequent in the Siemens data (48.8%) followed by the Low-Res GE data (24.4%) then the High-Res GE data (2.6%) (χ2 = 65.33, p<.001, Table II). A higher percentage of data acquired after the Siemens scanner gradient upgrade compared to pre-upgrade were affected by the artifact (68.9% post-upgrade vs 7% pre-upgrade, p<.001 FET). For GE, 130 scans (52% of the data) were collected between August 2006 through August 2009 and all the artifacts occurred in that timeframe, prior to a software upgrade, while the other 120 scans collected between September 2009 through May 2011, after a software upgrade, had no artifact (Figure 4).
Table II.
Descriptives of rate of occurrence, weight and positioning factors by scanning protocol.
| Siemens | Lo-Res GE | Hi-Res GE | ||||
|---|---|---|---|---|---|---|
| Incidence of Artifact | 48.8% | 24.4% | 2.6% | |||
| No Artifact (n=22) | Artifact (n=21) | No Artifact (n=189) | Artifact (n=61) | No Artifact (n=186) | Artifact (n=5) | |
| Parameters [Mean (SD)] | ||||||
| Weight (kg)a,b | 45.3 (16.1) | 34.1 (9.8) | 22.12 (8.14) | 18.05 (4.63) | n/a | n/a |
| x displacement (mm) | −2.20 (5.69) | −3.48 (9.40) | −3.23 (4.53) | −2.45 (4.15) | n/a | n/a |
| y displacement (mm)a | −37.58 (16.62) | −50.56 (13.48) | −33.51 (12.12) | −33.61 (8.26) | n/a | n/a |
| z displacement (mm)b | 13.62 (19.85) | 13.71 (11.04) | 17.20 (17.38) | 7.38 (13.40) | n/a | n/a |
| x rotation (degrees) | 4.57 (8.11) | 6.34 (5.51) | −1.39 (10.09) | −2.66 (9.67) | n/a | n/a |
| y rotation (degrees) | −0.07 (2.45) | −1.30 (2.82) | 0.25 (3.35) | −0.52 (4.49) | n/a | n/a |
| z rotation (degrees)b | −0.93 (2.35) | −0.94 (3.33) | −2.41 (5.07) | 0.04 (5.87) | n/a | n/a |
= p<.05 for Siemens;
= p<.01 for Lo-Res GE
Figure 4.
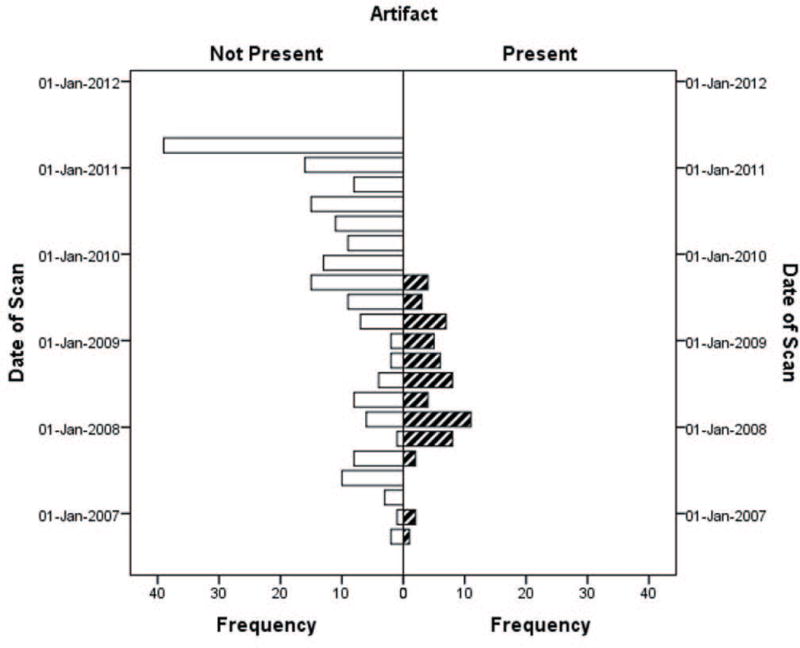
Presence of vibration artifact in Low-Res GE data over time. No artifact was evident after September 2009 when a software upgrade occurred.
Seventy-eight repeated scan datasets were reviewed for the longitudinal analysis. Forty-three (55%) had no vibration artifact at either time point. Of the 35 that had the vibration artifact, one had it on both scans, 31 had the artifact at Scan 1 but not at the Scan 2 (Figure 5), and three had the artifact only at the second timepoint.
Figure 5.
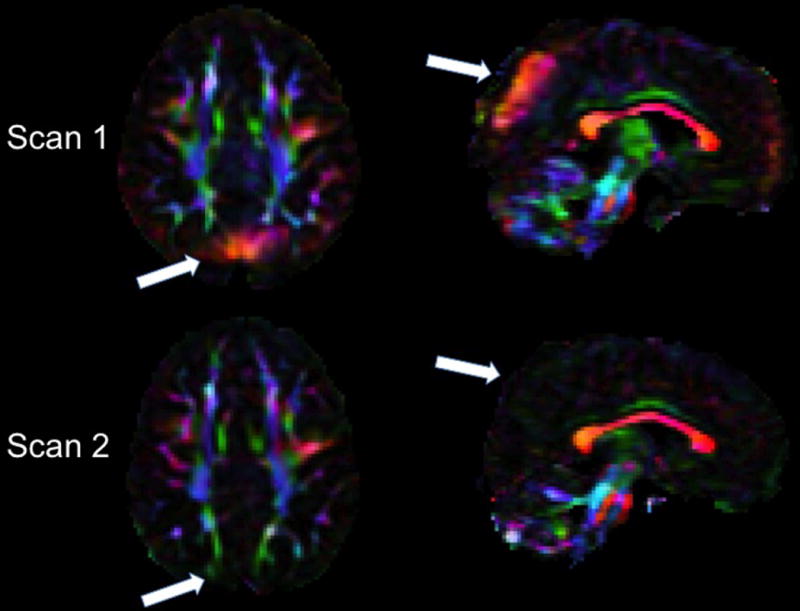
Example of inconsistent occurrence of the high anisotropy produced by the artifact in longitudinal scans of the same subject. Axial and sagittal views of the directionally encoded color (DEC) map of Scan 1 (top) and Scan 2 acquired 34 months later (bottom) in the same child in the GE scanner. White arrows indicate brain regions affected by the vibration artifact in Scan 1 that show no evidence of the artifact in Scan 2.
Influence of weight and positioning
The High-Res GE data were excluded from these analyses because they were nearly artifact free. Separate MANOVAs were performed on the Siemens and Low-Res GE datasets. Descriptive data (Table II) reveals that the range of positioning parameters was narrow with average displacement in any direction within 50 millimeters and average rotation within 8 degrees. The data with vibration artifact differed from data with no artifact with respect to weight and positioning parameters for both the Siemens (F = 2.532, p=.035) and Low-Res GE data (F = 5.911, p<.001). These parameters account for more of the variance between the artifact/no artifact groups in the Siemens protocol than in the GE protocol (Siemens ηp2=.364 vs. Low-Res GE ηp2=.157). For both protocols, subjects with artifact weighed significantly less than subjects without artifact (Figure 6). For Siemens only, subjects with vibration artifacts were positioned at a more negative y axis location with respect to the isocenter of the magnet. For the Low-Res GE data, subjects with vibration artifacts were less displaced in the positive z direction and less rotated in the negative z rotation. We also tested whether these group differences remained using absolute values for the z rotation given that it should not matter if one is rotated left or right given the symmetry of the brain around that axis and because we noticed that the effect was largely due to a few outliers. Indeed, the z rotation finding was no longer significant when using absolute values. The displacement findings, however, held.
Figure 6.
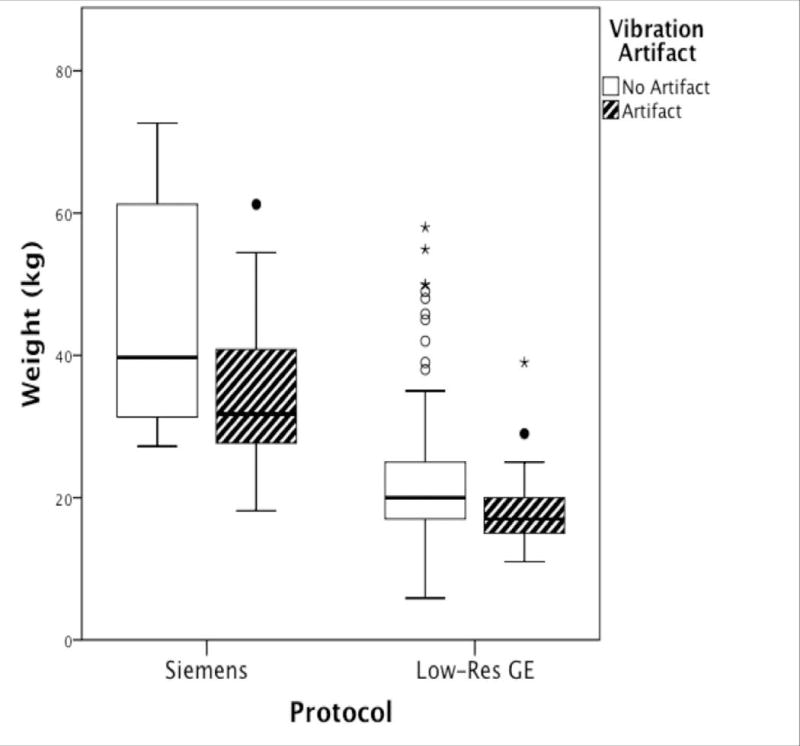
Boxplots of subjects’ weight (kilograms) grouped by scanning protocol and presence of the artifact. Dark lines within boxplot represent median values.
For the discriminant analysis, the value of the discriminant function was different for data with the artifact and data without the artifact for both Siemens (Wilks λ = .581, Chi-squared = 18.198, df = 7, Canonical correlation = .647, p = .011) and Low-Res GE data (Wilks λ = .878, Chi-squared = 29.429, df = 7, Canonical correlation = .350, p < .001). However, consistent with MANOVA results, there were differences in findings by scanner. For Siemens, correlations between predictor variables and the discriminant function suggested that y displacement and weight, followed by z and y rotation were the best predictors of vibration artifact. The function extracted for Siemens data accounted for 72.2% of the variance for whether there was vibration artifact present or not, suggesting some added value for considering the linear combination of variables. The Siemens data function successfully predicted outcome for 76.9% of cases, with accurate predictions being made for 80.0% of data with no vibration artifact and 73.7% of data with vibration artifact. For Low-Res GE data, weight and z displacement were the best predictors of vibration artifact, followed by y rotation, x displacement, and z rotation, respectively. The function extracted for Lo-Res GE data only accounted for 13.9% of the variance for whether there was vibration artifact present or not. As a result, there was successful prediction of outcome for only 64.1% of cases, with accurate predictions being made for 59.9% of data with no vibration artifact and 76.3% of data with vibration artifact.
Single Subject Evaluation of Strategies for Avoiding the Artifact
For the single subject, the artifact was observed in the raw diffusion data (7A) and DEC map (Figure 7B). We found that the artifact was reduced when using full k-space coverage, but not completely eliminated (Figure 7C), and was eliminated by altering the head position with a +45 degree roll (Figure 7D). Increasing the TR, setting the diffusion preparation to dual-spin-echo, and altering the pitch did not affect the artifact beyond the improvement made when using full k-space acquisition.
Figure 7.
Effect of head rotation and k-space coverage on the occurrence of the artifact in repeated scans of the same subject. A) Raw diffusion data. Diffusion gradient direction was [x, y, z] = [.9, −.42, 0.11] B) DEC map with original settings C) DEC map using full k-space coverage D) DEC map with altered head position.
DISCUSSION
We investigated the prevalence of a previously described vibration artifact in DWI data collected in pediatric clinical datasets on different scanners. We found that the prevalence of the artifact was present across multiple scanner manufacturers (not just Siemens) and affected by acquisition protocol. Even for the same scanner, software and hardware upgrades were strongly associated with changes in the incidence of the problem. Weight and positioning of the subject also were factors in its manifestation. While an automated software tool is available to detect the artifact (DTIPrep), on our data it showed very low sensitivity and therefore, in our view, visual inspection should still be the method of choice for detecting the artifact. Lastly, longitudinal data showed that the artifact is often inconsistently present in repeated scans of the same subject. We discuss the implications of our findings for interpreting DTI scans.
Having a better sense of the frequency of the artifact is important for determining the risk level of how this artifact may impact one’s data and the potential for lost resources. Our results suggest that in the worst-case scenario, a majority of one’s data could be contaminated, but the risk is scanner and acquisition protocol dependent. Changing acquisition protocols to different resolutions or upgrading of sequences that presumably include gradient changes may impact the likelihood of having a vibration artifact. For example, the Siemens upgrade to the “TQ-engine system” resulted in a significant increase of the problem. For the GE scanner, vibration artifacts were present only in the low-resolution acquisitions and in a particular time window prior to a software upgrade. As Gallichan and colleagues suggested, k-space coverage influences manifestation of the artifact. However, on the Siemens scanner during our pilot testing, increasing k-space coverage did not completely eliminate the problem. On the GE scanner there were changes to the amount of k-space coverage between software versions before and after upgrade resulting in a decrease in artifact. A similar low resolution protocol on GE scanners was used by the NIH MRI Study of Normal Brain Development (http://pediatricmri.nih.gov). A systematic quality assessment performed in preparation of that database showed no instances of vibration artifact in data acquired on GE scanners with this protocol (Nayak et al. 2011); however, data were collected with an earlier version of the software than that used in this study. Unfortunately, these software changes implemented by the manufacturers are often not known by the end user.
This study highlights that the artifact is not limited to a single scanner manufacturer. It would be informative for clinical research centers with other scanner manufacturers (e.g. Philips) to conduct a similar review to compare to our findings. Moreover, as new gradient systems and upgrades become available, we suggest that DTI data should be systematically inspected for this artifact. The artifact is relatively easy to identify because it is pervasive enough and consistent regarding location, with occipital-parietal regions being mostly affected, although we and other investigators also found vibration artifacts in frontal areas. We found that viewing an entire volume across axial slices is optimal for checking for the artifact and were able to achieve very high inter-rater reliability with fairly simple criteria. There are several reasons for relying on visual inspection rather than an automated tool for identifying this artifact. As also noted by another group (Farzinfar et al. 2013), we highlight that vibration artifacts can result in regions of spurious anisotropy (with left-right preferential orientation and red hue in the directionally encoded color maps) without an obvious abnormality in the residuals of the tensor fitting and the chi-squared map. Essentially, the signal dropout in the x-direction can increase with a function sufficiently compatible with the tensor model to prevent chi-squared values from appearing abnormal (Figures 2B). Even if an abnormality in chi-squared is present, using RESTORE (Chang, Jones, and Pierpaoli 2005) removes the data most contributing to the abnormality and normalizes chi-squared results (Figure 3D). Unfortunately, in the case of vibration artifacts, significant artifacts may still be present in the DEC maps even if the chi-squared map is normalized (Figure 3C). Thus, chi-squared values from within vibration artifact regions have high variability, which then diminishes the specificity of that metric as a helpful in detecting the vibration artifact.
The “co-regressor” (Gallichan et al. 2010) approach is another method proposed to detect and potentially remediate the vibration artifact. We did not test this method because there is not software readily available to apply to large datasets. However, as a hypothesis for further investigation we would expect this method to perform similarly to RESTORE because it attempts to detect abnormal signal attenuation that is not consistent with the tensor model, which is what RESTORE does, although the specific metric used is different.
While automated detection tools for this artifact would be useful to avoid the tedious visual inspection step, the only currently available tool, the entropy tool implemented in DTIPrep (Farzinfar et al. 2013), has limitations. First, it can only be used on a large dataset because it needs enough artifact-free data to establish an appropriate range of entropy values. Thus, our Siemens dataset that had only 43 total datasets but half were impacted by the artifact could not undergo the training step. Second, while there was enough GE data to go through the entropy pipeline, the sensitivity of the tool was very low (10%). There are possible reasons for this unsatisfactory result. One reason is that the tool may require artifacts to be large in magnitude and spatial extension to be detected while the vibration artifact in our GE datasets was often subtle as compared to the Siemens datasets (Figure 1 vs 3A). In fact a more recent paper from the developers of this tool reports the rates of detection of the entropy tool as 100% for severe artifact but as low as 67% for more subtle artifact (Oguz et al. 2014). We consulted the developers to inquire about other possible explanation for our results and they suggested that a reason could be the mask used for the entropy computation. The developers used brain masking that removes all CSF regions as well as the usual skull stripping (Farzinfar et al. 2013), but this method of masking is not currently part of their DTIPrep automated pipeline (email communication Styner 2015).
We consider factors that contribute and strategies to address the artifact. Siemens addressed the problem by updating the scanner bed (Liu and Liu 2011); however, there is a report that the problem is improved but persists even following a scanner bed upgrade (Farzinfar et al. 2013), and many existing systems may still have the old bed configuration. We are aware that manufacturers have worked to improve equipment and software to reduce artifacts, which is evident from the timing of the GE data where the artifact was no longer evident in scans acquired at a later date. Increased weight was associated with avoiding the artifact for both GE and Siemens scanners. Weight was particularly influential for Siemens data, which is consistent with how the problem is described in Siemens’ own analysis of the problem in their patent. Our prospective pilot testing on a single subject indicated that altering the roll of head placement potentially affects the artifact. Specifically, the artifact was reduced with the head slightly rotated. Perhaps, repeating the scan with the head rotated could be used as a strategy for addressing the problem. Rotational parameters were not associated with the artifact in the archival review, perhaps because the range of rotation was quite narrow and only a few datasets exceeded 20 degrees while the pilot testing was done at a more dramatic angle of about 45 degrees. The direction of the displacement associated with frequency of the artifact differed by manufacturer/protocol. For Siemens, greater y displacement (i.e., having the subject’s head further elevated and away from the bed) was associated with not having artifact, which may be due to having more padding under a child’s head. Either the padding or being farther off the scanner bed may have disrupted the vibration’s effect during the scan. For GE, greater z displacement (i.e., having the subject’s head deeper in the scanner) was associated with not having the artifact. Nonetheless, our modeling with these factors did not explain all the variance—and certainly there are other factors that influence whether the vibration artifact is present, particularly for GE datasets. For Siemens, however, we accounted for a large portion of the variance and were able to predict 77% of cases accurately with information that is standardly known at the outset of a scanning session (weight and y position). Based on this data and our pilot testing, we suggest that altering the position of the head and weight load may reduce the effects of the vibrations within the brain and disrupt the directional bias of the artifact. In the Siemens scanner, repositioning (deeper in the MRI scanner, increased padding to elevate from the bed, and/or rotated from center) or adding of weight may be solutions in addition to changing parameters or doing a hardware replacement of the scanner bed.
Pediatric datasets may be prone to the artifact regardless of scanner type. One reason is because children weigh less. The Siemens patent demarcated a weight of 30kg or less as the tipping point for when the load on the scanning bed is susceptible to vibration artifact. We found a weight of approximately 34kg for our Siemens data as the mean weight for those cases with the artifact. In comparison, the artifact was less frequent in the GE data, which may be related to a different weight threshold (approximately 18kg in our datasets) for when the scans are more susceptible to the artifact. However, there was overlap in the weights of those with and without the artifact, which, similar to our discriminant function, indicates that weight is not the only factor in determining whether the artifact is present. Interestingly, the one other study that examined this artifact also found a higher prevalence of vibration artifact in the their youngest age group (6 months old) even though they did not explicitly examine weight as a factor (Farzinfar et al. 2013). Examination of all possible factors that contribute to the presence of the artifact are not within the scope of this study as this was largely a retrospective review of data. Future investigations would benefit from a more systematic approach that might include a more careful examination of the factors such as acquisitions at higher b-values or higher field strength.
Implications for the interpretation of clinical studies
The finding that weight affects the incidence of this vibration-induced artifact suggests that care should be used in ruling out this confound when data from groups of subjects with different weight are compared. Moreover, our finding that this artifact manifested itself inconsistently in repeated scans of the same subject has important implications for the interpretation of the results of longitudinal diffusion MRI studies. Typically, changes in diffusion metrics, such as anisotropy, between time points are interpreted as indicative of changes in white matter structure and architecture. Given that this artifact could manifest itself inconsistently, it is important to confirm that regional changes in anisotropy are indeed caused by brain changes as opposed to the inconsistent presence of this—or any other—artifact. In this regard, we suspect that this artifact may have lead to misinterpretation of diffusion MRI findings in a previously published clinical study (Voss et al. 2006). This case study claimed that DTI detected brain plasticity, in a 39-year old man who spontaneously recovered from being in a minimally conscious state for 19 years. The patient underwent two scans conducted 18 months apart. There was increased FA in the parietal-occipital region with red appearance in the DEC map at Time 1 that was not present at Time 2. The differences in anisotropy between the two time points were interpreted by the authors as a “transitional stage of an ongoing process…of possible axonal regrowth.” The increased anisotropy with left-right apparent fiber orientation found in this patient was very consistent to the manifestation of this artifact in our data (Figure 5) and in the data reported in other publications (Gallichan et al. 2010; Jones 2010; Tournier, Mori, and Leemans 2011).
The notoriety of this case and the findings led to national and international media coverage (“Man Speaks after 19-Year Silence” 2003; BBC 2003). Beyond general public interest, the case report was also propagated within the scientific community as it has been cited 145 times using an electronic search performed in Web of Science (Science Citation Index All years 1900–2014; final search was completed June 10, 2014 using the title of the Voss article as the search criteria). While some citations were related to the length of survival for the patients, several citations of this study were for issues that had far-reaching policy and economic impact including: a call to change medical dogma about the recovery possibilities of brain-injured patients (Laureys et al. 2006; Schiff 2009); evidence for dedicating resources for systematic and longitudinal study of minimally conscious patients (Fins, Schiff, and Foley 2007; Fins 2011); a “remarkable example of regenerative fibre growth” in support of pursuing drug development for traumatic brain injury (B. K. Mueller, Mueller, and Schoemaker 2009); and a discussion point within an Institute of Medicine exploratory meeting to set policy (Fins, Schiff, and Foley 2007; Fins 2011). Although some of the discussion within these citations called for caution and recognized that the neuroimaging evidence was preliminary as it was based on a single case study, none of the papers considered the possibility of misinterpretation of artifactual data.
The speed at which this article was propagated was assisted by the inherent interest of the case details; however, it also illustrates the danger of univocal clinical interpretation of DTI results. If we would have not considered the possibility of this artifact, we could have claimed “plasticity changes” in the brain of 34 of our subjects who demonstrated similar anisotropy changes in repeated scans. While increased fractional anisotropy can be caused by reorganization or regrowth of axons, alternative explanations must be considered as possible sources of DTI changes (Budde et al. 2011). We cannot be certain that the findings of that paper were due to vibrational artifact; however, we feel that there is a high likelihood because of the location and plausibility of the findings. Inter-hemispheric parietal-occipital white matter plasticity is unlikely as a physiological phenomenon but is exactly where the vibration artifact manifests. Moreover, given that the “axonal regrowth” was evident at the first time-point and disappeared at the second time-point, this is contrary to conventional understanding of neural reorganization principles where it is expected that regrowth should persist because it would be adaptive. Another possibility is that certain brains may have mechanical properties that make them more vulnerable to vibrational artifact. For example, the brain injured patient in the case report had a substantial degree of atrophy and therefore may have had a greater amount of cerebrospinal fluid compared to tissue. Similarly, young children may have larger water content in the brain parenchyma, which may lead to brains of younger subjects to have different mechanical properties from adults and be more susceptible to the occurrence of this DWI artifact for the same level of vibration. Conducting repeat scans with different positioning of the subject would have been a potential test to rule out an artifactual origin of the measured anisotropy. Repositioning the patient by adjusting the roll should not affect anisotropy caused by “axonal regrowth” and the pattern should be consistently present in subsequent scans.
Conclusion
This work reported a systematic analysis of the prevalence of a previously described vibration artifact In DWIs across a population. The most relevant findings include: 1) The artifact can be found in scanners other than Siemens Trio, in particular in pediatric subjects 2) Children may be particularly susceptible because they weigh less than adults 3) We investigate systematically how different factors (scanner, acquisition, weight, positioning) can affect the prevalence of this artifact. We identify head rotation as a new factor that may alter the mechanical coupling and ultimately the manifestation of this artifact. 4) We show that an automated method to identify the artifact was not as sensitive as visual inspection in GE data where the artifact is more subtle 5) We confirm that post-processing remedies that are highly effective at reducing other types of artifacts, such as the RESTORE approach, are largely ineffective in removing this artifact. 6) We also find that some of the solutions proposed to avoid the artifact, such as collecting full k-space data, do not completely eliminate the artifact on our Siemens scanner, 7) Lastly, we address the potential for clinical misinterpretation by discussing a previously published case where changes consistent with this vibration artifacts have been interpreted as having unequivocally a biological origin. Our study underscores the need to check for the presence of this for the vibration artifact, we propose simple strategies to identify and potentially avoid its effects.
Acknowledgments
M.B. was supported by The National Institutes of Health, Neurological Disorders and Stroke [K23NS065121-01A2], and NICHD Intellectual and Developmental Disabilities Research Center and Children’s National Medical Center Grant [P30HD040677]. The authors would like to acknowledge Jay Giedd, Audrey Thurm, and Susan Swedo for providing access to diffusion MRI data used in the retrospective analysis of vibration artifacts as well as participating parents and children.
The diffusion data processing and analysis tools used for this work have been developed and implemented with contributions by employees of the Henry M. Jackson Foundation for the Advancement of Military Medicine Inc.,. The content of the information does not necessarily reflect the position or the policy of the Government, and no official endorsement should be inferred. For purposes of this article, information includes news releases, articles, manuscripts, brochures, advertisements, still and motion pictures, speeches, trade association proceedings, etc. Contract grant sponsor: Department of the Army; Contract grant number W81XWH-13-2-0019 (to A.N. and O.M.I.).
Footnotes
None of the authors have any conflicts of interest to report.
References
- Aso Toshihiko, Urayama Shin-ichi, Fukuyama Hidenao, Le Bihan Denis. Comparison of Diffusion-Weighted fMRI and BOLD fMRI Responses in a Verbal Working Memory Task. NeuroImage. 2013 Feb;67:25–32. doi: 10.1016/j.neuroimage.2012.11.005. [DOI] [PubMed] [Google Scholar]
- Basser PJ, Mattiello J, LeBihan D. MR Diffusion Tensor Spectroscopy and Imaging. Biophysical Journal. 1994;66(1):259–67. doi: 10.1016/S0006-3495(94)80775-1. [DOI] [PMC free article] [PubMed] [Google Scholar]
- Basser PJ, Pierpaoli C. Microstructural and Physiological Features of Tissues Elucidated by Quantitative-Diffusion-Tensor MRI. Journal of Magnetic Resonance Series B. 1996;111(3):209–19. doi: 10.1006/jmrb.1996.0086. [DOI] [PubMed] [Google Scholar]
- BBC. US Man Wakes from 19-Year Coma. 2003 Jul 9; sec. Americas. http://news.bbc.co.uk/2/hi/africa/3052433.stm.
- Budde Matthew D, Lindsay Janes, Gold Eric, Turtzo Lisa Christine, Frank Joseph A. The Contribution of Gliosis to Diffusion Tensor Anisotropy and Tractography Following Traumatic Brain Injury: Validation in the Rat Using Fourier Analysis of Stained Tissue Sections. Brain. 2011;134(8):2248–60. doi: 10.1093/brain/awr161. [DOI] [PMC free article] [PubMed] [Google Scholar]
- Chang Lin-Ching, Jones Derek K, Pierpaoli Carlo. RESTORE: Robust Estimation of Tensors by Outlier Rejection. Magnetic Resonance in Medicine: Official Journal of the Society of Magnetic Resonance in Medicine / Society of Magnetic Resonance in Medicine. 2005;53(5):1088–95. doi: 10.1002/mrm.20426. [DOI] [PubMed] [Google Scholar]
- Chang Lin-Ching, Walker Lindsay, Pierpaoli Carlo. Informed RESTORE: A Method for Robust Estimation of Diffusion Tensor from Low Redundancy Datasets in the Presence of Physiological Noise Artifacts. Magnetic Resonance in Medicine. 2012;68(5):1654–63. doi: 10.1002/mrm.24173. [DOI] [PMC free article] [PubMed] [Google Scholar]
- Farzinfar Mahshid, Oguz Ipek, Smith Rachel G, Verde Audrey R, Dietrich Cheryl, Gupta Aditya, Escolar Maria L, et al. Diffusion Imaging Quality Control via Entropy of Principal Direction Distribution. NeuroImage. 2013 Nov;82:1–12. doi: 10.1016/j.neuroimage.2013.05.022. [DOI] [PMC free article] [PubMed] [Google Scholar]
- Fins Joseph J. Neuroethics, Neuroimaging, and Disorders of Consciousness: Promise or Peril? Transactions of the American Clinical and Climatological Association. 2011;122:336–46. [PMC free article] [PubMed] [Google Scholar]
- Fins Joseph J, Schiff Nicholas D, Foley Kathleen M. Late Recovery from the Minimally Conscious State – Ethical and Policy Implications. Neurology. 2007;68(4):304–7. doi: 10.1212/01.wnl.0000252376.43779.96. [DOI] [PubMed] [Google Scholar]
- Daniel Gallichan, Robson Matthew D, Bartsch Andreas, Miller Karla L. TREMR: Table-Resonance Elastography with MR. Magnetic Resonance in Medicine. 2009;62(3):815–21. doi: 10.1002/mrm.22046. [DOI] [PubMed] [Google Scholar]
- Gallichan Daniel, Scholz Jan, Bartsch Andreas, Behrens Timothy E, Robson Matthew D, Miller Karla L. Addressing a Systematic Vibration Artifact in Diffusion-Weighted MRI. Human Brain Mapping. 2010;31(2):193–202. doi: 10.1002/hbm.20856. [DOI] [PMC free article] [PubMed] [Google Scholar]
- Hiltunen Jaana, Hari Riitta, Jousmäki Veikko, Müller Kiti, Sepponen Raimo, Joensuu Raimo. Quantification of Mechanical Vibration during Diffusion Tensor Imaging at 3 T. NeuroImage. 2006;32(1):93–103. doi: 10.1016/j.neuroimage.2006.03.004. [DOI] [PubMed] [Google Scholar]
- Jensen Jens H, Helpern Joseph A. MRI Quantification of Non-Gaussian Water Diffusion by Kurtosis Analysis. NMR in Biomedicine. 2010;23(7):698–710. doi: 10.1002/nbm.1518. [DOI] [PMC free article] [PubMed] [Google Scholar]
- Jones Derek K. Precision and Accuracy in Diffusion Tensor Magnetic Resonance Imaging. Topics in Magnetic Resonance Imaging. 2010;21(2):87. doi: 10.1097/RMR.0b013e31821e56ac. [DOI] [PubMed] [Google Scholar]
- Jones Derek K, Knösche Thomas R, Turner Robert. White Matter Integrity, Fiber Count, and Other Fallacies: The Do’s and Don’ts of Diffusion MRI. NeuroImage. 2012 Jul; doi: 10.1016/j.neuroimage.2012.06.081. [DOI] [PubMed] [Google Scholar]
- Koch Martin A, Jürgen Finsterbusch. Towards Compartment Size Estimation in Vivo Based on Double Wave Vector Diffusion Weighting. NMR in Biomedicine. 2011;24(10):1422–32. doi: 10.1002/nbm.1711. [DOI] [PubMed] [Google Scholar]
- Laureys Steven, Giacino Joseph T, Schiff Nicholas D, Schabus Manuel, Owen Adrian M. How Should Functional Imaging of Patients with Disorders of Consciousness Contribute to Their Clinical Rehabilitation Needs? Current Opinion in Neurology. 2006;19(6):520–27. doi: 10.1097/WCO.0b013e3280106ba9. [DOI] [PMC free article] [PubMed] [Google Scholar]
- Liu KC, Liu XG. Vibrationally Decoupled Patient Table for Use in Magnetic Resonance System. 2011 Apr; http://www.google.com/patents/US7924008.
- Mackinnon Andrew. A Spreadsheet for the Calculation of Comprehensive Statistics for the Assessment of Diagnostic Tests and Inter-Rater Agreement. Computers in Biology and Medicine. 2000;30(3):127–34. doi: 10.1016/s0010-4825(00)00006-8. [DOI] [PubMed] [Google Scholar]
- Man Speaks after 19-Year Silence. CNN. 2003 http://articles.cnn.com/2003-07-07/us/mute.no.more_1_nursing-home-terry-wallis-pickup-truck?_s=PM:US.
- Mohammadi Siawoosh, Freund Patrick, Feiweier Thorsten, Curt Armin, Weiskopf Nikolaus. The Impact of Post-Processing on Spinal Cord Diffusion Tensor Imaging. NeuroImage. 2013 Apr;70:377–85. doi: 10.1016/j.neuroimage.2012.12.058. [DOI] [PMC free article] [PubMed] [Google Scholar]
- Mohammadi Siawoosh, Keller Simon S, Glauche Volkmar, Kugel Harald, Jansen Andreas, Hutton Chloe, Flöel Agnes, Deppe Michael. The Influence of Spatial Registration on Detection of Cerebral Asymmetries Using Voxel-Based Statistics of Fractional Anisotropy Images and TBSS. PLoS ONE. 2012;7(6):e36851. doi: 10.1371/journal.pone.0036851. [DOI] [PMC free article] [PubMed] [Google Scholar]
- Mohammadi Siawoosh, Nagy Zoltan, Hutton Chloe, Josephs Oliver, Weiskopf Nikolaus. Correction of Vibration Artifacts in DTI Using Phase-Encoding Reversal (COVIPER) Magnetic Resonance in Medicine. 2012;68(3):882–89. doi: 10.1002/mrm.23308. [DOI] [PMC free article] [PubMed] [Google Scholar]
- Mohammadi Siawoosh, Nagy Zoltan, Möller Harald E, Symms Mark R, Carmichael David W, Josephs Oliver, Weiskopf Nikolaus. The Effect of Local Perturbation Fields on Human DTI: Characterisation, Measurement and Correction. Neuroimage. 2012;60(1):562–70. doi: 10.1016/j.neuroimage.2011.12.009. [DOI] [PMC free article] [PubMed] [Google Scholar]
- Mueller Bernhard K, Mueller Reinhold, Schoemaker Hans. Stimulating Neuroregeneration as a Therapeutic Drug Approach for Traumatic Brain Injury. British Journal of Pharmacology. 2009;157(5):675–85. doi: 10.1111/j.1476-5381.2009.00220.x. [DOI] [PMC free article] [PubMed] [Google Scholar]
- Mueller Karsten, Anwander Alfred, Möller Harald E, Horstmann Annette, Lepsien Jöran, Busse Franziska, Siawoosh Mohammadi, et al. Sex-Dependent Influences of Obesity on Cerebral White Matter Investigated by Diffusion-Tensor Imaging. PLoS ONE. 2011;6(4) doi: 10.1371/journal.pone.0018544. [DOI] [PMC free article] [PubMed] [Google Scholar]
- Nayak Amritha, Walker Lindsay, Pierpaoli Carlo, Brain Development Cooperative Group Quality Assessment in a DTI Multicenter Study. 2011;19:2342. [Google Scholar]
- Oguz Ipek, Farzinfar Mahshid, Matsui Joy, Budin Francois, Liu Zhexing, Gerig Guido, Johnson Hans J, Styner Martin. DTIPrep: Quality Control of Diffusion-Weighted Images. Frontiers in Neuroinformatics. 2014;8 doi: 10.3389/fninf.2014.00004. [DOI] [PMC free article] [PubMed] [Google Scholar]
- Pajevic Sinisa, Pierpaoli Carlo. Color Schemes to Represent the Orientation of Anisotropic Tissues from Diffusion Tensor Data: Application to White Matter Fiber Tract Mapping in the Human Brain. Magnetic Resonance in Medicine. 1999;42(3):526–40. doi: 10.1002/(SICI)1522-2594(199909)42:3<526::AID-MRM15>3.0.CO;2-J. [DOI] [PubMed] [Google Scholar]
- Pierpaoli C. Diffusion MRI: Theory, Methods and Applications. Oxford University Press; New York: 2010. Artifacts in Diffusion MRI; pp. 303–18. [Google Scholar]
- Pierpaoli C, Jezzard P, Basser PJ, Barnett A, Chiro G Di. Diffusion Tensor MR Imaging of the Human Brain. Radiology. 1996;201(3):637–48. doi: 10.1148/radiology.201.3.8939209. [DOI] [PubMed] [Google Scholar]
- Pierpaoli C, Walker L, Irfanoglu MO, Barnett A, Basser P, Chang LC, Koay C, Pajevic S, Rohde G, Sarlls J. TORTOISE: An Integrated Software Package for Processing of Diffusion MRI Data. Book TORTOISE: An Integrated Software Package for Processing of Diffusion MRI Data. 2010;18:1597. (Editor Edˆ Eds) [Google Scholar]
- Rapacchi Stanislas, Wen Han, Viallon Magalie, Grenier Denis, Kellman Peter, Croisille Pierre, Pai Vinay M. Low B-Value Diffusion-Weighted Cardiac Magnetic Resonance Imaging. Investigative Radiology. 2011;46(12):751–58. doi: 10.1097/RLI.0b013e31822438e8. [DOI] [PMC free article] [PubMed] [Google Scholar]
- Scherrer Benoit, Warfield Simon K. Retrospective Local Artefacts Detection in Diffusion-Weighted Images Using the Random Sample Consensus (RANSAC) Paradigm. Biomedical Imaging (ISBI), 2012 9th IEEE International Symposium on. 2012:546–49. http://ieeexplore.ieee.org/xpls/abs_all.jsp?arnumber=6235606.
- Schiff Nicholas D. Central Thalamic Deep-Brain Stimulation in the Severely Injured Brain. Annals of the New York Academy of Sciences. 2009;1157(1):101–16. doi: 10.1111/j.1749-6632.2008.04123.x. [DOI] [PubMed] [Google Scholar]
- Sharman Michael A, Cohen-Adad Julien, Descoteaux Maxime, Messé Arnaud, Benali Habib, Lehericy Stéphane. Impact of Outliers on Diffusion Tensor and Q-Ball Imaging: Clinical Implications and Correction Strategies. Journal of Magnetic Resonance Imaging. 2011;33(6):1491–1502. doi: 10.1002/jmri.22577. [DOI] [PubMed] [Google Scholar]
- Styner Martin A. Entropy Results. 2015 Jan 2; [Google Scholar]
- Tournier Jacques-Donald, Mori Susumu, Leemans Alexander. Diffusion Tensor Imaging and Beyond. Magnetic Resonance in Medicine. 2011;65(6):1532–56. doi: 10.1002/mrm.22924. [DOI] [PMC free article] [PubMed] [Google Scholar]
- Voss Henning U, Uluç Aziz M, Dyke Jonathan P, Watts Richard, Kobylarz Erik J, McCandliss Bruce D, Heier Linda A, et al. Possible Axonal Regrowth in Late Recovery from the Minimally Conscious State. The Journal of Clinical Investigation. 2006;116(7):2005–11. doi: 10.1172/JCI27021. [DOI] [PMC free article] [PubMed] [Google Scholar]