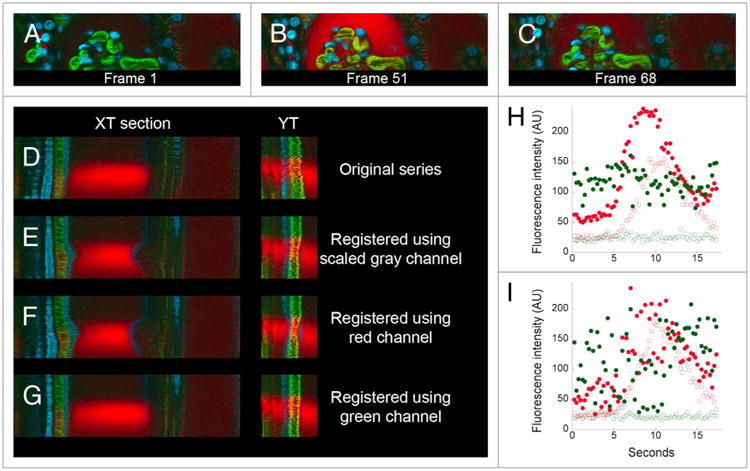
Figure 4.

Use of different color channels for digital correction of motion artifacts in a time series of images collected from the kidney of a living rat. (A) First of 68 images collected from the kidney of a living rat, following intravenous injection of 500,000 MW fluorescein dextran, 3000 MW TexasRed dextran and Hoechst 33342. (B and C) 51st and 68th frame after injection of a second injection of 3000 MW TexasRed dextran. (D–G) XT and YT sections from regions identified with white lines in Panel C. (D) Original data. (E) After registration based upon scaled gray channel. (F) After registration based upon green channel. (G) After registration based upon red channel. Image fields are 160 microns wide. (H and I) Quantification of the green and red signals in a region in the capillary (closed circles) or in a region 4 pixels (1.6 microns) away, in the Bowman's space (open circles). (H) After registration based upon the green channel. (I) original data.
